In Part 1 - Chrome Dev Tools: Markup and Style, we reviewed two panels: Elements and Resources. Moving on, now, we'll take a look at the next two panels: Network and Console.
Network Panel
The Network panel gives us a view into the resources that are requested and downloaded over the network in real-time. Viewing network traffic isn't the most glamorous activity - especially if you're new to web development. However, performance becomes an important issue, as your site's traffic increases. Identifying and fixing requests that take a long time to complete is an important step in optimizing a site.
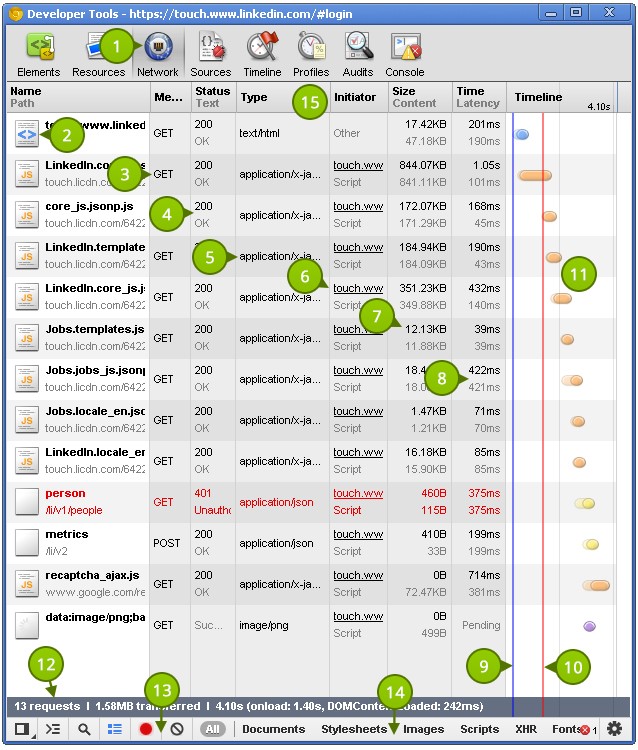
An HTTP proxy, such as Charles Proxy, can give you a decent amount of information regarding your website's network. That being said, the Network panel offers a surprising amount of detailed information; considering how it's only a few clicks away, it's certainly an excellent candidate for debugging network issues. The following is a screenshot of the Network panel when loading the Linkedin mobile site on a fresh page load:
$0returns the currently selected element in the Elements panel.
- This button opens the Network panel. Be sure to open the tab before loading a page so that it captures the network requests (e.g. open a new browser tab, open up developer tools, open up the network tab and then finally load the URL to monitor)
- This row contains one resource with interesting information that I cover in the following points. The first column is the name and path of the resource. The resource name will show on the first line while the path to the resource shows on the second.
- The HTTP method used for the request.
- The HTTP status code returned by the server.
200is a common response for a successful response; although anything within the range of 200-299 is considered OK. Notice how one of the above requests is in red. This is related to the HTTP response code, a 401 Unauthorized response, because I'm not logged in to the LinkedIn mobile site. - The content-type of a request. For example, in an HTTP POST (using the metrics resource as an example), the content-type in the request and response headers is:
application/json; whereas, the main HTML page's response headers contain a content-type oftext/html. A small note on the application cache: when serving a manifest file, be sure to serve it with a content type oftext/cache-manifest. When debugging, the "Type" column in the Network panel is the place to ensure it's being served correctly! - The initiator is an interesting column; it allows us to see why a resource is downloaded. For example, you may see the __utm.gif file often in your debugging sessions; it is used by Google Analytics. The initiator shows as
ga.js:52, a value infile_name:line_numberformat. With this column, you can discover why, when, and how resources are downloaded. IfParseris shown for the initiator, chances are good that the browser initiated the request upon seeing something like a<link />or<script />element in the document. - This displays the size of the resource, an invaluable piece of information. When building a site, be sure to regularly "sort by size" in the Network panel and ensure that your resource sizes are correct. It is sometimes considered a good practice to base 64 encode images and embed them in CSS files. This can reduce the number of HTTP requests, but it also increases your CSS file's size. Large resources should be delayed as much as possible to provide a snappy experience for the user.
- This displays the amount of time it took to retrieve the resource. Resources served from a different domain may take longer to download than other resources served from another origin.
- DOMContentLoaded (an event we can listen for using JavaScript) fires once the DOM is ready.
- The Load event which fires when the DOM is ready and resources have finished loading.
- Timeline view of network requests. You can hover over them for more information.
- Total size transferred, number of requests, and time taken.
- Icons to interact with the Network panel, such as clearing the panel of all requests and changing icon size.
- Useful network requests filters, e.g. you can control + click XHR and Images to only show network requests for an image resource or a request made with an XHR object.
- Headings for the network requests; you can click a heading to sort the requests by the data in the column.
Timing contains information on how long a request actually took to download.
Selected Resource Pane
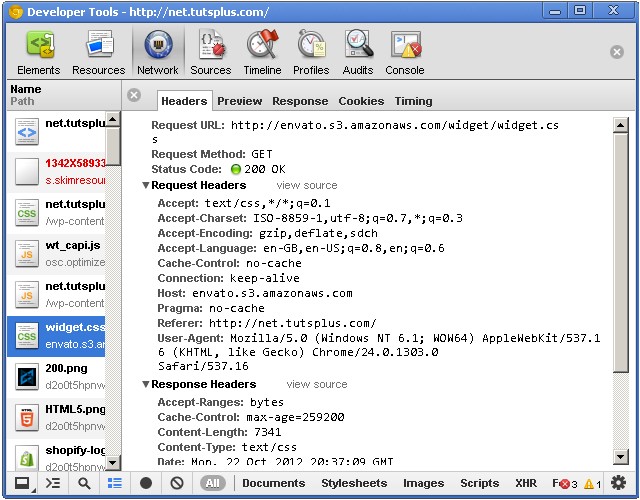
Clicking on a request displays more information in a new panel, splitting the Network panel into two vertical panes.
Errors stand out from other console entries thanks to their red color and icon.
The Selected Resource pane has tabs within itself, such as Headers, Preview, Response, Cookies & timing.
- Headers contains the request and response headers.
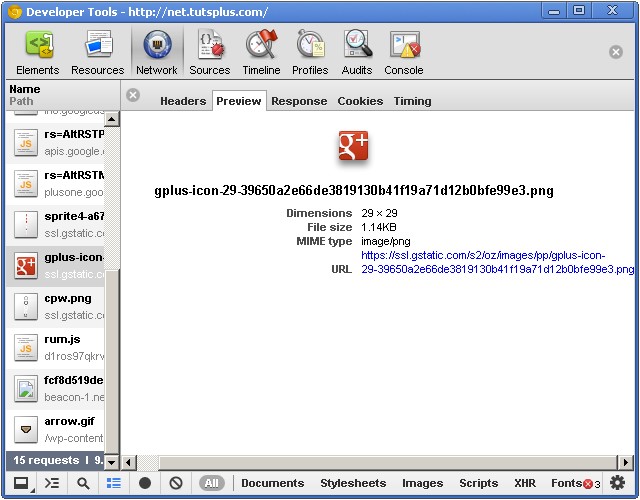
- Preview contains a preview of the resource, for example a rendered image or some source code.
- Response is similar to Preview and shows what was received from the server.
- Cookies (if any) shows cookies sent with the request.
- Timing contains information on how long a request actually took to download.
You can close this pane by clicking on the small X in the top left corner of the this pane.
Headers
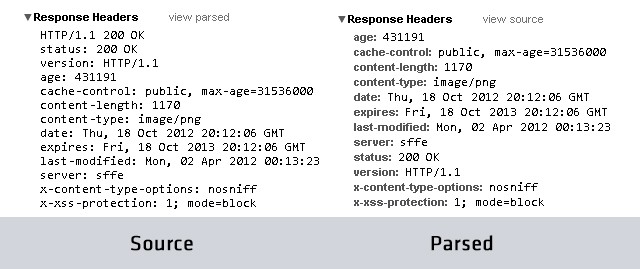
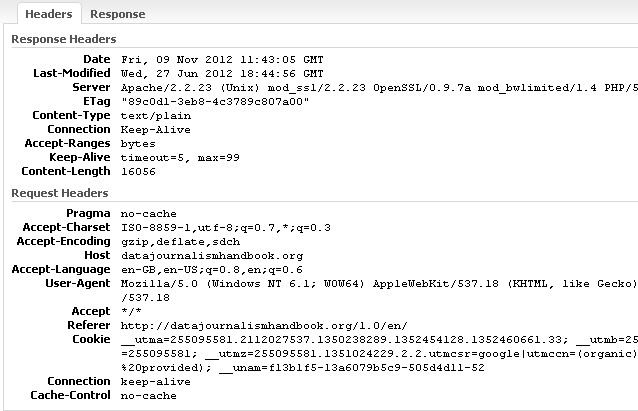
The Headers tab provides you with some interesting information, which can prove useful when debugging. It displays both the request and response headers.
Preview / Response
The Preview and Response tabs display a small preview of the selected resource. The developer tools is smart enough to correctly display the response's content. Images display as rendered images, XML as text, etc. You'll also find extra information such as image sizes, content-type, etc.
Timing
The Timing tab includes time for DNS lookups, SSL negotiation, time to send and receive bytes, and the time that was spent waiting for a response.
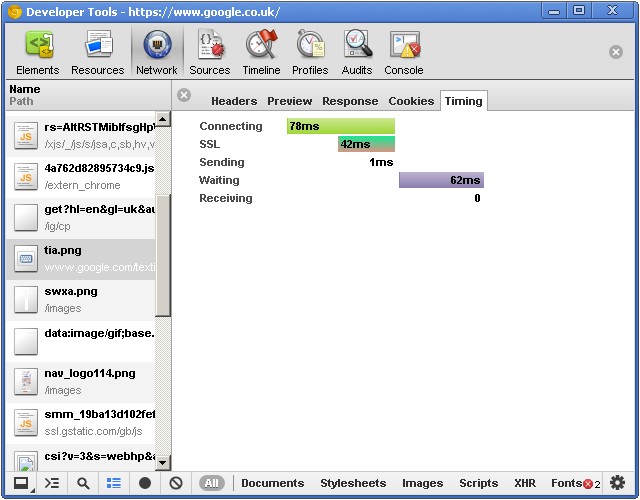
Basically, everything regarding time can be found within this tab.
Types of resources
The Chrome Developer Tools handles many common resources, and you'll get syntax highlighting in the preview for resources such as JavaScript, HTML, etc. Images will also display in their rendered form (very similar to the resources pane).
WebSockets
The Network panel has the ability to display the contents of a request made using the WebSocket protocol.
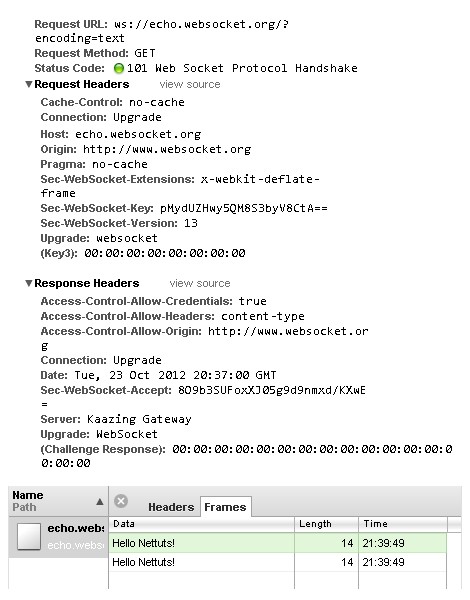
Clicking on such a request displays a new tab named "Frames", listing the frames sent and received.
Resource Context Menu
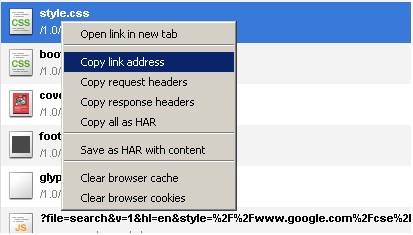
Right-clicking a particular resource within the Network panel brings up the resource context menu. There are a few options including:
- Clearing the browser cache and cookies to force the browser to download resources from the server.
- Copying the full URL of a resource to your clipboard.
- Copying the request and response headers of a resource is useful for debugging. The request headers often include things like the user-agent, the accepted languages the client supports, and possibly cookies. Response headers can include HTTP status codes, content lengths and server information.
- Viewing the associated HAR data, which I cover below.
HAR
Performance becomes an important issue, as your site’s traffic increases.
HAR stands for HTTP Archive, a JSON-based format that contains a list of resources loaded in the page. The format contains nodes such as:
-
creator- information about the client that generated the HAR. For example, Chrome's dev tools generates a HAR withcreator.nameset to "WebInspector". -
pages- contains a list of pages associated with the capture. Along with the page title, you'll also get apageTimingsobject which contains the page load time. -
entries- contains the bulk of the data, and is likely to be a large array of resources. Eachentrieselement can containrequest(cookies,headersSize,HTTPVersion,method,url,queryStringand more),response(bodySize,status,headersSize,cookiesand more),timings(blocked,connect,dns,receive,send,ssl&wait) and more.
Having all this data is great and opens all sorts of possibilities for automation, in regard to page performance. Once you possess HAR data, you can use an easy-to-use viewer called HAR Viewer.
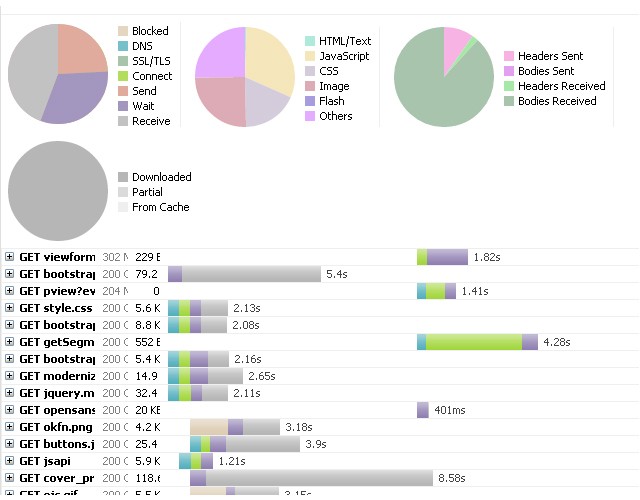
You can also view header information with each resource:
Console Panel
The Console Panel allows you to execute JavaScript code within the context of the currently loaded page. The console isn't ideal for writing large amounts of code, but it is excellent for small snippets. The following screenshot shows the Console Panel:
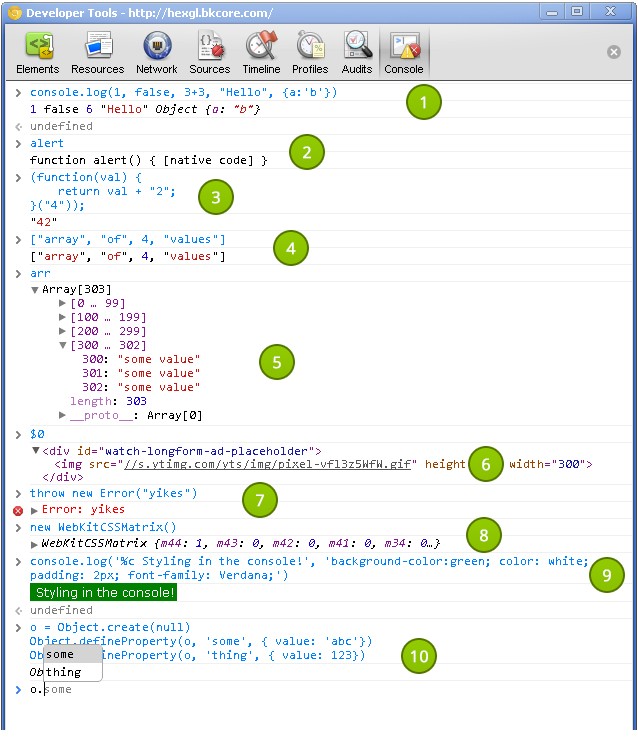
The console is excellent for small snippets.
-
console.logwrites the provided values to the console. There's no need to concatenate values together;console.logsupports multiple arguments of different types and writes each of them to the console. When you execute a command, you see the output in the immediately following line. - You may occasionally see "
[native code]" when attempting to view a native function's definition. - You can write functions and execute them. Be aware that pressing the enter key executes the code you typed into the console instead of inserting a new line. Hold shift+enter to insert a new line.
- An example of an array. Notice the colors are different for different types of values.
- An example of a large array with 303 elements. Notice how the elements are grouped together; this prevents the console from being flooded with large amounts of data.
-
$0is a shortcut to return the currently selected element in the Elements panel. Right-clicking on an element in the console gives you an option to view that element in the Elements panel. - Errors stand out from other console entries thanks to their red color and icon.
- We can access anything in the page's scope, including the window object. In the screenshot, I created a new
WebKitCSSMatrixobject. - You can also style console entries using CSS.
- The console provides code completion. Try typing in "
window." and see the vast amount of properties you can choose from!
UI
On the Network panel, we can filter the resources shown in the console by clicking on the filters at the bottom; this is similar to the filtering on the Console Panel. You can control + click the filters to show more than one type.

Logged messages can also be styled like so:
console.log('%cHello', 'color: green; font-weight: bold;');
Grouping
You can also group console entries by using console.group. The following screenshot shows an example:
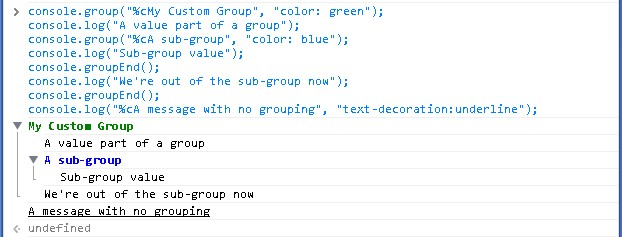
Use console.group() to start a group and console.groupEnd() to end it. Anything written to the console between those delimiters will appear inside the group. Try it for yourself:
console.group("%cMy Custom Group", "color: green");
console.log("A value part of a group");
console.group("%cA sub-group", "color: blue");
console.log("Sub-group value");
console.groupEnd();
console.log("We're out of the sub-group now");
console.groupEnd();
console.log("%cA message with no grouping", "text-decoration:underline");
Inspecting
Viewing the contents of an object is simple. For small objects, the console displays an object's contents in one line. Larger objects, however, appear as a collapsed group, and you can inspect them by clicking on the drop down arrow immediately to the left of the object.
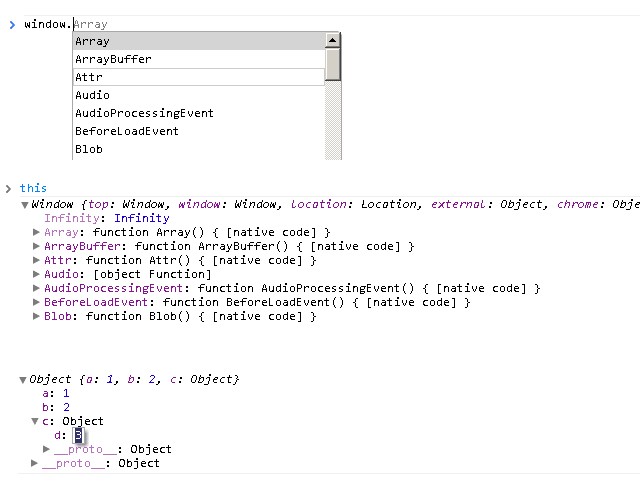
Double clicking an identifier inside an object automatically highlights, making it easy to copy, paste, and edit.
Miscellaneous
Learning keyboard shortcuts and other commands helps you work more efficiently. Here are some examples:
-
console.clear()clears the console; Control + L achieves the same affect. -
console.assert()throws an error if the passed argument doesn't resolve totrue. -
console.error()throws a custom error in the console. -
$0returns the currently selected element in the Elements panel. -
Esctoggles the console on any panel other than the Console panel.

Try the following:
console.clear();
console.assert(0 > 1);
console.error("Error message");
$0 //get the currently selected element
Until Next Time!
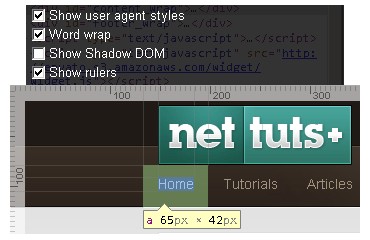
I hope you've learned a few new tricks. Please keep in mind that Chrome's developer tools are always in a state of flux. For example, a ruler tool was implemented shortly after we published the previous tutorial in this mini-series. Be sure to enable them and try it out!
In the following tutorial, we'll continue to look at JavaScript and discuss techniques to edit resources after a page has loaded. Thanks for reading!


Comments