When working on advanced
JavaScript code, like a 3D engine, you may ask yourself what you can do to optimize,
and how much time you should spend in some specific pieces of code. In this
tutorial, I will share several tools that provide insight into how your code is
performing, and show you how to make the most of user marks in the memory graph
to analyze your performance.
Can’t wait to see what this tutorial is about? Watch this video:
Feel free to ping me on Twitter (@deltakosh) if you want to discuss this article!
Need a Profiler?
One profiler that comes to mind is the integrated profiler you can find using new updates to the Internet Explorer F12 Dev Tools—enhancements that will also be available for Microsoft Edge. Of course, you can use any similar tools you prefer too on your dev box.
If you want to try this out on Android, iOS, or Mac OS, you can also use remote.IE to get an instance of Windows 10 Technical preview running in minutes. Then open the Internet Explorer “e” you’ve been avoiding (it is a temporary client shell that has Project Spartan’s new rendering engine configured), hit F12 and now you can see what I’ll show you:
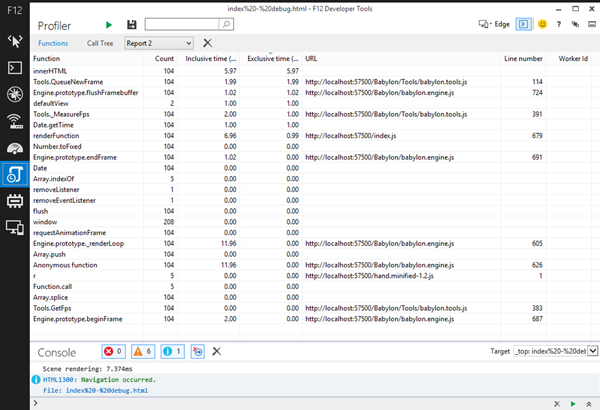
Please note that with the new F12 tools that we shipped with Windows 10 Technical preview, profiler is now part of the UI responsiveness window:
Let’s see other options that can give you more insights about how your code is performing.
console.time
You just have to call console.time()
and console.timeEnd() around the piece of code you want to evaluate. The
result is a string in your console displaying the time elapsed between time
and timeEnd.
This is pretty basic and can be easily emulated, but I found this function really straightforward to use.
Even more interesting, you can specify a string to get a label for your measurement.
This is, for instance, what I did for Babylon.js:
console.time("Active meshes evaluation");
this._evaluateActiveMeshes();
console.timeEnd("Active meshes evaluation");
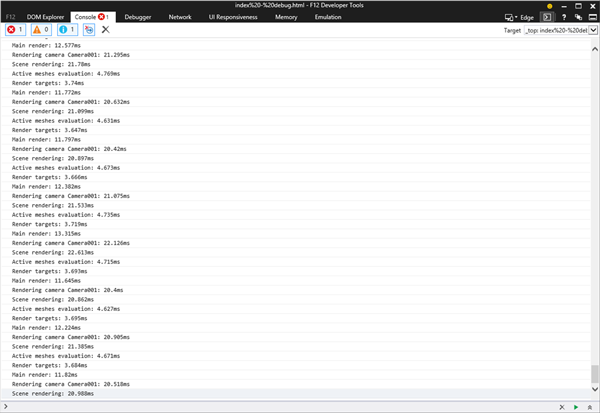
This kind of code can be found around all major features and then, when performance logging is enabled, you can get really great information:
Be warned that rendering text into the console can consume CPU power.
Even if this function is not per se a standard function, the browser compatibility is pretty great. Chrome, Firefox, IE, Opera and Safari support it.
Performance Object
If you want something
more visual, you can use the performance object as well. Among other interesting features to help you measure a
web page performance, you can find a function called mark that can emit
an user mark.
A user mark is the association of a name with a time value. You can measure portions of code with this API in order to get precise values. You can find a great article about this API by Aurelio de Rosa on SitePoint too.
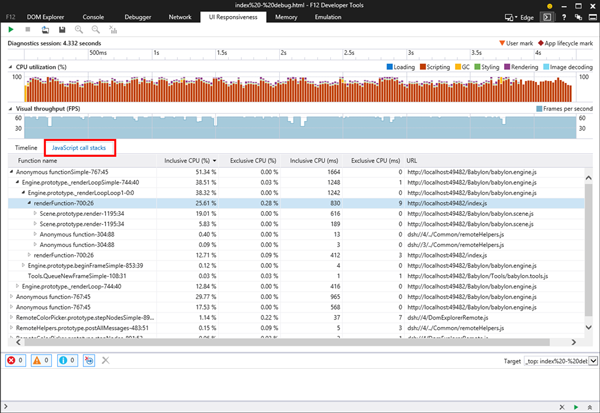
The idea today is to use this API to visualize specific user marks on the UI Responsiveness screen:
This tool allows you to capture a session and analyze how the CPU is used:
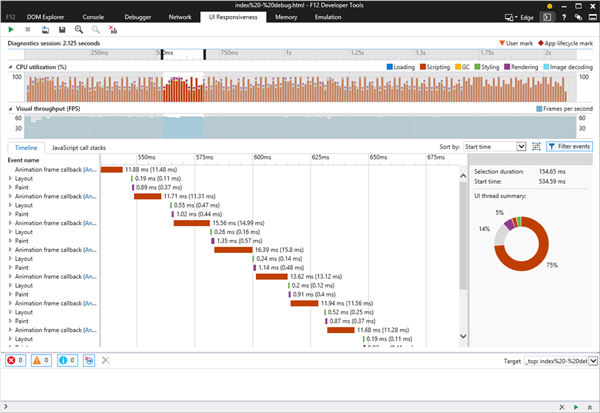
We can then zoom in on a specific frame by selecting an entry called Animation frame callback and right-clicking on it to select filter to event.
The selected frame will be filtered then:
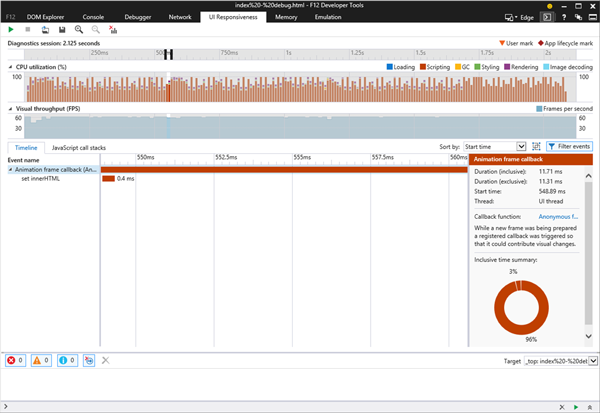
Thanks to the new F12 tool, you can then switch to JavaScript call stacks to get more details about what happened during this event:
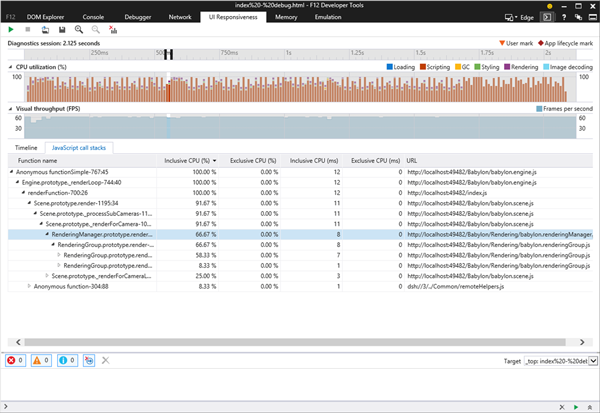
The main problem here is that it is not easy to get how code is dispatched during the event.
And this is where user marks enter the game. We can add our own markers and then be able to decompose a frame and see which feature is the more expensive and so on.
performance.mark("Begin of something…just now!");
Furthermore, when you create your own framework, it is super handy to be able to instrument your code with measurements:
performance.mark("Active meshes evaluation-Begin");
this._evaluateActiveMeshes();
performance.mark("Active meshes evaluation-End");
performance.measure("Active meshes evaluation", "Active meshes evaluation-Begin", "Active meshes evaluation-End");
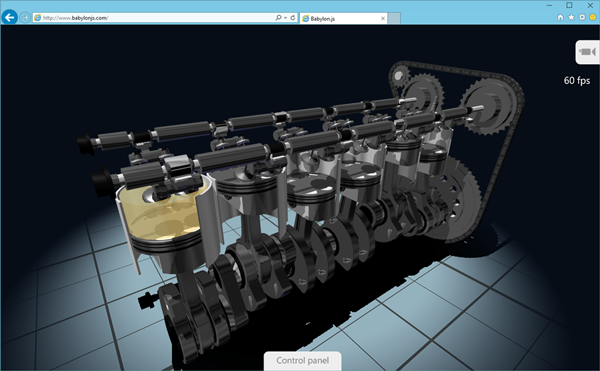
Let’s see what you can get with Babylon.js, for instance, with the “V8” scene:
You can ask Babylon.js to emit user marks and measures for you by using Debug layer:
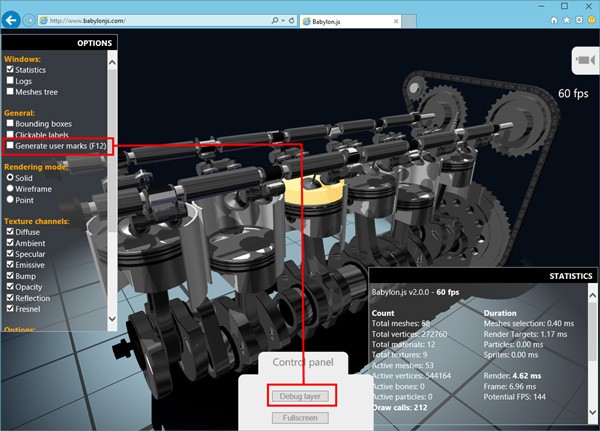
Then, using the UI responsiveness analyzer, you can get this screen:
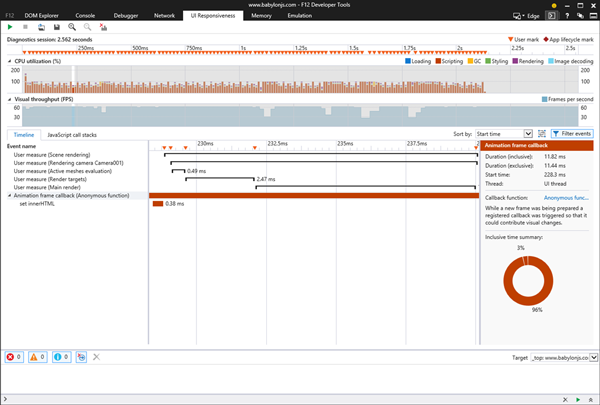
You can see that user marks are displayed on top of the event itself (the orange triangles) as well as segments for every measure:
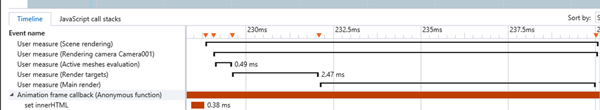
It is then super easy to determine that, for instance, the [Render targets] and [Main render] phases are the most expensive.
The complete code used by Babylon.js to allow users to measure the performance of various features is the following:
Tools._StartUserMark = function (counterName, condition) {
    if (typeof condition === "undefined") { condition = true; }
    if (!condition || !Tools._performance.mark) {
        return;
    }
    Tools._performance.mark(counterName + "-Begin");
};

Tools._EndUserMark = function (counterName, condition) {
    if (typeof condition === "undefined") { condition = true; }
    if (!condition || !Tools._performance.mark) {
        return;
    }
    Tools._performance.mark(counterName + "-End");
    Tools._performance.measure(counterName, counterName + "-Begin", counterName + "-End");
};

Tools._StartPerformanceConsole = function (counterName, condition) {
    if (typeof condition === "undefined") { condition = true; }
    if (!condition) {
        return;
    }

    Tools._StartUserMark(counterName, condition);

    if (console.time) {
        console.time(counterName);
    }
};

Tools._EndPerformanceConsole = function (counterName, condition) {
    if (typeof condition === "undefined") { condition = true; }
    if (!condition) {
        return;
    }

    Tools._EndUserMark(counterName, condition);

    if (console.time) {
        console.timeEnd(counterName);
    }
};
Thanks to F12 tools and user marks, you can now get a great dashboard about how different pieces of your code are working together.
More Hands-On With JavaScript
It might surprise you a bit, but Microsoft has a bunch of free learning on many open source JavaScript topics, and we’re on a mission to create a lot more with Microsoft Edge coming. Check out my own:
- Introduction to WebGL 3D with HTML5 and Babylon.JS
- Building a Single Page Application with ASP.NET and AngularJS
- Cutting Edge Graphics in HTML
Or our team’s learning series:
- Practical Performance Tips to Make your HTML/JavaScript Faster (a seven-part series from responsive design to casual games to performance optimization)
- The Modern Web Platform Jump Start (the fundamentals of HTML, CSS, and JavaScript)
- Developing Universal Windows Apps with HTML and JavaScript Jump Start (use the JS you’ve already created to build an app)
And some free tools: Visual Studio Community, Azure Trial, and cross-browser testing tools for Mac, Linux, or Windows.
This article is part of the web dev tech series from Microsoft. We’re excited to share Microsoft Edge and the new EdgeHTML rendering engine with you. Get free virtual machines or test remotely on your Mac, iOS, Android, or Windows device @ http://dev.modern.ie/.

Comments