What Is Stackify?
Stackify provides cloud-based server Application Performance and Monitoring and troubleshooting tools called Smart Error and Log Management (SmartELM). In this tutorial, I'm going to introduce you to its uniquely powerful SmartELM features, which are especially helpful to professional developers monitoring and troubleshooting post-deployment production code.
For many of us, logs are the neglected stepchildren of coding; for professional coders, they're essential but often fall short in their usefulness. Stackify changes this by providing a sort of live cockpit flight recorder for your application.
Once your application leaves production, exactly how accessible and useful are your log files? There's a ton of data. You need to get access to it. The files you need may be spread across multiple servers or service boundaries. These are flat files—hard to search and hard to read. They also often lack context—for example, which user account or method is related to the log entry. Then there's the complexity of managing the files as they grow—call the sysadmin, right? Good thing you've been nice to them lately.
Stackify's Smart Error Tracking and Log Management solves many of these problems.
At a high level, Stackify's SmartELM does the following:
- Aggregates all log and exception data to one service.
- Makes it available, instantly, to everyone on your team.
- Presents a timeline of logging throughout your entire stack, testing, and production server infrastructure.
- Is highly indexed, searchable, and “smart” about it.
Once you begin logging your application data to Stackify, you can do the following:
- Manage and search logs across all your apps and servers.
- Turn raw errors into query-able, contextualized, intelligent errors.
- View collections of logging statements related to a specific error.
- Receive alerts based on error rates and standing log queries such as new exceptions, spikes in errors, and the reappearance of resolved issues.
Ultimately, these features help you find and fix application problems faster.
You can run Stackify's Server and Application Monitoring together with Smart Logs and Error Management or you can run them independently. While this tutorial will mostly highlight SmartELM, I'll also walk you through the basics of the monitoring service.
Installing Stackify Monitoring
You can find the installation guide documentation for your platform here. I'm using Stackify with Linux.

Stackify provides monitoring support for Windows, Linux, and Azure, and error and logging for .NET and Java. Support for PHP, Node.js, Python, and Ruby is coming soon.
Visit the Settings menu and scroll down to get your activation key:

Log in to your server and run the following commands to install the agent in one step:
sudo -s
wget https://s1.stackify.com/Account/AgentDownload/Linux --output-document=stackify.tar.gz && tar -zxvf stackify.tar.gz stackify-agent-install-32bit && cd stackify-agent-install-32bit && ./agent-install.sh
You'll need to paste in the activation key from above. You should see something like this:

Give the application a bit of time to begin collecting data, and then you can continue onwards below. You can also explore the Stackify sandbox—there's a detailed feature overview in this blog post and sandbox instructions at the very end (scroll to the bottom of the page).
Stackify Dashboard
The Stackify dashboard gives you visibility into the health of your servers and applications with time-based telemetry and highlighting of events you should investigate.
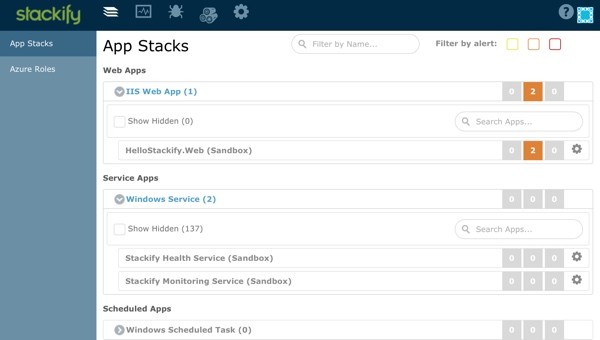
Once data comes in, your Stackify dashboard will look something like this:

Here's a closeup of the toolbar:

Stacks list the apps and services that you're running:
Monitoring shows you what's happening on specific servers:

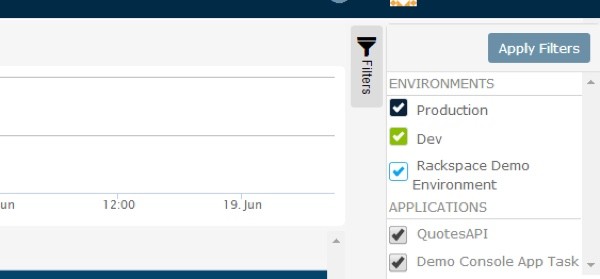
You can also filter between your development, test and production environments:
Now that you've got a high level sense of the Stackify environment, let's dive into the Smart Error Tracking and Log Management (SmartELM) more deeply.
Smart Error Tracking and Log Management
There are a few key scenarios that you'll want to use SmartELM for, such as identifying and getting notified of:
- New exceptions
- Reappearance or recurrence of resolved issues that you've set up filters for
- Spikes in errors in the last minute or the last hour
- Deeper analysis of the error and it's source
I'm going to walk you through how Stackify helps you with this. But first, let's address installation of the appropriate log appenders.
Stackify has created logging appenders for a handful of the most common frameworks. You can learn more about installing them from the online documentation: Logging and Metrics Installation Guides. I've also provided individual links below:
If you're using NuGet from Visual Studio, you can find and integrate the Stackify logging libraries and configurations quickly and easily. Just search for Stackify and then install the appropriate appender:
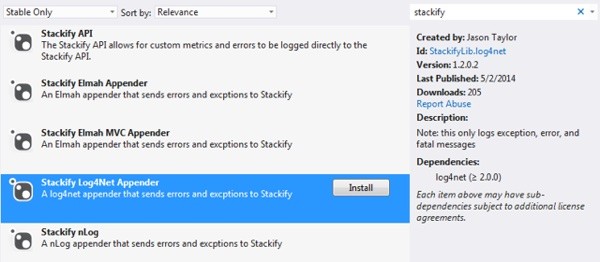
Once these are installed, Stackify will begin tracking and recording errors and logs.
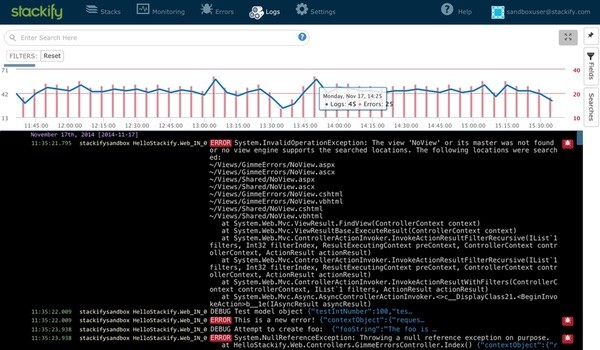
When you visit the Error's dashboard page, you'll see something like this:
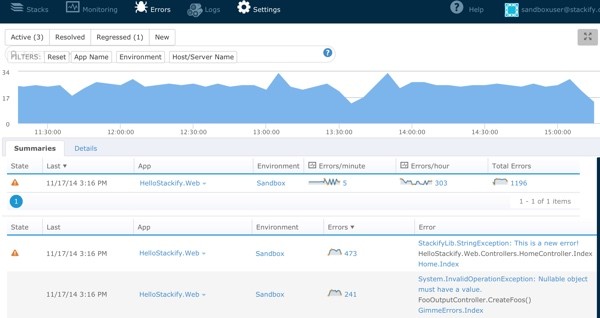
The graph at the top shows us a visual representation of error rates over time. The summaries detail specific errors occurring in our code. Stackify avoids duplicating reported errors, so you're just seeing unique occurrences.
This view can be completely customized with a variety of filters. You can click Active, Resolved, or Regressed to see issues based on their known state. You can set filters by App, Environment, or Server. And, you can customize the field set shown in the table view.
Let's say you want to look at a specific time range for an event. You can select that time range on the graph visually to constrain the errors query:

Notice how the charted time range of event frequency changes with the selection, and the error counts below the graph also adjust to show just those within the specific time range.
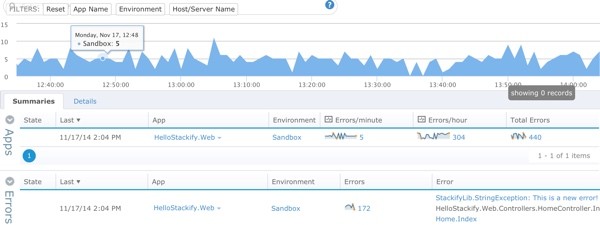
Let's zoom in on the first error appearing in Summaries. This error has occurred 172 times in this narrow time range, so we need to investigate it more:

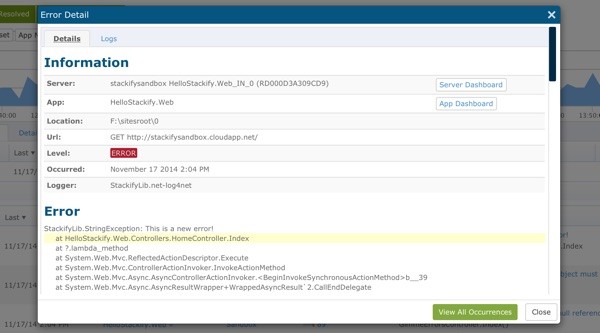
Click on the error description and you'll see a wide variety of information about the error. Here's the top line information:
Scroll down and you can see contextual data shown in JSON. We'll discuss below how you can log events with more granularity and context.
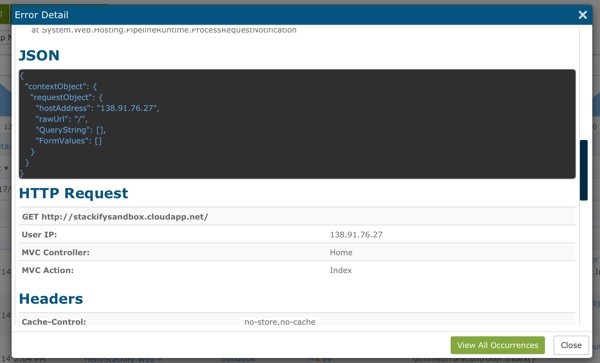
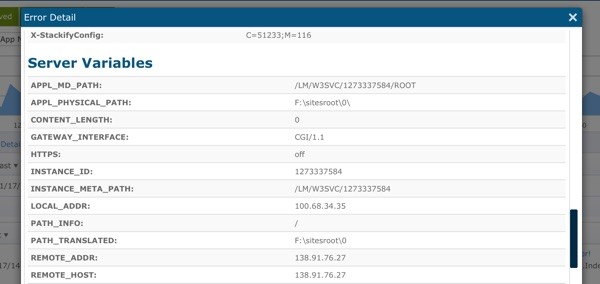
Scroll further and you can see Server Variables with the event:
Now, let's jump to the Log page (you can also narrow the time range by visual selection here too):
You're viewing the logs captured at the time of the error on your servers aggregated by Stackify without having to ask your SysAdmins for any special help or access.
You can also perform full text searches against these log files:

And you can save these searches to quickly filter into specific issues in production:

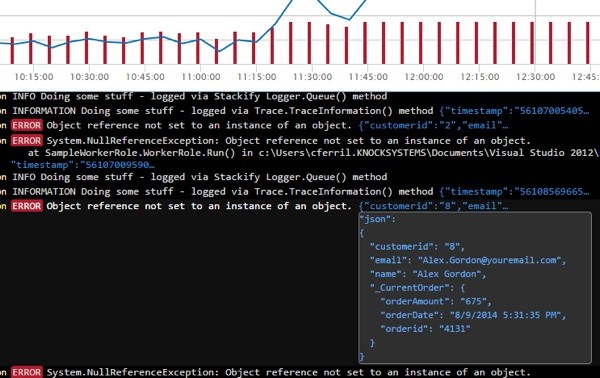
The bug icon is associated with bringing up the error details modal. Clicking on the blue hyperlink beginning section of the JSON is what shows the structured data that was logged.
Then, by clicking on the red "bug" icons, I can zoom into structured data which I logged with the event, such as customerid, email, and orderid:
Rethinking How Developers Log
Stackify's trying to encourage developers to rethink logging:
Logging is often one of the few lifelines you have in production environments where you can’t physically attach and debug. You want to log as much relevant, contextual data as you can.
In other words, log more, log more contextually—and Stackify will manage and help make sense of the data for you.
As mentioned earlier, Stackify has created logging appenders for a handful of the most common frameworks:
- log4net
- log4j
- nLog
- logback
- Elmah
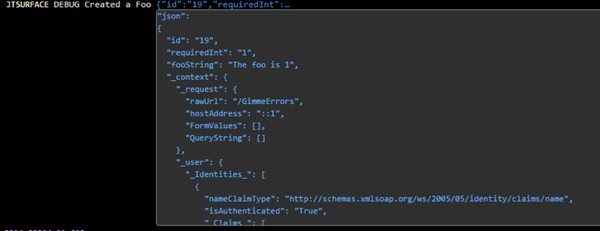
And you can write directly to its API to customize contextual log data. For example, a simple line of code to log an event with an object shown below:
log.Debug("Created a Foo", foo);
Generates detailed context in the Stackify view of the log file like this:
Other Scenarios Stackify Enables
Early Warning System for Spikes in Error Rates
You can ask Stackify to monitor error rates in your environment, notifying you of warning or urgent thresholds:

Ensuring Background Tasks Run
You can set these for expected system events as well. For example, you can set a rate monitor to verify that your background task runs three times every fifteen minutes; if it doesn't, Stackify will alert you.
You can set up notification groups as well, so that the right people get notified with the right events:

Assessing Test Script Coverage
You can also measure the change in error rates as you move code from test to production. For example, if your test scripts aren't turning up the same errors and error rates as you later experience in production, Stackify can help you identify areas of the code that need more automated test coverage.
Learn More About SmartELM
You can read more about SmartELM in action in Smarter Errors & Logs: Putting the Data to Work in the Stackify blog. You can find deeper documentation on the Errors Dashboard here and the Logs Dashboard here.
I hope you're impressed by Stackify's SmartELM solutions. I learned a lot getting to know the product.
In Closing
Stackify's sophisticated cloud-based error tracking and log management service lets you:
- Get notified by email or text on new and regressed errors and error spikes.
- Jump to logs with structured context data from your code.
- Conduct an enhanced text search throughout your errors.
- Filter logs by error, by time, or by custom variables, e.g. IP address or customer ID.
- Save searches and monitor searches.
- Notify the right team members right on time.
Stackify is actively encouraging developers to change their mindset to logging and is providing powerful features that make it worthwhile to do so, i.e. log more, log smart with Stackify; they'll manage the data and show yo contextual data around the issue you're investigating. Stackify also has an application monitoring tool that is fully integrated with the SmartELM platform presented in this article, allowing developers to also monitor overall application performance, customer satisfaction, servers, database, specific URLs, and custom metrics.
Stackify's a tool for professional developers who want to up their game where it counts, in production.
Sign up for a free trial at Stackify; you can get access to their white papers through the site as well.
Please post any comments or additional ideas below. I try to participate in the discussions. Let us know if you'd like to learn more about Stackify. You can browse my other Tuts+ tutorials on my author page or follow me on Twitter @reifman.
Related Links
- Stackify.com
- Smart Error & Log Management (Overview)
- Stackify Case Studies
- 3 Ways to Make Sense of Errors & Logging (Stackify blog)
- 3 Data Sets That Bring Context to Exceptions (Stackify blog)
- Smarter Errors & Logs: Putting the Data to Work (Stackify blog)

Comments