We, as developers, write code. Now we're not just writing, we're also checking if the written code works. We spend a lot of time and put in much effort, ensuring that our programs do what they are supposed to do. This debugging process is often times painful. Especially if we are not using the proper instruments. To help with this issue, today's article introduces Deb.js, a small JavaScript library that helps you to debug from within the browser.
The Example
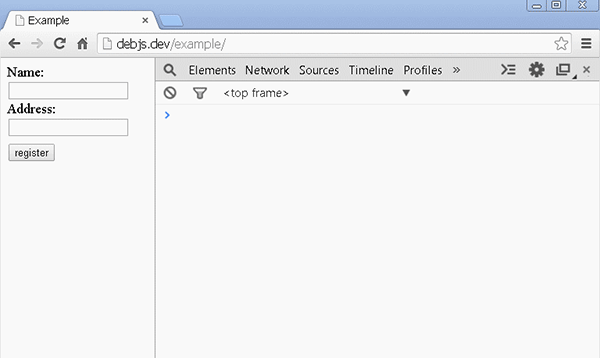
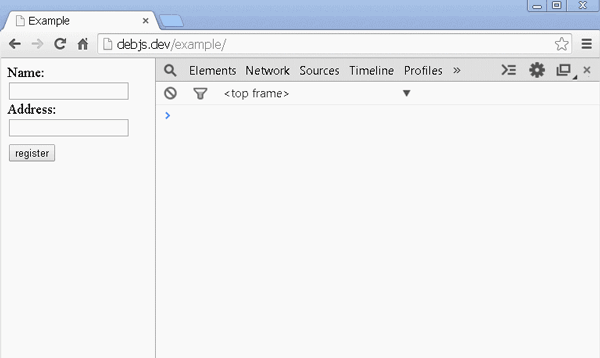
Let's start by creating a simple page with some JavaScript interaction. We will create a form with two fields and a button. Once the user clicks on the button, we will collect the data and will output a message in the console. Here is the page's markup:
<form>
    <label>Name:</label>
    <input type="text" name="name" />
    <label>Address:</label>
    <input type="text" name="address" />
    <input type="button" value="register" />
</form>
<div data-element="output"></div>
In order to simplify the example, we will use jQuery for the DOM selection and events. We will wrap the functionality in the following module:
var Module = {
    collectData: function(cb) {
        var name = $('[name="name"]').val();
        var address = $('[name="address"]').val();
        if(name != '' && address != '') {
            cb(null, { name: name, address: address });
        } else {
            cb({msg: 'Missing data'});
        }
    },
    error: function(err) {
        $('[data-element="output"]').html(err.msg);
    },
    success: function(data) {
        $('[data-element="output"]').html('Hello ' + data.name + '!');
    }
}
The collectData function gets the value from the fields and checks if the user typed something. If not, then it fires the callback with an object containing a short error message. If everything is OK, it responds with null as the first parameter and another object as the second, holding the data. The developer that uses the module, should check if there is an error object passed. If not, then start using the second received argument. For example:
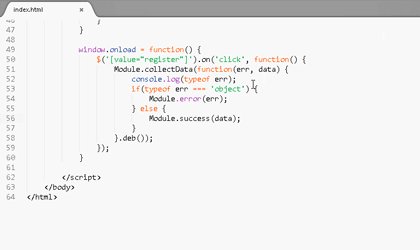
$('[value="register"]').on('click', function() {
    Module.collectData(function(err, data) {
        if(typeof err === 'object') {
            Module.error(err);
        } else {
            Module.success(data);
        }
    });
});
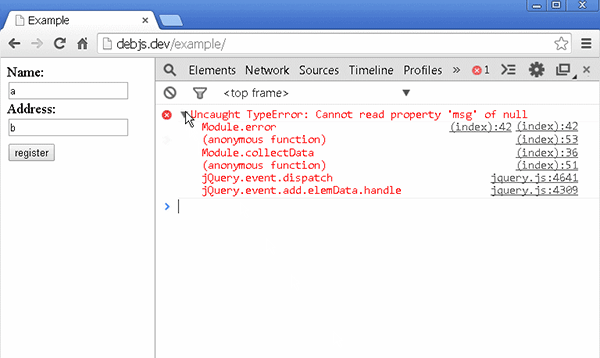
So, we check if the err parameter is an object and if yes, then we show the message. If we look carefully into the code, we will spot the problem but let's check how everything works:
When there is no data, our script works as expected. There is Missing data text displayed below the form. However, if we add something into the fields and press the button, we get an: Uncaught TypeError: Cannot read property 'msg' of null, message. Now, let's hunt down the bug and remove it.
The Traditional Approach
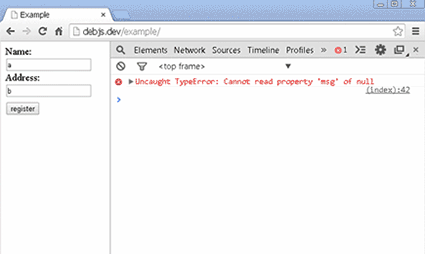
Google Chrome has wonderful instruments for solving such problems. We may click on the thrown error and see its stack trace. We could even go to the exact place where the error was produced.
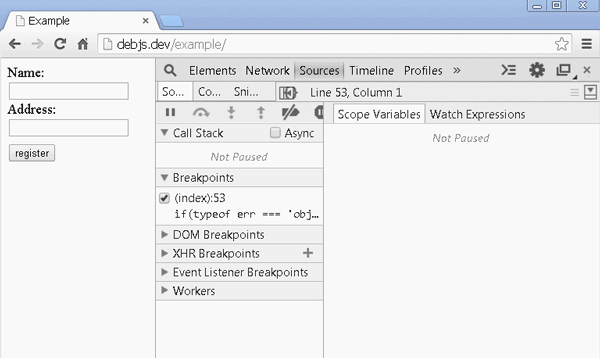
It looks like the error method of our module receives something that is null. And of course, null doesn't have a property called msg. That's why the browser throws the error. There is only one place where the error function is invoked. Let's put a breakpoint in and see what happens:
It looks like we received the right data object and error is equal to null, which is the correct behavior. So, the problem should be somewhere in the if clause. Let's add a console.log and see if we are going in the right direction:
Module.collectData(function(err, data) {
    console.log(typeof err);
    if(typeof err === 'object') {
        Module.error(err);
    } else {
        Module.success(data);
    }
});
And indeed, the typeof err returns object. That's why we are always showing an error.
And voila, we found the problem. We just have to change the if statement to if (err) and our little experiment will work as expected.
However, this approach can be difficult sometimes so consider the following pointers:
- As we saw, we ended with logging a variable. So, setting the breakpoint is not always enough. We have to jump to the console too. At the same time, we have to look at our code editor and the Chrome's debugging panel. These are several different places to work in, both of which could be annoying.
- It is also a problem if we have a lot of data logged into the console. Sometimes it is difficult to find out the needed information.
- This approach doesn't help if we have a performance issue. More often than not, we will need to know the execution time.
Stopping the program at runtime and checking its state is priceless but there is no way for Chrome to know what we want to see. As it just so happened in our case, we have to double check the if clause. Wouldn't it be better if we had a tool directly accessible from within our code? A library that brings similar information like the debugger, but lives inside the console? Well, Deb.js could be the answer to this question.
Using Deb.js
Deb.js is a tiny piece of JavaScript code, 1.5 kilobytes minified, that sends information to the console. It could be attached to every function and prints out:
- The function's execution place and time
- Stack trace
- Formatted and grouped output
Let's see what our example looks like, when we use Deb.js:
We again see the exact passed arguments and the stack trace. However, notice the change in the console. We work on our code, find out where the problem may be and add .deb() after the function's definition. Notice that the type of the err is placed nicely inside the function. So, we don't have to search for it. The output is also grouped and painted. Every function that we want to debug will be printed with a different color. Let's now fix our bug and place another deb() to see how it looks.
Now we have two functions. We could easily distinguish between them because they are in different colors. We see their input, output and execution time. If there are any console.log statements, we will see them inside the functions where they occur. There is even an option to leave a description for better function recognition.
Notice that we used debc and not deb. It's the same function, but the output collapses. If you start using Deb.js, you will very soon find out that you don't always want to see everything.
How Deb.js Was Made
The initial idea came from Remy Sharp's blog post about finding where the console.log occurs. He suggested that we can create a new error and get the stack trace from there:
['log', 'warn'].forEach(function(method) {
  var old = console[method];
  console[method] = function() {
    var stack = (new Error()).stack.split(/\n/);
    // Chrome includes a single "Error" line, FF doesn't.
    if (stack[0].indexOf('Error') === 0) {
      stack = stack.slice(1);
    }
    var args = [].slice.apply(arguments).concat([stack[1].trim()]);
    return old.apply(console, args);
  };
})
The original post can be found on Remy's blog. This is especially helpful if we develop in a Node.js environment.
So, with the stack trace in hand, I somehow needed to inject code into the beginning and at the end of the function. This is when the pattern used in Ember's computed properties popped into my head. It's a nice way to patch the original Function.prototype. For example:
Function.prototype.awesome = function() {
    var original = this;
    return function() {
        console.log('before');
        var args = Array.prototype.slice.call(arguments, 0);
        var res = original.apply(this, args);
        console.log('after');
        return res;
    }
}

var doSomething = function(value) {
    return value * 2;
}.awesome();
console.log(doSomething(42));
The this keyword in our patch, points to the original function. We may run it later which is exactly what we needed, because we could track the time before and after the execution. At the same time, we are returning our own function that acts as a proxy. We used .apply(this, args) in order to keep the context and the passed arguments. And thankfully to Remy's tip, we may get a stack trace too.
The rest of the Deb.js implementation is just decoration. Some browsers support console.group and console.groupEnd which helps a lot for the visual look of the logging. Chrome even gives us the ability to paint the printed information in different colors.
Summary
I believe in using great instruments and tools. The browsers are smart instruments developed by smart people, but sometimes we need something more. Deb.js came as a tiny utility and successfully helped to boost my debugging workflow. It's, of course, open source. Feel free to report issues or make pull requests.
Thanks for reading.

Comments