If you arrived here from the Optimizing WordPress with Varnish and W3 Total Cache tutorial, you already have a pretty well optimized WordPress installation. If not, you may want to go back and review our guide to Varnish and W3TC.
We're going to show you how to use New Relic's free server monitoring to see within your WordPress and PHP stack.
What's New Relic?
New Relic is a performance monitoring service which runs with a variety of server and language technologies, including PHP, which makes it great for optimizing WordPress.
W3TC provides built-in integration with New Relic's PHP monitoring daemon - so you can track performance on your WordPress stack at a deeper level. This can help monitor and diagnose unexpected slowdowns that might be related to your server performance, a slow theme, plugin, database query, third-party API or more.
If you're curious about what goes into a high performing WordPress site, read this guide to WordPress optimization written by the creator of W3TC, Frederick Townes.
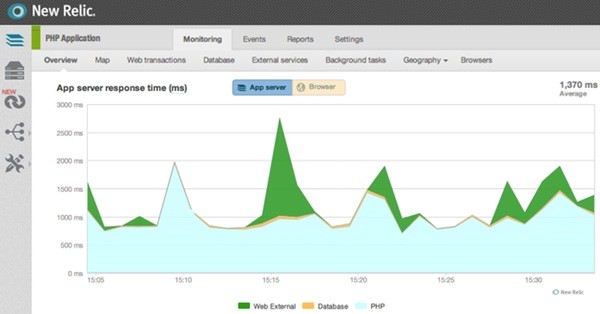
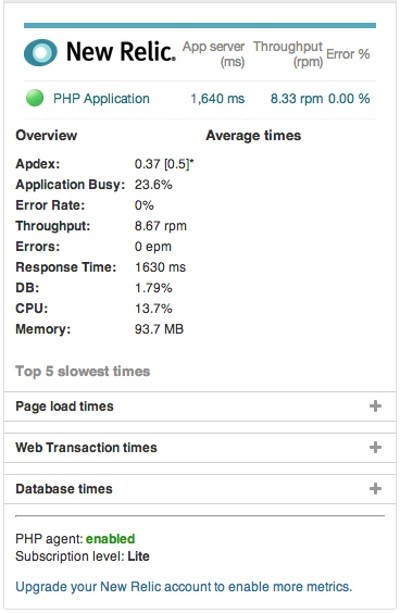
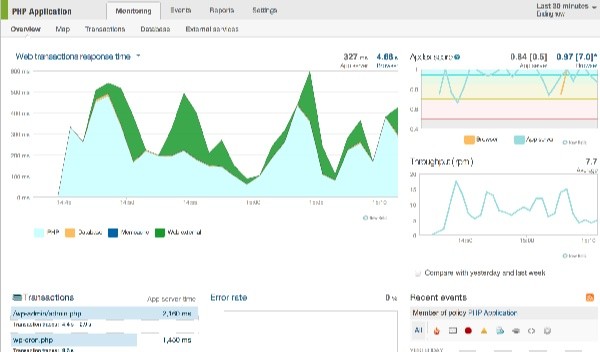
When you run New Relic on your server, you can get detailed performance monitoring graphs and statistics about your server and PHP including: response time, Apdex score (the ratio of satisfactory response times to unsatisfactory response times), throughput (requests per minute), web transactions e.g. third-party API requests, error rate, recent events and server information.
How to Install New Relic
For WordPress, I recommend signing up for a free trial account at the New Relic W3TC partnership page. However, you can also sign up at NewRelic.com:

Depending on where you sign up and what you install, you will have different features exposed by default in New Relic.
Once you've completed registration, follow the installation instructions on the Debian Ubuntu-based systems page appropriate for your registration (by the way, I'm running WordPress at DigitalOcean on Ubuntu 14.04).
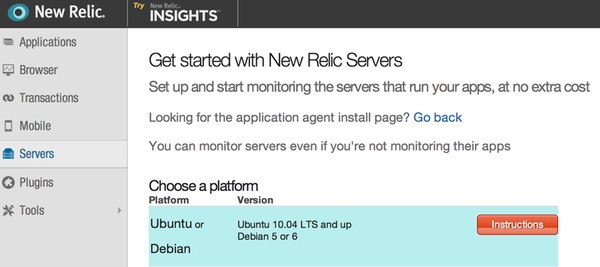
1. Add the New Relic apt repository:
echo deb http://apt.newrelic.com/debian/
newrelic non-free >> /etc/apt/sources.list.d/newrelic.list
Trust the New Relic GPG key:
wget -O - http://download.newrelic.com/548C16BF.gpg | sudo apt-key add -
Update and local package list and install New Relic:
sudo apt-get update
2. Install the New Relic System Monitor:
If you're using the W3TC New Relic setup, it will be:
apt-get install newrelic-php5
newrelic-install install
If you're using the standard New Relic setup, it will be:
apt-get install newrelic-sysmond
3. Configure and Launch the New Relic System Monitor:
If you're using the W3TC setup, it will have asked you for your license key. If you're using the generic New Relic setup, do this:
nrsysmond-config --set license_key=your-license-key-goes-here
Start the New Relic daemon:
/etc/init.d/newrelic-sysmond start
Whichever approach you use, restart your web server:
service apache2 reload
After a few minutes, you should see the red message on the setup page indicating that data is flowing into New Relic from your server. Cool, huh?
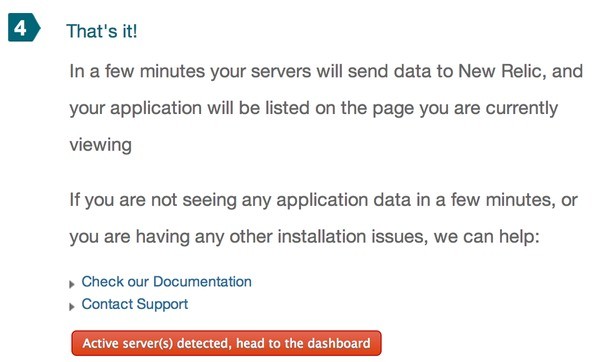
If you run into any problems, review the detailed PHP installation instructions or visit the New Relic troubleshooting page.
You'll see something likes this once data starts coming in:

Activate New Relic within W3 Total Cache
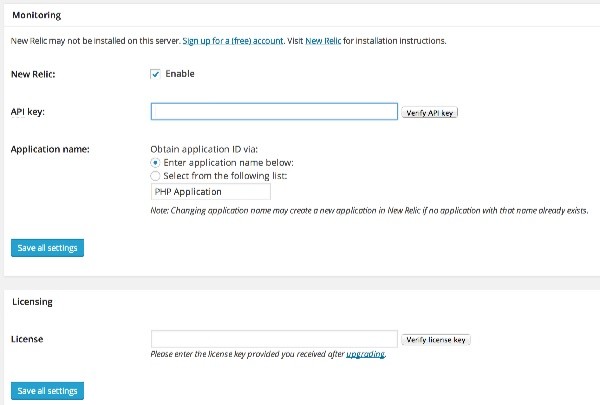
If you're using the W3TC integration, you'll need to visit your New Relic Account Settings to get your license key again and also create an API key. Click the Integrations -> Data Sharing tabs to enable the API and get your key.
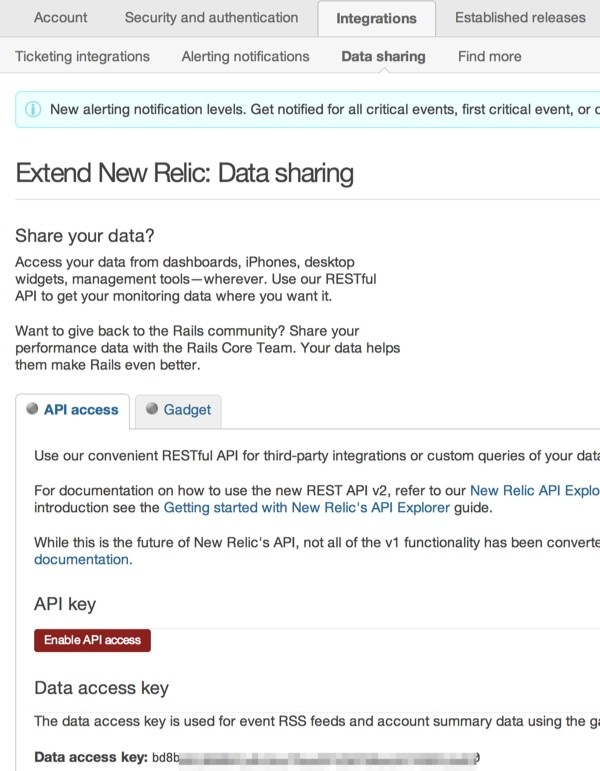
Then, from your WordPress Administration Console, click Performance -> Monitoring. Click sign up for a free account. Copy the details for your API and license key.
Enabling New Relic on your server provides for monitoring from the W3TC dashboard, such as shown below:
Monitoring Your WordPress Performance
New Relic is useful for evaluating WordPress performance in three key ways:
- Monitoring MySQL performance. Poorly written themes or plugins can definitely harm performance. Or, as your site grows, native WordPress queries may slow it down.
- Apdex gives you a quantitative measurement of the usability experiences of your site based on response time.
- Monitoring the performance of third party plugins and APIs. WordPress offers a powerful array of plugins and services to add to your blog, but some can kill performance. New Relic can help you identify problem areas.
Again, depending on your configuration in New Relic, you'll see the W3TC partnership dashboard for monitoring a PHP application:
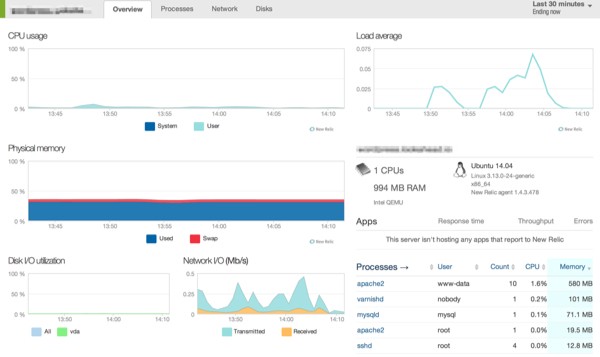
Or, you'll see the four tabs that summarize your server's performance:
First, the Overview tab offers insights into CPU, memory usage, disk and network I/O, and load as well as information about your hardware and most active processes:
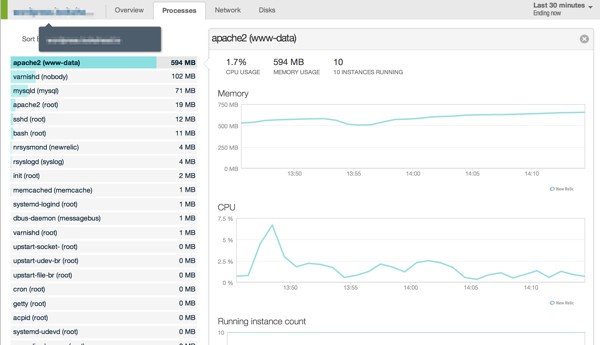
Next, the Process tab shows you the memory and CPU utilization of each process:
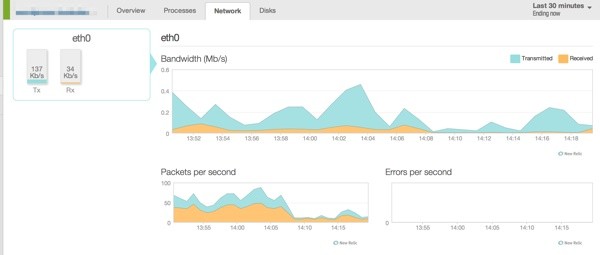
Thirdly, the Network tab
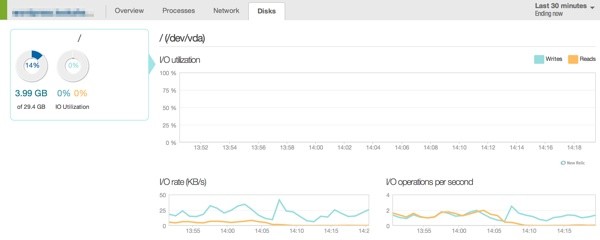
Then there is the Disk tab
With the W3TC installation, you can monitor transactions showing the most requested PHP scripts:

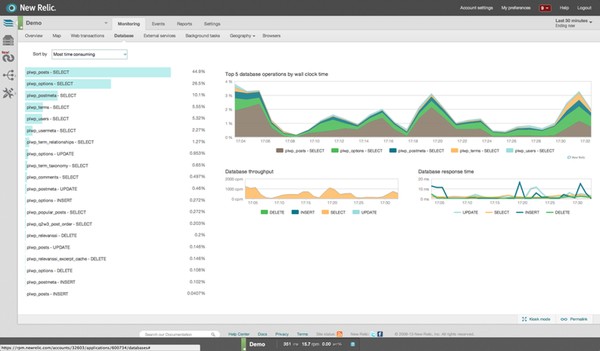
You'll also be able to monitor your MySQL database:
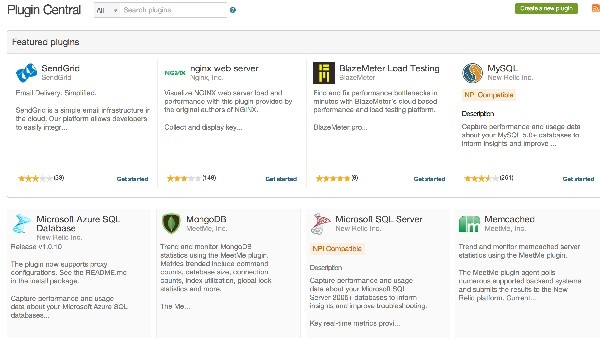
You can also install plugins for any service you want to monitor:
Diving deeper into New Relic requires an investment of time, but the results are well worth it. With this tool, can you see inside your WordPress stack to quickly pick out problem areas that need addressing.
Looking Ahead
While you can use New Relic Lite forever, once your two week trial expires, you might want to upgrade to the Pro plan ($149/month) to keep the same levels of service.
It's also important to occasionally update New Relic and check on its log files. Review the New Relic maintenance guide.
If you have any questions or corrections, please post them in the comments. If you'd like to keep up on my future Tuts+ tutorials and other series, please visit my author page or follow @reifman.


Comments