People often complain that WordPress is slow. Whether or not this is true depends on many factors, but if we can see server resources inside the WordPress dashboard, then it may give some insight about how well our WordPress installation is operating.
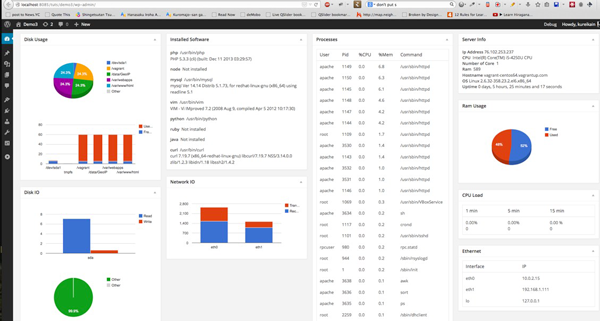
In this tutorial, we will be crafting a plugin to show server status including disk space, memory consumptions, CPU usage, and process usage.
We will also learn about WordPress cache to avoid querying these metric over and over and we will also cover WordPress cron jobs to generate this data automatically.
The administrator dashboard, by default, presents us with a couple of blocks called widgets. These include:
The widgets can be re-ordered by preference, and can be shown or hidden - generally speaking, the dashboard is customizable.
Since widgets are very flexible and available right on the first screen of the administrator screen, we can use them to show server resource: disk status, RAM usage, CPU usage, and operating system information. We will call these resources "metrics" for short.
Throughout this serious we will learn the Dashboard Widgets API and Roles and Capabilities to make these widgets available to some users because the data could be sensitive.
To do that, we will also learn some basic Linux commands to pull server information and seed to our widget dashboard. We will use Transients API to cache these data. Cronjobs will be leveraged to automatically pull these data instead of getting them on demand on every request.
The work of our plugin is inspired by Linux Dash.
Our plugin supports nine kinds of metrics. As a result, we will have nine dashboard widgets.
- Server information: the operating system, the Linux kernel, the up time, etc.
- CPU load: average load of CPU in 1, 5 and 15 minutes
- RAM usage of physical RAM and swap file
- Disk usage
- Installed software
- Processes
- Ethernet
- Network performance
- IO stat
Requirements
- A Linux environment. Mac OS X is still an option but some of the commands to check the above metrics aren't available, so if you receive a command not found error, then you know there is no Mac support for that command.
- Basic understanding of the shell
- Basic WordPress plugin understanding.
The Plugin Skeleton Structure
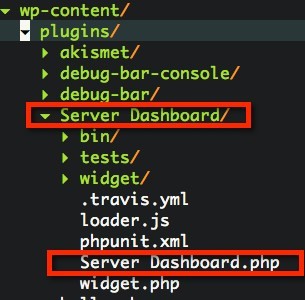
Let's create a simple plugin and call it Server Dashboard. We will start with some basic things. A traditional Hello World will help you have a taste of adding a widget to dashboard.
It's easy, actually.
Creating a folder call Server Dashboard inside wp-content/plugins, and a file serverdashboard.php. The folder layout looks like this. Just focus on the main file and ignore the bin, tests, widgets and so on.
Use this code for serverdashboard.php
<?php
/*
Plugin Name: Server Dashboard
Version: 0.1-alpha
Description: Server Status Dashboard
Author: Vinh
Author URI: http://axcoto.com
Plugin URI: http://axcoto.com
Text Domain: Server Dashboard
Domain Path: /languages
 */
namespace AX\StatBoard;
require_once plugin_dir_path( __FILE__ ) . '/widget.php' ;

class Dashboard {
  protected static $_instance=NULL;

  function __construct() {
  }

  /**
   * Create an unique instance throught the app
   */
  public static function instance() {
    return self::$_instance = self::$_instance ?: new self();
  }

  /**
   * Start to setup hook
   */
  public function run() {
    add_action( 'wp_dashboard_setup', array( $this, 'add_dashboard_widgets' ) );
  }

  function remove_dashboard_widgets() {

  }

  function add_dashboard_widgets() {
    syslog(LOG_DEBUG, "Run");

    wp_add_dashboard_widget(
        'hello_world_dashboard_widget', // A Slug to identify this widget
                 'Hello World', //Widget title
                 function () {
                   echo 'Hey, I\'m the body of widget. Thanks for bring me to the life.';
                 } //function to render content of widget, I'm using a closure here
      );

    }

}

Dashboard::instance()->run();
?><br><br>
I used namespace AX\StatBoard to avoid name collision with different plugins class, function name of themes, and other plugins. run to register hook or filter with WordPress. To add a widget, we have to hook into action
wp_dashboard_setup. This hooks grant us access to Dashboard's related customization option. It enables us to add or remove the dashboard widget from WordPress. wp_add_dashboard_widget to register a widget. It requires arguments in this order:-
Widget ID is used to identify slug for your widget. This slug is used when rendering CSS id,class and as keys in widget array.
- Widget Title displays on title of widget box
-
Callback to render the content of widget. It should output content directly, doesn't need to return.
Most of time, we will encounter callbacks as a single function, an anonymous function, an array of object and method, or array of class and static method.Refresh your dashboard. Our plugin shows its widget. Notice the
id of widget div element.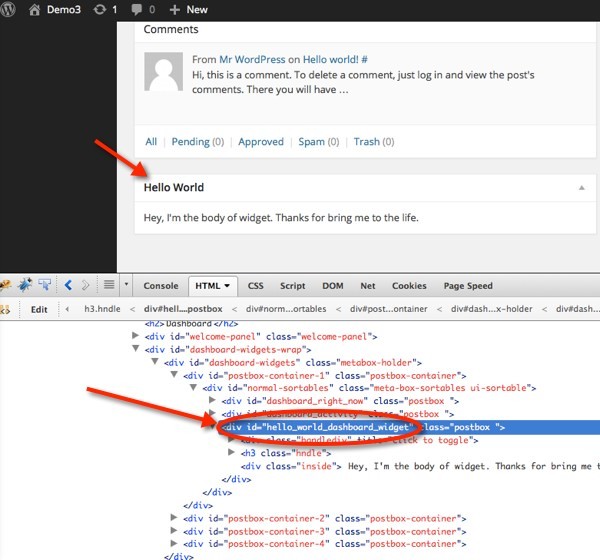
Let's advance this. We will show a pie chart with some dummy data. To keep thing simple, I'll be using the Google Chart API. We will extensively use it later for server metrics because it's better to visualize this kind of data.
If you don't like Google Chart, you can get rid of it and put your favorite chart library. Remember that this is a tutorial, so don't limit yourself - use whatever it is you're comfortable with using!
We need to load the Google Chart script. Change your run() method to register one more hook.
  public function run() {
    add_action( 'wp_dashboard_setup', array( $this, 'add_dashboard_widgets' ) );
    add_action( 'admin_enqueue_scripts', array($this, 'add_asset'));
  }
admin_enqueue_scripts is the action that you need to hook into for adding your own script in administrator dashboard. We will add one more method call add_asset in our class to handle script loading. The implement of add_asset.
  /**
   * Add javascript
   */
  function add_asset() {
    wp_enqueue_script( 'google-chart', 'https://www.google.com/jsapi' );
  }
We have the chart library. Now we have to render it inside our dashboard. You can play around with Google Chart. We will just re-use their example now. function add_dashboard_widgets() {
syslog(LOG_DEBUG, "Run");
wp_add_dashboard_widget(
'hello_world_dashboard_widget', // A Slug to identify this widget
'Hello World', //Widget title
function () {
echo <<<'EOD'
Hey, I'm the body of widget. Thanks for bring me to the life.
<div id="hello_piechart">
</div>
<script type="text/javascript">
google.load("visualization", "1", {packages:["corechart"]});
google.setOnLoadCallback(drawChart);
function drawChart() {
var data = google.visualization.arrayToDataTable([
['Task', 'Hours per Day'],
['Work', 11],
['Eat', 2],
['Commute', 2],
['Watch TV', 2],
['Sleep', 7]
]);
var options = {
title: 'Sample Pie Chart',
is3D: true,
};
var chart = new google.visualization.PieChart(document.getElementById('hello_piechart'));
chart.draw(data, options);
}
</script>
EOD;
} //function to render content of widget, I'm using a closure here
);
<br><br>We simply add one more div element with id hello_piechart and render chart into that element. Let's see what we got now:
Now that we know how to add our own widget block to the dashboard, and now that we know how to get Google Chart to render information, we can combine the two in order to show more information.
In next section, we will learn how to grab server metrics, and render content for each type of server metric that we've previously discussed.
Pulling Server Metrics
When pulling server metrics, we will use the command of Linux to get this information. In PHP, we can use backtick `` or shell_exec to invoke a shell command, and retrieve the output.
We can parse the output to get server data. For example, to get disk usage status we can use command df -h. We know the format of output, so we can parse it to get what we want.
    $df = `df -h`;
    $df = explode("\n", $df);
    if (is_array($df) && count($df)>=2) {
      array_shift($df); //Get rid the first line
      $df = array_map(function ($line) {
        if (empty($line)) {
          return NULL;
        }
        $segment=preg_split('/\s+/', $line);

        return array(
          'filesystem' => $segment[0],
          'size' => $segment[1],
          'used' => $segment[2],
          'available' => $segment[3],
          'use_percent' => $segment[4],
        );
      }, $df);
      var_dump($df);
    }
Cleaning Up with AWK
To help cleanup the output right from the shell command, we can combine with awk. That link looks scary with lots of information but we will just being using a very small amount of it in this tutorial. Explaing awk is out of scope of this tutorial.[command_we_run] | awk ' { print $1, $3, ...}'. ☁ Server Dashboard [master] ls -lh
total 32
-rw-r--r-- 1 kureikain staff 2.6K Apr 11 00:46 Server Dashboard.php
drwxr-xr-x 3 kureikain staff 102B Mar 29 01:27 bin
-rw-r--r-- 1 kureikain staff 98B Apr 5 18:53 loader.js
-rw-r--r-- 1 kureikain staff 321B Mar 29 01:27 phpunit.xml
drwxr-xr-x 4 kureikain staff 136B Mar 29 01:27 tests
drwxr-xr-x 12 kureikain staff 408B Apr 13 17:37 widget
-rw-r--r-- 1 kureikain staff 1.1K Apr 6 01:04 widget.php
☁ Server Dashboard [master] ls -lh | awk ' {print $3, $4, $5, $9} '
kureikain staff 2.6K Server
kureikain staff 102B bin
kureikain staff 98B loader.js
kureikain staff 321B phpunit.xml
kureikain staff 136B tests
kureikain staff 408B widget
kureikain staff 1.1K widget.php<br><br>As you can see the each line of ls -la contains nine fields:drwxr-xr-x 4 kureikain staff 136B Mar 29 01:27 testsSeparating by spaces, these 9 fields are:
- drwxr-xr-x
- 4
- kureikain
- staff
- 136B
- Mar
- 29
- 01:27
- tests
awk ' {print $3, $4, $5, $9} ' and I'll see:kureikain staff 136B tests<br>
Therefore, utilizing awk we can clean up the output a little bit more before feeding into our PHP processing function.
Cleaning Up with GREP
Some commands output extra data that we don't need; therefore, it requires a little bit of extra effort with PHP to clean it up.
For example:
[vagrant@vagrant-centos64 ~]$ free -m
             total       used       free     shared    buffers     cached
Mem:           589        537         51          0          8        271
-/+ buffers/cache:        258        330
Swap:          255          0        255
free -m shows us the RAM usage with memory and swap file; however it includes two other lines with total/used/free and -/+ buffers/cache that we may not need. -E switch. That switch allows use to use regular express for searching. Because we want to find the line with words Mem and Swap, let combine with grep -E "Mem|Swap". [vagrant@vagrant-centos64 ~]$ free -m | grep -E "Mem|Swap" Mem: 589 536 52 0 8 271 Swap: 255 0 255So it's much cleaner. Combine both of
grep and awk we can clean up data and get only what we need.[vagrant@vagrant-centos64 ~]$ free -m | grep -E "Mem|Swap" | awk '{print $1, $2, $3, $4}'
Mem: 589 537 52
Swap: 255 0 255
Linux Commands to Get Server Information
We've gotta learn some commands to pull server metrics, so let's open our server shell, and try to type below command to have a quick taste.
Check Network Traffic
$netstat -in

Kernel Interface table
Iface       MTU Met    RX-OK RX-ERR RX-DRP RX-OVR    TX-OK TX-ERR TX-DRP TX-OVR Flg
eth0       1500   0 5538339494      0      0      0 6216082004      0      0      0 BMRU
eth0:1     1500   0      - no statistics available -                            BMRU
eth1       1500   0 96707328840      0      0      0 102776317608      0      0      0 BMRU
eth2       1500   0       33      0      0      0        7      0      0      0 BMRU
lo        16436   0 29461422      0      0      0 29461422      0      0      0 LRU
Check Disk Usage
df -h
Filesystem            Size  Used Avail Use% Mounted on
/dev/sda7             2.0G  660M  1.3G  35% /
/dev/sda8             1.0T  632G  340G  66% /home
/dev/sda6             2.0G   68M  1.9G   4% /tmp
/dev/sda5              20G  1.5G   18G   8% /var
/dev/sda2              20G  2.1G   17G  12% /usr
/dev/sda1             194M   25M  160M  14% /boot
/dev/hdb1             459G  277G  159G  64% /backup
tmpfs                  16G     0   16G   0% /dev/shm
Check RAM Usage
free -m
             total       used       free     shared    buffers     cached
Mem:         32189      32129         59          0        419       9052
-/+ buffers/cache:      22656       9532
Swap:        32767          4      3276
We will use more command later, but above ones give you some fundamental command to see what we can get from server right on the command line.Building the Widget
We will refactor our original class in previous section a little bit. Note that, unless clearly stating otherwise, we'll be creating all files and folders within our plugin directory.
First, we won't want to manually include files. We will write an auto class loader for that purpose. When a missing class is initialized, we will check the class name and try to include the source file that hold class definition.
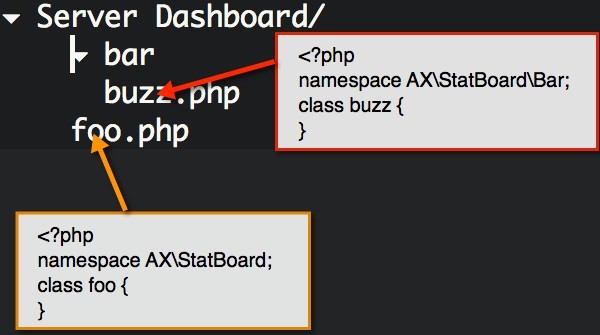
We will use namespaces as the path and class name as the file name. For example, a class foo in namespace AX\StatBoard should be in the root of plugin folder. A class buzz in namespace AX\StatBoard\Bar should be in Bar\buzz.php
With that in mind, let's go ahead and start crafting our auto loader method:
<?php
namespace AX\StatBoard;

class Dashboard {
  //..
  public function load_class($classname)
  {
    if (FALSE === $pos = strpos($classname, 'AX\StatBoard')) {
      return false;
    }
    $classname = substr($classname, $pos+1 + strlen('AX\StatBoard'));
    $filepath = $this->_plugin_dir . strtolower(str_replace('\\', '/', $classname) . '.php');
    if (!file_exists($filepath)) {
      return false;
    }
    include $filepath;
  } <br><br>  /**<br>   * Setup variable and intialize widget provider<br>   */<br>  function __construct() {<br>    $this->_plugin_dir =  plugin_dir_path( __FILE__ ) ;<br>    spl_autoload_register(array($this, 'load_class'));<br>  }<br><br>
  //..
}
So, what happens here? Our plugin use namespace AX\StatBoard. So we make sure the requested class under this namespace should be handle by our plugin, otherwise our auto loader isn't capable to load them. We then strip the AX\StatBoard in class name and replace it with the path of plugin folder. The backslash \ in namespace is replaced with / path separator, and append php extension. That mean that the namespace will be used as the path to folder contains class file, and the class name is the file name. Including only occurs if the file exists. Now, we got the auto loader, we still need to let PHP know that we got an auto loader and we want to use it. PHP includes spl_autoload_register for this purpose. We put it in our class constructor.Secondly, let's design our widgets class. We have multiple types of server metric to display. It's better to display each of metric in a separate widget block so those widgets can be sorted or arrange, or customized to hide or show. Putting all information into the same widget will put the cost of control showing/hiding each of metric to our plugin.
wp_add_dashboard_widget, we have to give it the title and content. Corresponding to each widget, we will have a class to render title and content for it. We call these class are widget Provider. All widget provider must define get_title() and get_content() to render content.Provider interface, and have our widget provider class implement this interface. We also need to create one more method call get_metric() to pull server data. Create file
widget/provider.php with this content:<?php
namespace AX\StatBoard\Widget;
interface Provider {
function get_title();
function get_content();
function get_metric();
}
This is an interface. We required that every widget provider has to implement this interface, and therefore we ensure tat widget provider class always has these three methods.We will create one more class
Widget to manage these providers. We create provider classes, then hand them out to Widget class, and view Widget class as a single point for us to ask for a provider when we need. We can simply put everything into our main plugin file, and just create class instance with new operator when we need but it's hard to maintain later. Widget classCompose a file
widget.php in root directory of plugin folder.<br><?php<br>namespace AX\StatBoard;<br>use AX\StatBoard\Widget\Provider;<br><br>class Widget {<br> const WIDGET_SLUG_PREFIX = 'AX';<br><br> protected $_providers = array();<br> protected static $_instance;<br><br> static function instance() {<br> return self::$_instance = self::$_instance ?: new self();<br> }<br><br> function __construct() {<br> }<br><br> /**<br> * Add a widget provider<br> * @param string widget name<br> * @param provider object to handle widget content rendering<br> */ <br> public function add_provider($name, Provider $handler) {<br> $this->_providers[$name] = $handler;<br> return $this;<br> }<br><br> /**<br> * Get all provider or a particular provider<br> */<br> public function get_provider($name=NULL) {<br> if (!$name) {<br> return $this->_providers;<br> }<br> return $this->_providers[$name];<br> }<br><br> /**<br> * Register a widget to render it.<br> */<br> public function register($name) {<br> $slugid = self::WIDGET_SLUG_PREFIX . $name;<br> $widget_provider = $this->get_provider($name);<br> if (empty($widget_provider)) {<br> return false;<br> }<br><br> wp_add_dashboard_widget(<br> $slugid,<br> $widget_provider->get_title(),<br> array($widget_provider, 'get_content'));<br> return true;<br> }<br>}<br><br>Again, we're using the Singleton Pattern for our Widget class. A quick summary of our method here.- The
add_providermethod will add a widget provider object to the widget provider list. We also use type hinting to make sure that object pass to add_provider has to be a Provider by implementing ourProviderinterface.
- The
get_providermethod can return a list of all provider, or a particular provider. - The
registermethod will actually register our provider object with WordPress to render a dashboard widget withwp_add_dashboard_widget. The ID of widget is generated based on the prefix, a pre defined constant, and the class name of widget. The title will and content will be pull viaget_titleand get_contentof provider. We made sure they implement our Provider interface. With this register method, we abstract the implementation of adding the widget to dashboard. All we need to do now is to callregisterwith the name of provider which we add before withadd_provider. With this in mind, when WordPress API changes, we don't need to go to every place ofwp_add_dashboard_widget, we just update in one place.
Coming back our original main plugin file
serverdashboard.php, we will initialize all providers and add them to provider list of Widget object. <?php
/**
* Setup variable and intialize widget provider
*/
function __construct() {
$this->_plugin_dir = plugin_dir_path( __FILE__ ) ;
spl_autoload_register(array($this, 'load_class'));
$this->_dashboard_widget = array(
'server',
'cpu_load',
'ram',
'disk',
'diskio',
'software',
'ethernet',
'internetspeed',
'networkio',
'process',
);
foreach ($this->_dashboard_widget as $item) {
if (!file_exists($this->_plugin_dir . '/widget/' . $item . '.php')) {
continue;
}
$classname = 'AX\\StatBoard\\Widget\\' . ucwords($item);
Widget::instance()->add_provider($item, new $classname());
}
}<br><br>We will put all widget provider classes under namespace AX\StatBoard\Widget and therefore they will sit inside folder widget. We support nine kinds of metric and we name the class corresponding to the array _dashboard_widgets above. Widget class. Here is what we will get later with this structure:
wp_dashboard_setup, and inside it we call the function wp_add_dashboard_widget to add new widget to dashboard. Next, we have our register method for this purpose. We will loop over all added providers, and register them. Update the content of add_dashboard_widgets of serverdashboard.php become: <br> /**
* Register dashboard widget proider to show up on dashboard
*/
function add_dashboard_widgets() {
$widget = Widget::instance();
foreach ($widget->get_provider() as $name=>$provider) {
$widget->register($name);
}
}<br><br>
Next, we will hook into admin_footer to output inline JavaScript at bottom of admin page for initializing Google Chart class package. Our
run() method is also updated for new hook. /**
* Start to setup hook
*/
public function run() {
add_action( 'wp_dashboard_setup', array( $this, 'add_dashboard_widgets' ) );
add_action( 'admin_enqueue_scripts', array($this, 'add_asset'));
add_action( 'admin_footer', array($this, 'footer'));
}
/**
* Inline JavaScript for chart
*/
function footer() {
echo '
<script>google.load("visualization", "1", {packages:["corechart"]})</script>
';
}
At this moment, we completed the basic, and the main plugin file should look like this.
<?php
/*
Plugin Name: Server Dashboard
Version: 0.1-alpha
Description: Server Status Dashboard
Author: Vinh
Author URI: http://axcoto.com
Plugin URI: http://axcoto.com
Text Domain: Server Dashboard
Domain Path: /languages
 */
namespace AX\StatBoard;

use AX\StatBoard\Widget;

class Dashboard {
  protected static $_instance=NULL;
  protected $_dashboard_widget = array();
  protected $_plugin_dir=NULL;

  /**
   * Auto load class under namespace of this plugin
   */
  public function load_class($classname)
  {
    if (FALSE === $pos = strpos($classname, 'AX\StatBoard')) {
      return false;
    }
    $classname = substr($classname, $pos+1 + strlen('AX\StatBoard'));
    $filepath = $this->_plugin_dir . strtolower(str_replace('\\', '/', $classname) . '.php');
    if (!file_exists($filepath)) {
      return false;
    }
    include $filepath;
  }

  /**
   * Setup variable and intialize widget provider
   */
  function __construct() {
    $this->_plugin_dir =  plugin_dir_path( __FILE__ ) ;
    spl_autoload_register(array($this, 'load_class'));

    $this->_dashboard_widget = array(
      'server',
      'cpuload',
      'ram',
      'disk',
      'software',
      'process',
      'ethernet',
      'networkio',

      'iostat',
    );

    foreach ($this->_dashboard_widget as $item) {
      if (!file_exists($this->_plugin_dir . '/widget/' . $item . '.php')) {
        continue;
      }
      $classname = 'AX\\StatBoard\\Widget\\' . ucwords($item);
      Widget::instance()->add_provider($item, new $classname());
    }
  }

  /**
   * Create an unique instance throught the app
   */
  public static function instance() {
    return self::$_instance = self::$_instance ?: new self();
  }

  /**
   * Start to setup hook
   */
  public function run() {
    add_action( 'wp_dashboard_setup', array( $this, 'add_dashboard_widgets' ) );
    add_action( 'admin_enqueue_scripts', array($this, 'add_asset'));
    add_action( 'admin_footer', array($this, 'footer'));
  }

  /**
   * Register dashboard widget proider to show up on dashboard
   */
  function add_dashboard_widgets() {
    $widget = Widget::instance();
    foreach ($widget->get_provider() as $name=>$provider) {
      $widget->register($name);
    }
  }

  /**
   * Assets load: stylesheet, JS.
   */
  function add_asset() {
    syslog(LOG_DEBUG, "Loaded");
    wp_enqueue_script( 'google-chart', 'https://www.google.com/jsapi' );
    //wp_enqueue_script( 'plugin_dir_url', plugin_dir_url(__FILE__) . '/loader.js');
  }

  /**
   * Inline JavaScript for chart
   */
  function footer() {
    echo '
      <script>google.load("visualization", "1", {packages:["corechart"]})</script>
';
  }
}

Dashboard::instance()->run();
We basically create an instance of main plugin class and call the run method. Which in turn just set up a list of hook. Each hook is another method inside the class. We also create and register our provider object with Widget object. 
Comments