In this two part tutorial series, we'll take a look at writing & debugging JavaScript code using modern tooling such as the Chrome DevTools.
In part 1, you'll get a introductory look at the various panels in the DevTools and what workflows they're suitable for. There'll also be a focus on writing and executing JavaScript code through the browser rather than a code editor.
1. What Are Browser DevTools?
Developer Tools are features provided by browsers containing a set of utilities to inspect, interact with and debug web pages. Browser DevTools are typically bundled with all modern browsers including Chrome, Firefox, Safari, Opera, and Internet Explorer. This tutorial will focus specifically on the DevTools part of Chrome Canary, but all features listed here are likely to be part of Chrome Stable soon.
What Can DevTools Offer to a JavaScript Developer?
The open web platform enables you to Right-Click > Inspect Element on any web page and discover the internals of it, but JavaScript has always been a bit more out of reach than CSS (Cascading Style Sheets). While DevTools is packed with features related to the styling of the page, there is also a heap of lesser-known functionality which enables you to view, write and debug JavaScript in a variety of ways, whether it’s on your own page or on a third-party site.
Why Use DevTools for Your JavaScript Workflow?
If you are a front-end web developer, it’s recommended you at least be aware of the JavaScript utilities DevTools has to offer. High-level features include:
- at least two dedicated panels whose use cases cater almost entirely for JavaScript
- a development environment that's quick to set up, with a fast feedback loop
- advance debugging capabilities with breakpoints
2. DevTools Overview
This section will cover the UI elements of the DevTools, specifically the Sources Panel and the Console Panel, since these are the two panels which will be used for the rest of this tutorial.
Sources Panel Interface
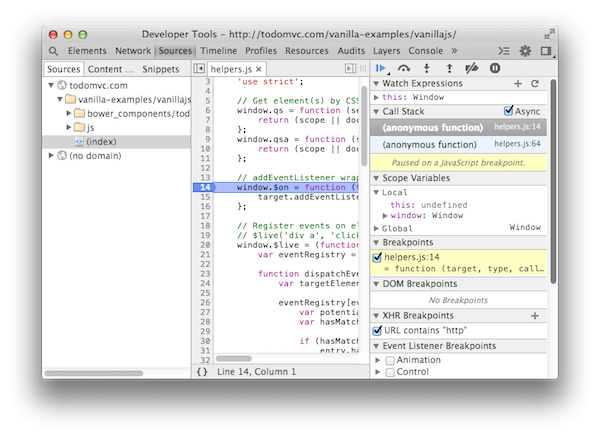
Take note of a few layout characteristics:
- DevTools is in an undocked state. You may prefer to dock to the left, bottom or right of the main window.
- The Sources Pane in the Sources Panel is selected in the left sidebar.
- The panes in the right sidebar are in an expanded state.
The Sources Panel provides you with a code editor, and it supports syntax highlighting for many common file formats such as HTML, CSS, JavaScript, CoffeeScript, LESS, and Sass. The code editor is present within the main pane. Directly above the main pane you can see tabs corresponding to your open files.
In the Sources Pane within the left sidebar there is a file tree typically showing the assets the currently inspected page has loaded. Assets are grouped by domain, and folders can be in an expanded or collapsed state. If you single-click an asset, it will open up in the code editor.
The right sidebar contains controls for JavaScript debugging, and each pane can be in an expanded or collapsed state. Various levels of output are displayed here when JavaScript is paused at a breakpoint.
Console Panel
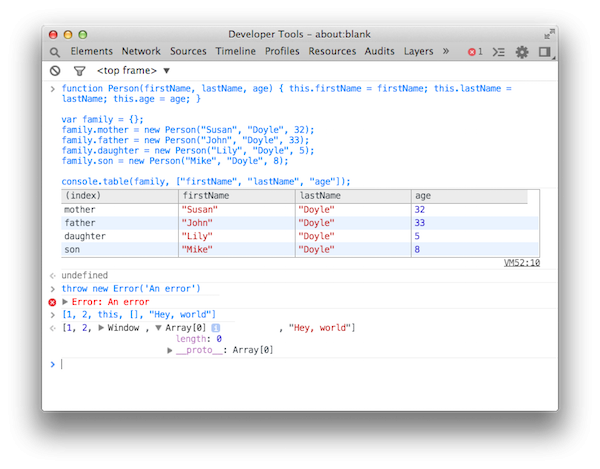
The Console Panel enables you to view the output produced by diagnostic logging (such as console.log statements) but also to write and evaluate JavaScript within the context of the currently inspected page. The Console Panel supports both the Console API and the Command Line API. Here are some functions exposed by each API, along with a description of their output.
Console API
//A simple log statement, logging a string, array and an object
console.log('Hi', [1,2,3], this);

//Same as console.log but formatted in red to signify an error
console.error('An error occurred');

Command Line API
keys(window); //Get the properties of an object

$0; //Retrieve the currently selected element in the Elements Panel

The top of the Console Panel contains a few controls as shown below.

-
No symbol (circle with a backslash) clears the console. This is useful for when more messages than desired are in view and you wish to remove them. You can also use the shortcut Command-K to remove them, or execute the function
clear(), which is part of the Command Line API. - Filter opens a bar with filtering controls including an input box. If you are only interested in finding error messages, select the Errors filter option. Alternatively enter a regular expression to use as a filter.
- The Select menu (<top frame>) provides options for available JavaScript execution contexts to switch to. Use this when you want your JavaScript to be evaluated in the context of an IFrame or Chrome Extension for example.
The Console Panel is one of the few panels which you can overlay over other panels in the DevTools (Elements, Network, Sources) to provide an improved workflow. If you find yourself regularly returning to the Console Panel, bring up the Console Drawer by pressing the Escape key.
3. Viewing JavaScript Using the DevTools
This section will focus on using the DevTools to see JavaScript resources a site is using. Before continuing, it is recommended you disable the browser cache via DevTools. To do this, navigate to Settings > General and enable the checkbox titled Disable cache (while DevTools is open). This ensures you are always getting a fresh version of an asset.
Workflow on Third-Party Sites
Navigate to HTML5Please.com, a site explaining the readiness of Web Platform features. Open up the DevTools using Command-Shift-I or by selecting Inspect Element from the page context menu. Head on over to the Sources Panel and take note of the file tree structure shown in the left sidebar. It's not unheard of for websites to store their JavaScript in folders such as "js" or "scripts", so you already know where to look. Open up the script.js file in the js folder. Notice a few features of the code editor which can prove useful when you view or edit JavaScript code:
- full syntax highlighting
- line and column number of the cursor
- new tab corresponding to the open file
- word occurrences mapped to the current selection
- brace matching
- go-to definition
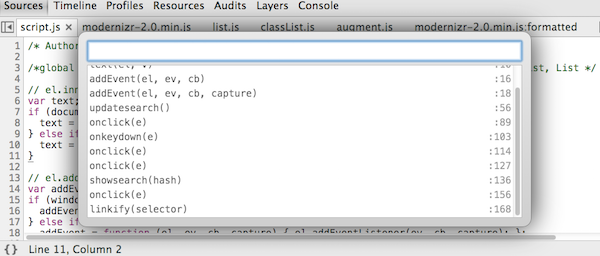
Use the go-to definition feature to quickly find or discover JavaScript methods or functions. You can open the go-to definition modal window via the shortcut Command-Shift-P. If you know the name of the method or function you are looking for, type it in the go-to definition search box; as you type, results will update in real time. Each result contains the matching method name (if there is one) and the line number where it is defined. Use Enter to select a search result, and you then land on the line of code where the function is defined.
Now open modernizr-2.0.min.js in the js/libs folder. The fact that this file is minified makes it harder to view. Select Pretty Print to have DevTools apply a more intuitive formatting to the file, using line breaks and indentation. The Pretty Print feature works for both CSS and JavaScript.
Save External JavaScript to the File System
Each JavaScript file in the file tree has a context menu, so open it up using right-click. Notice a few options useful for taking the file offline for later use.
- Open link in new tab: use this if you wish to inspect the network information further in a dedicated tab (via Network Panel).
- Save As: use this if you want to make an offline copy of the file in your file system.
- Copy Link Address: use this if you want to share the URL elsewhere.
Find JavaScript in the Network Panel
The Network Panel, in addition to simply showing you what resources a page has loaded, will also display other information and data.
- Initiator: what caused a script to download
- DOMContentLoaded (blue) and Load events (red): a timeline-based, visual representation of when these events fire
- Size: the size of the asset, including the Gzip size
Using HTML5Please.com as an example website, follow along with the steps below:
- Navigate to the Network Panel and clear the logs.
- Refresh the page.
- Filter for JavaScript logs by selecting the Scripts filter.
The first script, modernizr-2.0.min.js, has the value of html5please.com/:17 for the initiator. This suggests it was an HTML resource which initiated the download of the script (rather than a script loader, for example). Click on the initiator, and you are taken to the line of code in the Sources Panel which references the file:
<script src="js/libs/modernizr-2.0.min.js"></script>
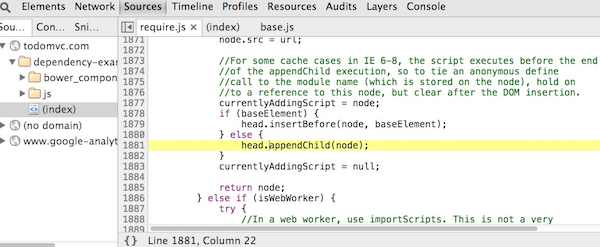
In the event that a script is dynamically inserted (with a script loader for example), the initiator column in the Network Panel can provide a JavaScript call stack relating to the calls which occurred all the way up to the point where the script was dynamically inserted into the DOM.
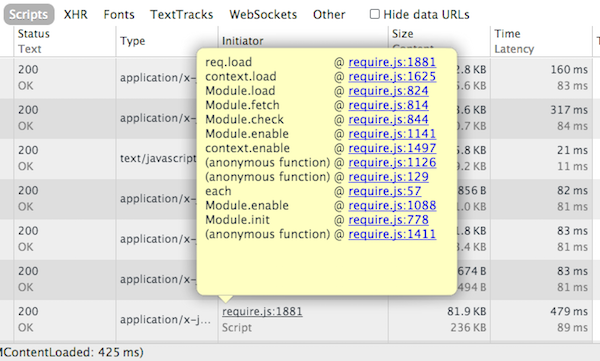
You can click on each call within a call stack to navigate to the relevant portion of code in the Sources Panel.
4. Writing JavaScript using the DevTools
In the section "Viewing JavaScript using the DevTools", I explained how to view information, metadata, and source code on JavaScript assets. This section will examine the ways you can write JavaScript using the DevTools.
Console Panel
Use the Console Panel for writing quick JavaScript one-liners with immediate results. JavaScript is executed with the context of the currently inspected page. Execute some JavaScript in the Console Panel by pressing Enter after entering some code.
Refer to the Console API and Command Line API for a list of available methods and functions.
Tips
While the Console Panel is relatively simple, there are a few small tips to improve your workflow:
- Use Shift-Enter for a new line—this enables you to write multi-line code.
- Execute
keys(window)to detect global variables on the current page. - Use the
$_helper to retrieve the last result of a previous command.
You may find the Console Panel to be a good candidate for quickly experimenting with JavaScript to discover what the output of certain expressions are. However, when you start writing more complex JavaScript, you can easily encounter limitations:
- Lack of syntax highlighting can decrease readability.
- Indentation must be done manually with space characters.
- Missing features are typically present in code editors.
The Console Panel does not intend to be a code editor replacement or even alternative. Here is a list of some cases where the Console Panel can be useful:
- using the autocomplete feature for the sake of property discovery
- finding out the difference between JavaScript's
call()andapply()methods by executing them inline and observing the results
Sources Panel
The main pane of the Sources Panel contains a code editor with basic editing capabilities.
CodeMirror
The editor itself is powered by CodeMirror, a powerful text editor implemented using JavaScript. DevTools imports the CodeMirror editor into its own codebase and selectively enables various features which are in turn made available to any Chrome user.
When editing JavaScript (amongst other supported languages), the Sources Panel editor contains a number of utilities such as:
-
Autocomplete suggestions: Receive suggestions as to the word you may be trying to type. These are based on existing written properties within the same file. For example,
documentis not suggested after typing indocuunless there is already at least one occurrence of the worddocumentin the same file. - Search and replace: To open the search box, click Command-F. Matching results are outlined in the code in real time. Checking the Replace checkbox provides search and replace abilities.
- Keyboard Shortcuts: Various shortcuts exist, similar to those found in code editors such as Sublime Text. For example, use Command-/ to toggle a comment, Command-D to select the next word occurrence of the currently selected word, and many more as documented on the official Chrome Developer Tools shortcuts page.
Live Editing JavaScript
The feature, better known as Live Edit, gives you the ability to edit a page's JavaScript code via DevTools and have the changes apply to the page immediately without a page refresh. There is no particular UI to use this; you simply rewrite a part of JavaScript code and press Command-S to save it.
How this works behind the scenes is explained below, but first, consider the following prerequisites (these are independant of Live Edit):
- A page which uses
script.jsloads into Chrome via a web page. -
script.jsis parsed, evaluated, and compiled into machine code through the V8 JavaScript Engine.
Here's what happens behind the scenes of the Live Edit feature, considering the previous points:
- You open
script.jsin the DevTools code editor. Assume there is a button on current web page. On button click, a click event listener executes an anonymous function. - You modify the anonymous function to add a
console.logstatement and save the file. - The raw text contents of
script.jsare injected back into the V8 engine for processing. - Comparisons are made between the new
script.jsand the old one. Deletions, additions and modifications are stored. - V8 compiles the modified JavaScript and patches
script.jswith the compiled changes.
Live Edit works best with minor modifications rather than authoring entire JavaScript files for your app. Debug scenarios work well with Live Edit.
Workspaces
Workspaces is not a critical component of JavaScript debugging via the DevTools. However, depending on your requirements, it can speed up your debugging workflow. Workspaces is a feature of the DevTools which enables you to modify the contents of a folder on the file system by making code changes in the DevTools.
If you are browsing a project which is served locally though a web server, such as at http://localhost:3000/ and the project exists on your file system at ~/development/project, for example, you can teach DevTools about the mapping between the two and use the Live Edit capabilities with save-to-disk abilities. Workspaces enables the following workflow:
- After you instruct your DevTools about the mapping between the page you are viewing and its source on your file system, you can view the source code in the Sources Panel.
- You encounter a JavaScript error so while debugging, you make a change in the Sources Panel.
- You save your change using Command-S.
In step 3, the save overwrites the original source file.
Source Maps
Source Maps solve a common problem when dealing with source code that is processed or compiled into something else. Examples include:
- JavaScript code which is minified and concatenated as part of a build system
- Ecmascript 6 code which is transpiled into ES5 code so that it is compatible with all modern browsers
- CoffeeScript code which gets compiled into JavaScript
The problem is as follows: when debugging a processed version of the code, it can be hard to understand how your original source code maps onto what you are viewing during debugging. If you are getting an error in the DevTools console for a production website, you will typically end up having to debug a minified and concatenated version of JavaScript code, which bears little resemblance to the source files which you author.
A Source Map is a generated file produced as part of a compilation process which is available for the use cases listed earlier. DevTools can read a Source Map file to understand how a compiled file maps onto the original file.
The two code snippets (Source File—app.js and Transpiled file—compiled.js) demonstrate Source Map debugger-friendly code.
Example 1. Source File—app.js
for (var element of [1, 2, 3]) {
  console.log(element);
}
Note that the app.js source file uses an Ecmascript 6 compatible feature known as the Array iterator.
Example 2. Transpiled File—compiled.js
"use strict";
for (var $__0 = [1, 2, 3][Symbol.iterator](),
    $__1; !($__1 = $__0.next()).done; ) {
  var element = $__1.value;
  {
    console.log(element);
  }
}

//# sourceMappingURL=app.js.map
Note that compiled.js is referenced by a script tag on an HTML page, along with the Traceur runtime, and finally is opened in a browser.
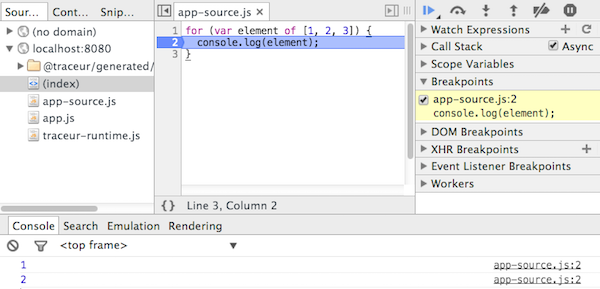
Even the compiled JavaScript has the console.log statement on line 6. DevTools is able to show exactly where theconsole.log statement exists within the original source file (Source Map debugging), which is on line 2. Breakpoints work as expected. Behind the scenes, the compiled JavaScript is evaluated and executed, but DevTools is presenting a different asset in lieu of the browser evaluated version.
Snippets
The Snippets feature of the DevTools provides a quick way to write miscellaneous JavaScript code and execute it. All JavaScript executed via Snippets is run within the context of the current page. Executing a DevTools Snippet is similar to running a Bookmarklet on a page. You may find it preferable to write certain JavaScript within Snippets as opposed to the Console Panel for reasons related to a better code editing environment. Your snippets are saved within the Local Storage of the DevTools.
To use Snippets:
- Ensure the left sidebar is visible within the Sources Panel and select the Snippets tab in the sidebar (alongside the "Sources" and "Content Scripts" tabs).
- Right-click in the left sidebar and select New to create a new Snippet.
- Name your new Snippet.
- Write
console.log('Hello');in the code editor. - Press Command-Enter and notice the resulting output in the Console Panel.
You can find a number of already-written snippets in this DevTools Snippets repository.
That's it for Part 1 of a Modern Debugging Experience. In Part 2, we'll take a look at some debugging features and also a few extensions which can help with this.


Comments