No one likes to wait, and according to research—unfortunately for web developers—we're only getting more impatient.
Numbers shared in content delivery network company Akamai's latest consumer report are convincing: 49% of e-commerce customers expect a page to load in two seconds or less, with a significant number demanding instant page load (one second or less). And the report says that consumers' patience for slow web sites is still on the decline: "Currently, only 51% of consumers 'wait patiently' for a website to load, compared to 63% who would 'wait patiently' five years ago."
Also, to complicate things further, on many of today's web sites and applications, what used to be just one page load at the beginning of the visit has grown into several interactions that take place between the user, the web browser, and the application.
In a world full of options, a frustrated visitor won't stay for long, be it because of a slow initial loading time or an AJAX loading image that never stops spinning.
So, what can we do to keep our visitors from getting frustrated?
In This Tutorial
If you are a web developer or run a web-based service that gathers any number of visitors but aren't quite sure if there is something about your product that is frustrating them, this tutorial is for you.
In the tutorial, we'll use New Relic Browser to find the points of frustration your visitors face when using your web site or application. This includes optimizing the page load and its different parts as well as finding and fixing JavaScript errors as soon as they pop up on your users' web browsers.
If you're not yet a New Relic user, you can gain some insight into optimizing your web application simply by reading the tutorial and applying the suggested fixes. However, to get the most out of what follows, I suggest giving Browser a try and signing up for the 14-day free trial. I bet you'll find many chances for getting rid of points of frustration already during that period...
Getting Started With New Relic Browser
New Relic Browser is a new kind of monitoring tool: instead of monitoring loading times and events taking place on your server, it moves the focus to the end user experience. This gives developers a detailed view to how real users are loading the pages and interacting with them, from the moment they type in the URL or click a link all the way to when they leave the page.
Jeff Reifman has written about New Relic Browser in general in an earlier tutorial, Front-End Monitoring with New Relic Browser, so I won't go into detail about installing the product this time. Instead, if you are new to Browser, I suggest you take a look at Jeff's tutorial first and then return to this tutorial for tips and ideas on how to use the tool for your real-world optimizations.
Installing New Relic Browser Without the Full New Relic Stack
One exception, though: Since Jeff's tutorial was publisher in October 2014, New Relic has added an option for using Browser on a web site without installing the full application monitoring stack on the server.
For most users, the default method of installing Browser as a part of the full APM package, described in Jeff's tutorial, is the recommended way to go, as it will give you the most accurate information about the time spent on the server. However, if you are not able to install the software on your server (this could be the case, for example, on a shared web host), the alternative method will be useful for you.
Here's how you can install Browser without installing the rest of the New Relic server monitoring tools.
First, once you have signed up, click on Add More on the top right corner of the page to add your application.
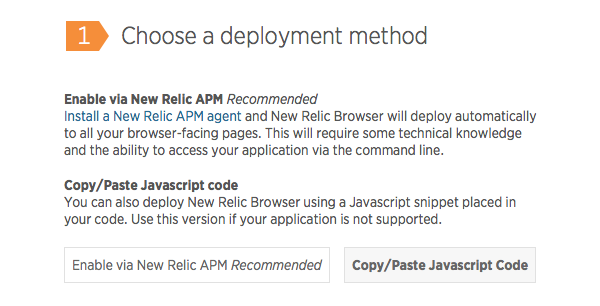
On the next screen, select Copy/Paste JavaScript Code as the deployment method.
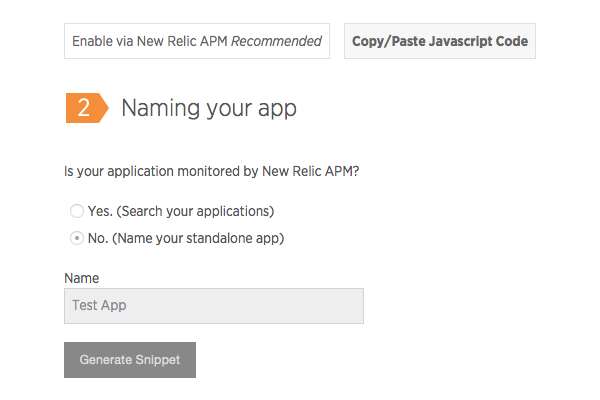
Then, give your application a name and click on Generate Snippet.
The code is appended on the page, right below the button:
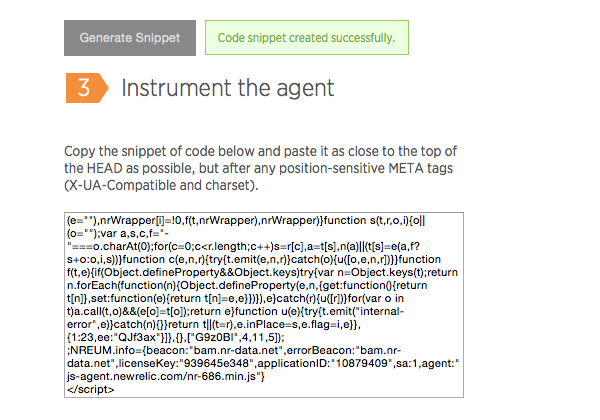
Copy the generated code and place it in your web page's head section, as close to the top as possible, but after any meta tags. And that's it.
Give New Relic some time to collect data about your visitors and then come back to the Browser dashboard to see what's going on. At first things will look a bit empty, but no worries: as people visit your site, you'll soon have plenty of data to analyze!
Now, I know you're itching to fix real issues and improve your users' lives, so let's get straight to work!
The Core Feature: Session Traces
There is always more than one way to use a tool, and we all have our own preferences.
That said, when just getting started, it's good to have some tested ideas to base your experiments on. That's why, researching for this tutorial, I spent some time watching as an experienced New Relic engineer showed me how he uses Browser to find issues and points of optimization in New Relic's codebase.
My biggest takeaway from that demo was that the real killer feature at the core of New Relic Browser is Session Traces. While Browser also has other useful features, they are best understood as instruments designed to help you get the most out of your session traces.
What Is a Session Trace?
A session trace looks a lot like the timeline you'll find in your favorite web browser's developer tools, except in this case the trace isn't showing your experience—it's showing what happened on the computer of one of your visitors. So, it's not a summary or an average over a number of visitors but a single, captured session showing you a page load's full life cycle in as much detail as possible without sacrificing the visitor's privacy.
Here's an example showing the beginning of a session trace showing an Android Chrome user visiting the magazine archive on my magazine web site:
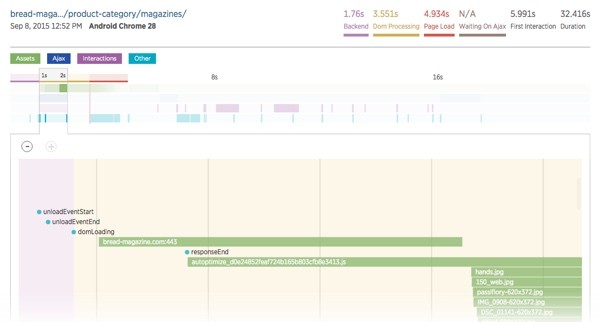
To go through the session trace from beginning to end, place your pointer on top of the trace element and scroll down using your mouse or your touch pad. The trace follows the events and resources loaded, showing them to you one by one. You can also use the + and - buttons on the top left corner to zoom in and out on the trace, or click anywhere on the birds-eye view at the top to jump to a point further in the trace.
By placing your pointer on top of a resource or an event, you'll see more information about that element. For example, the light green bar in the screen shot below shows the loading of an image that is either quite big or just slow for some other reason...
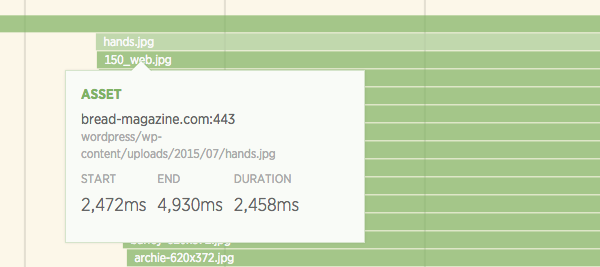
To see the entire resource on the time line, click on it. This will zoom the view far enough so that the bar fits on the screen and you can see how it compares to the rest of the trace at one glance.
How to Pick an Interesting Session Trace to Analyze
As I mentioned above, a session trace is a record of one user interacting with one of your application's pages. As such, while many of the session traces are probably good representations of your visitors, there are always outliers: a slow trace can be slow simply because the visitor is using an old computer or has a bad internet connection.
This means that you'll have to use your judgement to decide if a specific trace makes sense to focus on. We'll look into selecting a good trace in more detail as we start optimizing the page loading, but in general—be it for optimizing your page load or fixing JavaScript errors—it's a good idea to try to find a trace that represents a visitor close to your average user and affects a popular page.
This way, your fixes will have a big impact on the majority of your users.
Let's begin with speeding up your site's loading as experienced by the users.
Using New Relic Browser to Optimize Your Site
Optimizing your site is one of the most important actions you can take to make sure your visitors won't get frustrated and leave to your competitors or to a daily distraction. But with so many different optimizations you could try, it's often hard to decide where to begin: if you just start implementing fixes one by one, you might end up optimizing your site while leaving the one big issue untouched.
This is where Browser comes to our rescue.
Instead of spending your time making random fixes by hunch, you'll pick a few good, representative session traces and use them to find bottlenecks that really are slowing down the load times experienced by your users and focus on fixing them.
Step 1: Use Page Views to Get an Overall Picture
Before diving into session traces, it helps to have a good overall picture of where the biggest needs for optimization are in your application or on your web site.
So, let's start with the Page Views page.
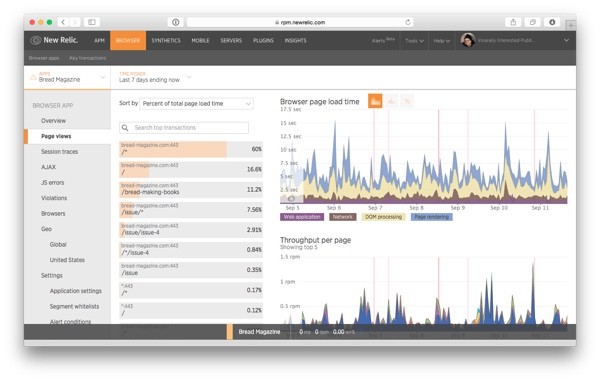
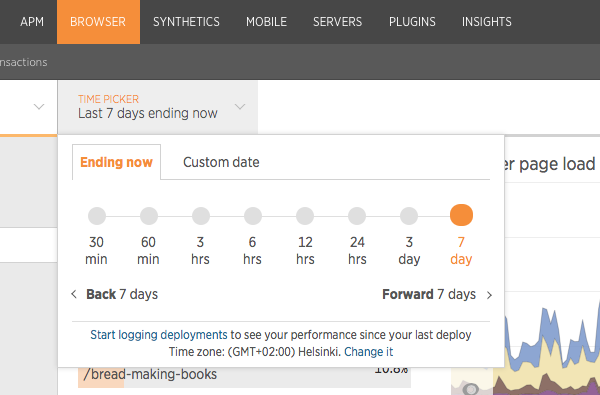
First, depending on how much traffic your site is receiving, use the Time Picker option at the top of the page to choose a time frame that will give you enough data to base your decisions on:
- For a high-traffic web application, the default of 30 minutes will work well and give you the most up to date information. This is also useful when you are checking if an earlier fix has had the desired impact on your loading times.
- For a smaller site with fewer visitors, you may need a longer time frame to collect a big enough sample size to make assumptions about your visitors. In the screen shots below, for example, I went with a 7-day time frame.
In addition to looking at the recent data "Ending now", you can use the Custom date tab to browse historical data and see how your application behaved at any given time monitored using Browser.
After picking a time frame, take a look at the first graph on the right, Browser page load time.
This graph shows a breakdown of your site's loading times, highlighting each phase in the page load in a different color. In a way, this is like an aggregated version of the Session Traces—just without all the detail.
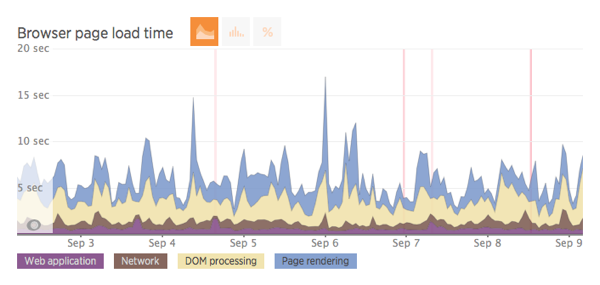
Let's take a look at the different phases and what happens during them. Notice that you can click on the labels below the graph to show or hide a layer and take a closer look at the remaining ones.
- Web application: Starting at the bottom, the purple section shows the time spent executing the request on your application server. Our goal in optimizing the site is to be able to show something to the user as soon as possible, so this step is crucial. If the web application takes a big part of the request, jump over to the server side and fix the issues with the initial loading before continuing with client-side optimizations. In many cases, however, you'll find that this part is already quite quick compared to the other three, and so you'll often get a better return on investment starting with one of them.
-
Network: The second layer going from bottom up, in brown, shows the time spent on the initial server requests, including sending the request to the server and retrieving the response. It doesn't contain the network requests for loading static resources. During this phase, your site is still showing nothing but an empty page, so if the network time is slow, you should optimize the server, for example by cleaning up your HTML code or minifying it to make sure it loads as fast as possible.
- DOM processing and Page rendering: The two topmost phases, shown in light yellow and blue respectively, are the two for which we'll get the best visibility using Browser. This is great because they are also often the ones in biggest need of optimization, as you can see from the screen shot above. DOM processing shows the time it takes the visitors' browsers to parse your page's HTML, whereas Page rendering shows the time from when the browser has parsed the HTML to when the page has been completely loaded and is ready for the visitor to use.
Finally, in the screen shot above, you'll notice some vertical red lines. These are time blocks when the New Relic monitoring tools initiated alerts. In this example, taken from my (still not perfectly optimized) magazine site, alerts were generated once because of errors on the server and three times because of the server-side Apdex index going too low a couple of times during the week.
After analyzing the page load time chart, you'll have a better understanding of where the bulk of your users' time is spent, and you can dig deeper accordingly.
Step 2: Find a Good Page to Optimize
Now that we have an overall view of the page loads, we can go deeper into the data and move from looking at an aggregate graph to zooming in to one session at a time. But, as I mentioned earlier, not every trace will be a good representative of your visitors or provide a good return on the time invested in fixing its issues.
On the left side of the Page views screen, you'll find a list of requests made to your server, grouped by the URL called, that can be sorted by different criteria. This is a useful tool for choosing a page to focus your efforts on.
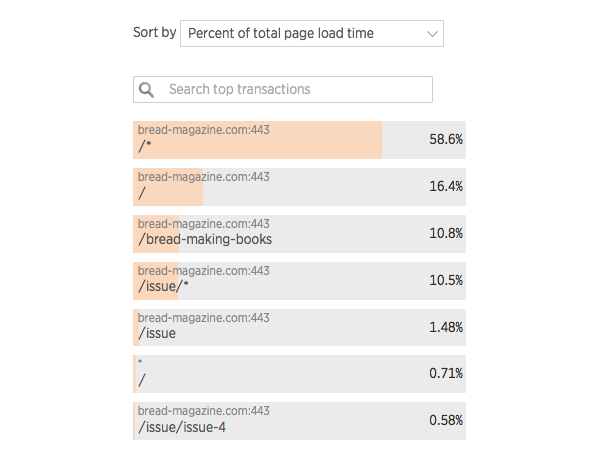
The different sorting options can be used to tease different insight out of the data:
- Percent of total load time: This is the default view, which shows where the total loading time on all of your site is spent. As a factor of the other two options, this view combines each page's popularity with its loading speed, giving you a good overall idea of where your fixes will have the greatest impact: a really slow page that rarely gets shown will be low on the list. A page high on the list can be there because of its popularity compared to the rest of your site or because it is very slow. If you are not sure which of the two is the case, you can use the other two views.
- Average page load time: This view sorts the pages by their loading times without taking popularity into account. So, if you are not sure why a page ranks high on the above list, take a look at this one: If a page appears high on both this list and the one above, it's likely to be a page that is both popular and in need of optimization—in other words, a great candidate for optimization.
- Throughput: This view sorts the pages by how often your visitors visit them. So, similar to the Average page load time, you can use this option to see why a page ranks high (or low) in the default view—is it simply because of the page's popularity?
Using this information, in the case shown in the screen shot above, I notice that the site's home page is high on the list. A closer look at the other two listings shows that the page /bread-making-books, one of the most popular blog posts on the site, is actually slower than the home page, but the home page ranks higher as it's receiving more of the throughput (and it's not all that fast either). So, I'll go with the home page first, but will definitely come back to optimize the blog post soon after.
Once you've found a page you think your time will be best spent optimizing, it's time to pick a trace to go with it.
When you click on one of the pages in the list, a new view with more information about that page's history opens on the right.
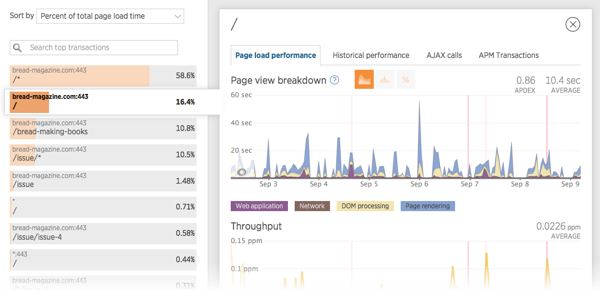
At the top of this view, you'll see the same data from the previous Page views screen, this time filtered to show only the data for this one page and its performance. Below this chart there is one showing this page's throughput over time.
To find a session trace, scroll down to the bottom of the page where you'll find a list of recent session traces involving this page:
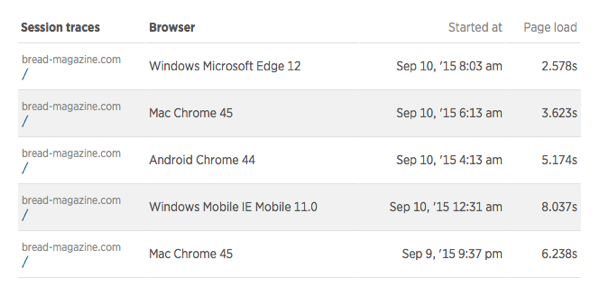
As you remember, our goal is to find one that represents the experience of as many of your visitors as possible. But as random variables often affect any specific trace, it's also a good idea to look at more than one before making any assumptions—or to use one trace to collect hypotheses and then confirm them by analyzing two or more other traces.
That said, you can make some assumptions about a trace's usefulness already by looking at the data in this list:
- We're looking for things to optimize, so the faster traces are not all that interesting.
- The visitor's web browser will tell you a lot about the user: someone running an old browser is most likely also using an old (and slow) computer. Whether this is a user you need to focus on or not depends on the customer base you are trying to reach.
- Also, some traces are clearly outliers. If most of the traces are in the 6-second range or below, one that took 24 seconds probably isn't all that representative.
In this case, the longest page load, 8.037 seconds, was on a mobile device, so that might have something to do with the network used. It's most likely worth checking out, but in order to rule out slowness that happens because of things out of our control, I decided to start with the next two: the Mac Chrome trace that took 6.238 seconds and the Android Chrome one taking 5.174 seconds.
Looking at the data from your own server, pick a couple of promising traces. Then, take a piece of paper (or open a new text document on your computer) and start writing down notes about things that might be in need of optimization.
Step 3: Analyze the Session Trace
A well-selected session trace will show you much of the same data we saw on the Page Views overview graph, but in much more detail—and for one session at a time.
Different sites call for different optimizations, so the best way to continue from here is to use the session trace you picked above to find issues specific to your site and your customers. For example, New Relic's servers are highly data-driven, and the application's interface relies on AJAX calls that are used to retrieve data to be shown in its tables and diagrams. On the other hand, on a magazine and blog site like mine, a lot of the user's time is spent loading images, videos, and other visual content.
Now, let's go through the trace.
The trace is split into four sections, each marked with a colored background. You'll find the labels and the durations of the different sections on the top right corner of the page:

In this summary, you'll find four steps that are similar to the phases shown on the Page Views page but not quite, and two extra variables:
- Backend: This is the part of the page load that was spent requesting and waiting for the site's HTML to load. If you compare it to the loading phases shown on the Page Views page, this one is longer as it combines the Web Application phase with the Network phase.
- Dom Processing: This is the time it took the browser to parse the HTML and use it to construct the DOM.
- Page Load: This phase begins when the DOM has been built and continues until all of the resourced referenced by the HTML (images, CSS files, asynchronous JavaScript files) have been loaded.
- Waiting On Ajax: On a site that is based heavily on AJAX calls, this one is important as it shows the point in time when the page becomes completely useful for the visitor. For example, on New Relic's dashboard, this is when all the charts are visible to the user. On the page used for this example trace, the waiting period is for a stream loaded from the Tumblr API so in a way the page is usable, if not totally complete, already before this milestone.
- The last two elements in this overview tell us about the user's behavior: First Interaction shows when the user first "touched" the page, either by scrolling it or clicking on something. Duration is the total length of the trace, i.e. how long the user stayed on the page.
In addition to this division, on the top of the session trace, you'll notice color-coded lines that show you a bird's-eye view of the trace:

These lines show events in the trace, categorizing them by their types. This is useful because all requests don't fall neatly into the four sections described above: You might very well find AJAX calls during the DOM Processing phase as well as more assets still loading after the page has been loaded.
Now, the moment we've been waiting for: let's dig into the session trace and explore the different optimization-related issues we can find in it, along with suggested fixes.
Check the Time Spent on the Server Request
The first thing you'll see when you look at a Session Trace is how long it took your server to respond to the request. In Browser, most of this is sort of a black box, as you'll only see what the web browser sees: the events marked with little blue dots represent events related to making requests and receiving responses.
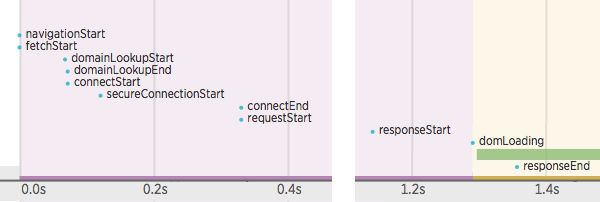
That said, this section does help us answer three important questions:
-
Is your server code in need of optimization? If the time between
requestStartandresponseStartis long, this means your server spent a lot of time processing the request and it's probably in need of optimization. In that case, jump over to the APM and Server side of New Relic and use them to find out what is taking all the time. -
Is your HTML response in need of optimization? By looking at the time difference between
responseStartandresponseEndyou'll see how long it took the browser to load your server's response—that is, the HTML code. If this time is long, it's a sign that you should do something to the HTML response itself: consider cleaning up the HTML code and minifying it for faster loading. - Does it make sense to focus on this session trace? If the standard network requests such as domain look-up are taking a long time (According to Yahoo, "[i]t typically takes 20-120 milliseconds for DNS to lookup the IP address for a given hostname"), this is a sign that the user might be using your site from a slow network. If most of your users or a big part of them are like this, use this information to guide you and cut all the fancy graphics and big images and make the site fast also on slow connections. Otherwise, this means you can move on to the next trace and start over.
Check the Time Spent Building the DOM Tree
Once the visitor's web browser has started to parse your server's HTML response, the session trace continues with the next phase, DOM Processing.
In the following screen shot, which I have split into three parts to help it fit on the page, you'll see the three events that describe the progress as the browser goes through the HTML content and builds the page's DOM tree.
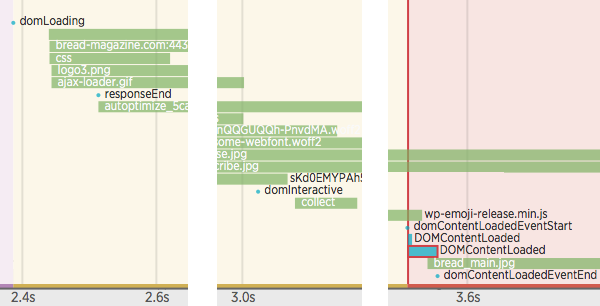
- DOM Processing begins with the event
domLoading. Notice that this happened already before the browser had loaded the entire response. - Then at around 3 seconds, you'll notice the event,
domInteractive. This marks the point when the browser finished parsing the HTML and the DOM tree was ready. There might still be missing elements blocking the JavaScript execution and so the browser can't yet move to rendering the page. - Finally, around the bottom right corner of the image, you'll see the event
domContentLoadedEventStart. At this point, the DOM is ready and no stylesheets are blocking the JavaScript execution, meaning that the browser can now construct the render tree. This is also when, for example, jQuery's$(document).ready()functions are triggered.
If the time between domLoading and domInteractive is long, that's a sign that the HTML structure on this page might be too complex. Also, if it takes a long time for the browser to reach domContentLoadedEventStart, it could be that a JavaScript or CSS file is blocking the critical render path.
To help with this, make sure your JavaScript files are loaded asynchronously when possible, and that you are not loading too many separate CSS files—like in the screen shot below.
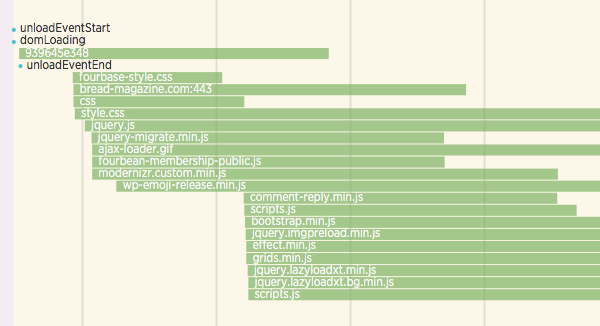
As a browser can load a limited number of files at once, every file—no matter how small—adds to the total loading time. Also, in the case of CSS files, the browser has to wait for them before rendering the page's content.
To fix this:
- Analyze the trace to see if there are unnecessary files being loaded. On my site, I found that some of my WordPress plugins were enqueuing unnecessary, almost empty stylesheet files—each adding to the loading time much more than would have been expected from their size.
- Consider whether your scripts and stylesheets are needed on every page. Quite often, scripts and stylesheets are included on a per-site basis when they are only needed on one page on the site (for example, you don't need to load a script related to credit card processing outside the shopping cart page). Also, remember that before the browser can render the page, it needs to parse your CSS: simplifying the CSS markup makes it quicker to process and reduces the time it takes to show the page.
- Combine files when possible. The biggest optimization to the number of files loaded in my site's case came from installing a WordPress plugin (Autoptimize) that combines all enqueued CSS files into one file and all JavaScript files into one. This way, instead of having to load 17 separate files, the visitors now only load 2.
Check How Long It Took to Load Your Resources
Once the DOM Processing phase is over, the trace moves to the next one, Page Load. That phase continues until all of the resources referenced in the HTML markup have been loaded and the page is ready. At that point, you'll see a dot showing the event domComplete and, soon after it, pageshow.
If this phase seems to be taking a long time, go through the resources during it and see if they are slowing down the rendering of the page. While the DOM processing doesn't block for images, loading them can rob bandwidth from something more important. And naturally, waiting for a long time for an image to load is not something that will make your users happy.
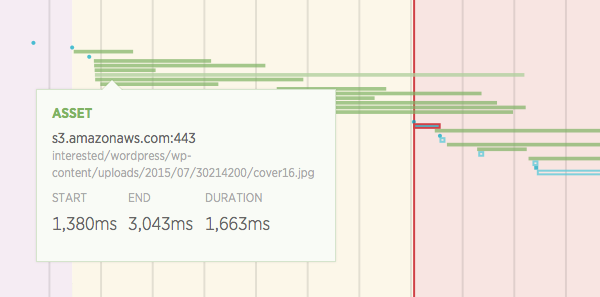
For example, if you look at the above image, it shows a magazine cover that took over one and a half seconds to load. While this might be OK for a photo shown somewhere later—inside an article when the user is already reading the content, for example—this is one of the first things shown on the page after it's loaded.
To fix this:
- Go through your resources and optimize your graphics when possible. Often, the simplest solution is the most efficient. So, before doing anything else, go through the session trace to see which of your files are taking a long time to load. Then, check if these files can be optimized. Don't rely on the browser to resize your images but scale them to the correct size already in advance.
-
Use lazy loading to load big graphics only when the user needs to see them. On long pages with lots of images, some of the images that appear only later when scrolling the page can very well be loaded only after the page is otherwise ready, using a lazy loading script such as lazy-load-xt. Don't go overboard, however: images shown "above the fold" are better loaded soon—after all, we want to show the first visible parts of the page as soon as possible.
- Consider using a CDN. A CDN is an extra investment, but if you are serving a lot of visitors, it's one well worth considering: by letting the user download resources from a source near them, it can speed up the loading of your resources dramatically.
Optimizing the cover image above to the size that was actually used on the front page brought the loading time down to 161 ms (although it's worth noting that different session traces are not directly comparable to each other because they are recorded on different environments).
Look for Slow JavaScript Blocks
When you continue scrolling down the trace, even while the browser is still loading resources, you might find events marked with a red border such as this one:
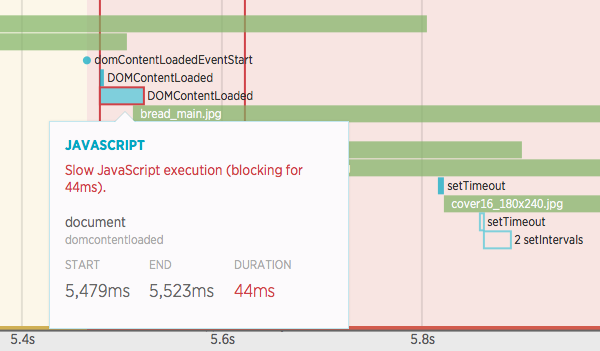
The red border means that this JavaScript function blocked for more than 33 ms. Browser's documentation explains that this is because callbacks longer than this, when called in rapid succession, reduce the frame rate below 30 frames per second, a speed which seems sluggish to humans.
So, when you find an event like this, check your JavaScript code and see what is happening inside. Knowing your code helps, as the blocks won't always be very descriptive.
Notice also that slow JavaScript blocks such as this are not limited to the initial loading but can happen anywhere in the session trace, depending on the JavaScript calls your application triggers. So, make sure to go through the entire trace all the way to the end so you don't miss anything.
Step 4: Analyze AJAX Requests
In modern web applications, AJAX requests are used for all kinds of things from optimizing the initial page load to doing server requests without reloading the page. So, depending on your architecture, you may find AJAX requests at very different points in your session traces.
In a session traces, AJAX requests are shown as blue bars like this:
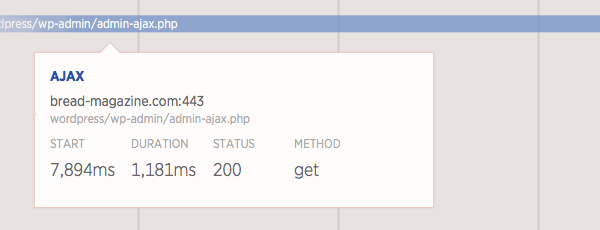
On the page we've been using as the example in this optimization step, one of the elements a visitor sees is a stream of videos and photos loaded from a Tumblr blog.
As the stream is loaded using the Tumblr API, it adds about a second to each page load. That's why I decided to move its loading to happen only after the page is otherwise fully loaded.
Using AJAX like this means, however, that the site isn't fully loaded when it reaches the DOM Completed step. To highlight this, the session trace adds a page load phase called Waiting for AJAX. It's up to you to decide, depending on what the AJAX call is used for, whether the user having to wait this long is an issue or not.
AJAX requests triggered later in the session, from an event not related to loading the document, are not counted for the Waiting for AJAX step.
Use the AJAX Page to Analyze Your AJAX Requests
If you think one of your AJAX requests, either during the page load or elsewhere in the site's execution, might be taking too long—or if you are just curious about the AJAX requests taking place in your application—click on the AJAX item on the left side menu.
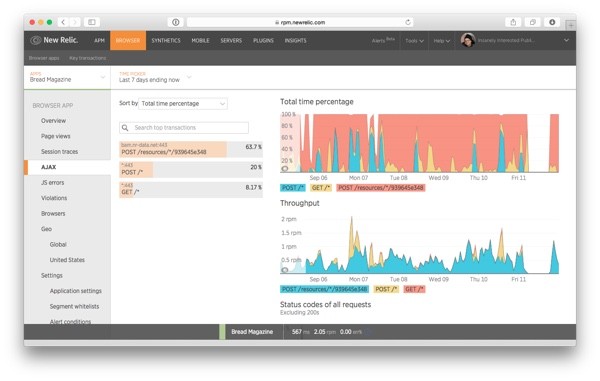
My example application isn't using many AJAX requests and so the New Relic callbacks make their way to the top of the list. Actually, the AJAX request I mentioned earlier is only third on the list: GET /*..
Clicking on the request's name opens a view with more information about the selected AJAX request, including where the time in this request is spent, how often the request is made, the list of errors it has returned, and how much data is transmitted in the typical request.
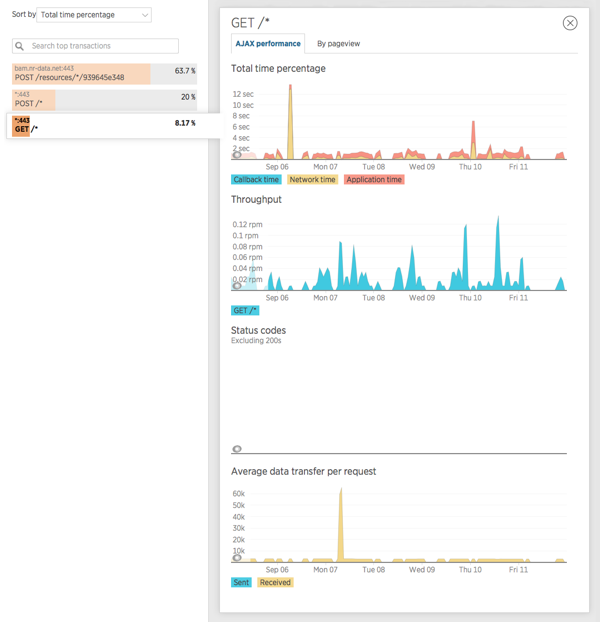
Analyzing this data, you can decide if there is something you want to do to either fix or optimize the AJAX request. In our example's case, everything seems to be running rather smoothly, so no immediate action is needed.
As a server-side action, what happens inside the AJAX handler isn't visible in Browser. For this, you can check APM—or simply jump to the code to see if there's something that could be optimized in it.
Step 5: Repeat
We have now gone through one session trace, and depending on how optimized your site was to begin with, you may have written down just a few ideas or even a full page of candidates for things to fix. Now, to make your hypotheses stronger, the next step is to start from the beginning: pick a second session trace and use it to see if the same issues are visible in it as well.
Then, go ahead, and fix what seems to be wrong!
How to Spot and Fix JavaScript Errors
We have now looked at optimizing your page loads and AJAX requests. But sometimes, the issue isn't a slow loading time but a JavaScript error that prevents your user from using your pages the way you have intended them to be used.
Luckily, Browser can be used for this as well.
Step 1: Pick a Practical Error to Fix
Whether you are looking to fix a bug reported to you by a customer or just want to make sure everything is running smoothly, the first place to look at when it's time to fix JavaScript errors is the JS Errors page.
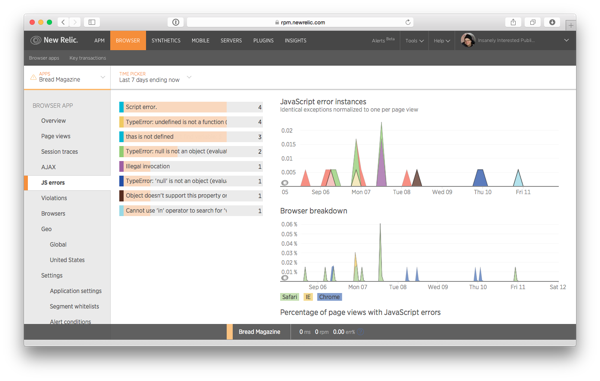
This page is very similar to the Page Views page we saw earlier.
On the left, you'll see a list of the errors that have happened on your visitors' machines during the selected time frame. If you don't see any—or if you want to filter out older errors—adjust the time frame to something that works well for your needs.
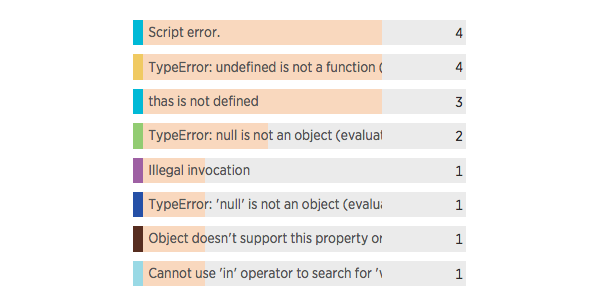
Now, looking at the error messages, you'll quickly notice that some are much more specific than others.
So, to make the most of your development time, try to pick something that happens a lot (is high on the list) but is also descriptive enough so you can actually find and fix it. A common error such as "Unexpected identifier" that can be raised because of many different reasons is not a good choice.
When you see something that looks promising, such as the third item in the list above, "thas is not defined", click on it to see more information about the error. The Overview tab includes a graph showing the number of page views affected by this error as well as a graph with the total rate of this error over time.
Following the two graphs, there's Browser Breakdown, a section that shows the distribution of browsers affected by this error. This is useful for figuring out if this is a browser-specific issue. Finally, at the end of the tab, whenever applicable, there's a list of session traces including this error.
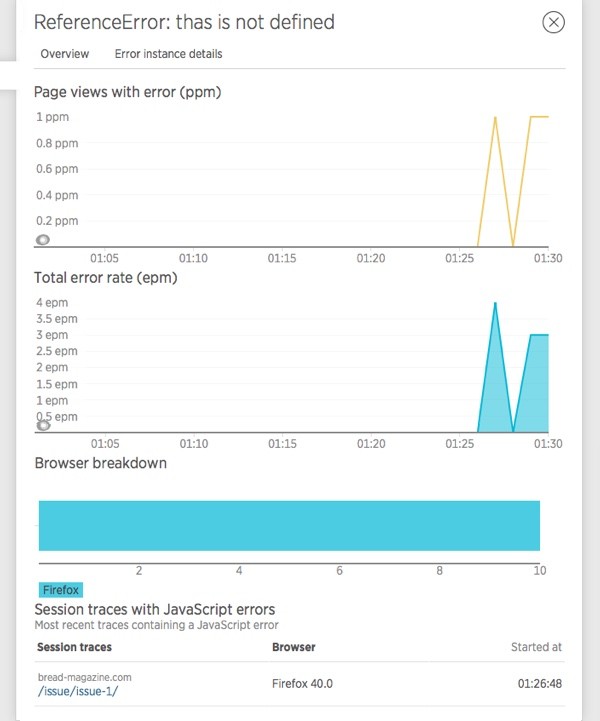
In all, this looks like a good candidate for an error to fix: the error is happening rather often, it has a descriptive error message, and it can even be found in a Session Trace.
Step 2: Look at the Stack Trace
On the second tab, Error instance details, you'll find more information about the error, including the full error message, the URL on which the error occurred, as well as a stack trace if there's one available.
In this case, the stack trace is very descriptive and so we can fix the bug simply by looking up the JavaScript code at the point referenced in the stack trace:
btnHover/<@https://bread-magazine.com/wordpress/wp-content/themes/fourplatform/library/js/scripts.js:32:21
m.event.dispatch@https://bread-magazine.com/wordpress/wp-includes/js/jquery/jquery.js:4:8497
m.event.add/r.handle@https://bread-magazine.com/wordpress/wp-includes/js/jquery/jquery.js:4:5235
The solution to this bug was simple: On line 32 of the scripts.js file mentioned in the stack trace, there was a typo in which I had typed thas instead of this.
Step 3: Reproduce on a Development Server and Fix
In a more complex case, where the session trace is not quite enough to show you where the error occurs, you'll want to find more information on when the error happens and how you can reproduce it on your own development machine.
To do this, first check to see if there is a session trace attached to the error. Looking at one can be a valuable tool that will give you insight on where the error happens in the application's flow and what the user did before the error was triggered.
For example, in this case, I can see the error happening three times in a trace. Each time, it takes place right after mousing a.button.btn.btn-primary.dark—that is, moving the mouse over a button. So now, even if I didn't have the stack trace, I could just run the app and bring my mouse over one of the buttons to see if I can trigger the error.
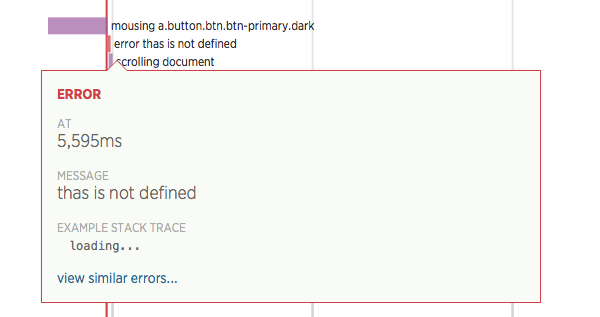
Once you have found the error, continue just as you would with any other JavaScript bug. Then push the fix live, and after a while, come back to see if the fix did its job.
Conclusion
We have now explored how you can use New Relic Browser to find the points on your web site or on your web-based application that frustrate your customers, both errors and times of slow loading.
In addition to what we just saw, New Relic Browser has tabs for looking at geography and browser data and how it affects your page's loading times. This can be useful information when you are considering CDNs or serving your data from a specific location.
Now, give Browser a try to find your own slow or failing actions.
Then, optimize your site and bring in more, and happier visitors!


Comments