I remember working on a Rails app a few years ago and someone floated the idea of using this new service that had appeared on the scene. It was called New Relic and they were promising to give you more insight into the performance of your Rails app, than you ever could get before. We gave it a try and it was impressive, more importantly it was something the Ruby web development ecosystem truly needed.
This content was commissioned by New Relic and was written and/or edited by the Tuts+ team. Our aim with sponsored content is to publish relevant and objective tutorials, case studies, and inspirational interviews that offer genuine educational value to our readers and enable us to fund the creation of more useful content.
Fast forward to now and you'd be hard-pressed to find a Ruby web application that doesn't have New Relic hooked in. New Relic as a company has continued to provide tools to monitor your Ruby apps, but they've also branched out into a number of other languages such as Java, Python and even .Net. But of course as the number of features you provide grows so does the complexity and the amount of documentation out there. It becomes hard to figure out where to start especially if you're not yet an expert.
Today I thought we could go back to the roots of New Relic and look at how we can get started with the service to monitor a Rails application.
A Basic Rails App
In order to use New Relic we need something to monitor, so let's set up a basic 'Hello World' Rails app.
The app we create will live under ~/projects/tmp/newrelic, and will be called newrelic_rails1. I assume you already have Rails installed:
cd ~/projects/tmp/newrelic
rails new newrelic_rails1
cd newrelic_rails1
There isn't much for us to do to create our 'Hello World' app. We need a new controller:
rails g controller hello
Now we just need a route, we will get the root route of the application to use our controller. We also need a view, with the words 'Hello World'. Given all this, our config/routes.rb should look like this:
NewrelicRails1::Application.routes.draw do
  root 'hello#index'
end
Our controller (app/controller/hello_controller.rb), will be as follows:
class HelloController > ApplicationController
  def index
  end
end
And our view (app/views/hello/index.html.erb), will be similar to:
<h1>Hello World!</h1>
We can now start up our development server:
rails s
When we curl localhost:3000, we get:
<!DOCTYPE html>
<html>
...
<body>
<h1>Hello World!</h1>
</body>
</html>
Everything is working!
Hooking in New Relic
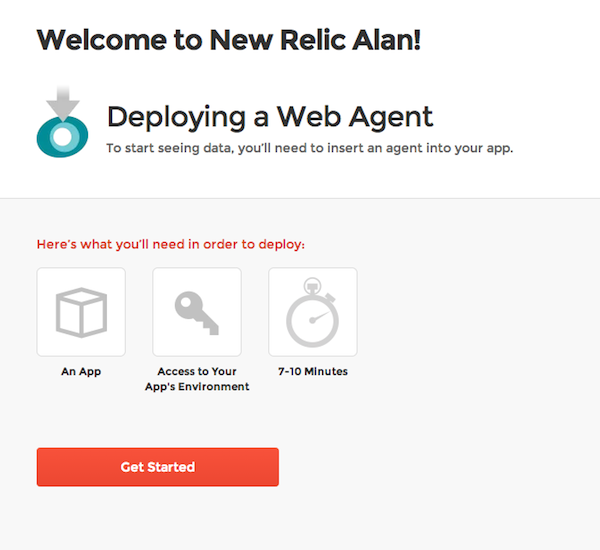
With Ruby it's very simple. We add a gem to our Gemfile, run a bundle install, drop a config file into the config folder and we have all we need. In fact, New Relic is pretty good at guiding you through this. All you need to do is log in to your account and if you haven't deployed a New Relic agent before, it's pretty obvious what to do:
Firstly, we install the New Relic agent gem by adding it to our Gemfile, as per the instructions:
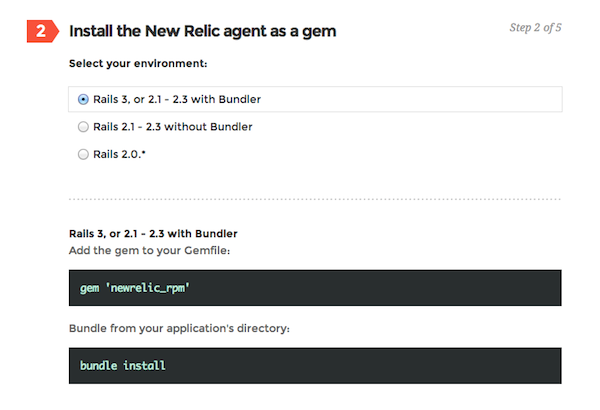
Our Gemfile will now look like this:
source 'https://rubygems.org'

gem 'rails', '4.0.0'
gem 'sqlite3'
gem 'sass-rails', '~> 4.0.0'
gem 'uglifier', '>= 1.3.0'
gem 'coffee-rails', '~> 4.0.0'
gem 'jquery-rails'
gem 'turbolinks'
gem 'jbuilder', '~> 1.2'

group :doc do
  gem 'sdoc', require: false
end

gem 'newrelic_rpm'
Whenever we add anything to the Gemfile we need to run:
bundle install
We also need a newrelic.yml, which you can download from New Relic:

It will come pre-configured with your license key. We need to put this file under config/newrelic.yml.
At this point if we ran our application in staging or production mode, we would already get data in our New Relic account. So let us do so:
RAILS_ENV=production rails s
This time when we curl localhost:3000, we get:
<!DOCTYPE html>
<html>
<head><script type="text/javascript">var NREUMQ=NREUMQ||[];NREUMQ.push(["mark","firstbyte",new Date().getTime()]);</script>
<title>NewrelicRails1</title>
<link data-turbolinks-track="true" href="/stylesheets/application.css" media="all" rel="stylesheet" />
<script data-turbolinks-track="true" src="/javascripts/application.js"></script>
<meta content="authenticity_token" name="csrf-param" />
<meta content="i5rBPaG52bzM5Kn0SJwIbq6Qz0dG0KsIlcd8tb9vMV8=" name="csrf-token" />
</head>
<body>
<h1>Hello World!</h1>
<script type="text/javascript">if (typeof NREUMQ !== "undefined") { if (!NREUMQ.f) { NREUMQ.f=function() {
NREUMQ.push(["load",new Date().getTime()]);
var e=document.createElement("script");
e.type="text/javascript";
e.src=(("http:"===document.location.protocol)?"http:":"https:") + "//" +
"js-agent.newrelic.com/nr-100.js";
document.body.appendChild(e);
if(NREUMQ.a)NREUMQ.a();
};
NREUMQ.a=window.onload;window.onload=NREUMQ.f;
};
NREUMQ.push(["nrfj","beacon-3.newrelic.com","b9119aa82e","2507356","cglYTRENCF4ERBtZB10KWRYKDABXGQ==",0,21,new Date().getTime(),"","","","",""]);}</script>
<p></body>
</html>
There is a bunch of JavaScript that got inserted into our pages so that New Relic can monitor browser time. This is one way we can tell that our New Relic integration is working. But it is not the only way, New Relic also creates a log file:
% cat log/newrelic_agent.log

Logfile created on 2013-09-22 16:23:13 +1000 by logger.rb/36483
[09/22/13 16:23:13 +1000 skorks-envato (12424)] INFO : Starting the New Relic agent in "production" environment.
[09/22/13 16:23:13 +1000 skorks-envato (12424)] INFO : To prevent agent startup add a NEWRELIC_ENABLE=false environment variable or modify the "production" section of your newrelic.yml.
[09/22/13 16:23:13 +1000 skorks-envato (12424)] INFO : Reading configuration from config/newrelic.yml
[09/22/13 16:23:13 +1000 skorks-envato (12424)] INFO : Enabling the Request Sampler.
[09/22/13 16:23:13 +1000 skorks-envato (12424)] INFO : Environment: production
[09/22/13 16:23:13 +1000 skorks-envato (12424)] INFO : Dispatcher: webrick
[09/22/13 16:23:13 +1000 skorks-envato (12424)] INFO : Application: My Application
[09/22/13 16:23:13 +1000 skorks-envato (12424)] INFO : Installing ActiveRecord 4 instrumentation
[09/22/13 16:23:13 +1000 skorks-envato (12424)] INFO : Installing Net instrumentation
[09/22/13 16:23:13 +1000 skorks-envato (12424)] INFO : Installing deferred Rack instrumentation
[09/22/13 16:23:13 +1000 skorks-envato (12424)] INFO : Installing Rails 4 Controller instrumentation
[09/22/13 16:23:13 +1000 skorks-envato (12424)] INFO : Installing Rails 4 view instrumentation
[09/22/13 16:23:13 +1000 skorks-envato (12424)] INFO : Installing Rails4 Error instrumentation
[09/22/13 16:23:13 +1000 skorks-envato (12424)] INFO : Finished instrumentation
[09/22/13 16:23:13 +1000 skorks-envato (12424)] INFO : Doing deferred dependency-detection before Rack startup
[09/22/13 16:23:16 +1000 skorks-envato (12424)] INFO : Reporting to: https://rpm.newrelic.com/accounts/303380/applications/2507356
We can also check our New Relic account to make sure a new application has appeared for monitoring:

There are however a few things that are not so nice:
- Our application is named 'My Application'
- We accepted all the default configuration values, which may not suit our app
- We had to launch our server in production mode (which is only possible cause it's a brand new app that doesn't rely on any external infrastructure)
So let us look at our newrelic.yml file in a little bit more detail to see how we can monitor our app performance exactly the way we want it.
Diving in to New Relic Configuration
First of all, the New Relic configuration file is extremely well commented and I encourage you to read the comments for the various configuration parameters to understand what all of them do.
Secondly, New Relic configuration is environment aware, and configuration for all environments is defined in the one newrelic.yml file, this is very similar to, how the Rails database.yml file works. We define a bunch of common configuration values and then override the relevant ones in the specific environment blocks e.g.:
common: &default_settings
  license_key: '<your licence key>'
  app_name: My Application
  monitor_mode: true

  ...

development:
  <<: *default_settings
  monitor_mode: false

test:
  <<: *default_settings
  monitor_mode: false

production:
  <<: *default_settings
  monitor_mode: true

staging:
  <<: *default_settings
  monitor_mode: true
We can instantly begin to see how we can fix some of the points that we raised above. If we don't want to have to launch our app in production mode while we're tweaking our configuration, all we have to do is enable monitoring in development mode (we will need to remember to switch this off when we're happy with our configuration as we don't want development data cluttering up our New Relic account).
development:
  <<: *default_settings
  monitor_mode: true
We should also override our application name for every environment that we have, to make sure they're monitored separately and the application name makes sense:
  common: &default_settings
    license_key: '<your licence key>'
    app_name: newrelic_rails1
    monitor_mode: true

    ...

  development:
    <<: *default_settings
    monitor_mode: true
    app_name: newrelic_rails1 (Development)

  test:
    <<: *default_settings
    monitor_mode: false
    app_name: newrelic_rails1 (Test)

  production:
    <<: *default_settings
    monitor_mode: true
    app_name: newrelic_rails1 (Production)

  staging:
    <<: *default_settings
    monitor_mode: true
    app_name: newrelic_rails1 (Staging)
With just those configuration tweaks, when we start our server in development mode and curl localhost:3000:

We're now monitoring our application in development mode and our app name is what we expect. If your application is saying that it's not receiving any data, give it a minute, it takes a little while for the data to start coming through.
The next most interesting (and often the most confusing) configuration value is the Apdex T-value. Unlike most of the other configuration parameters, this value does not live in the newrelic.yml file, but is instead found in the settings for the application within New Relic:
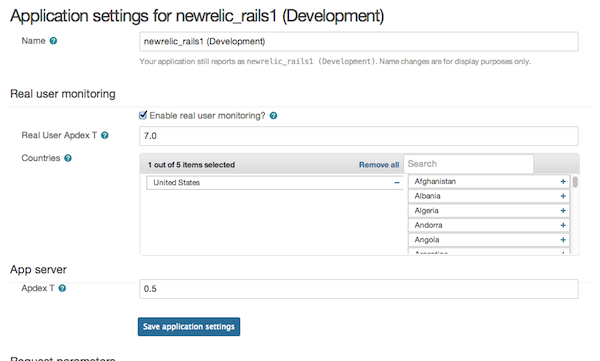
If you want to tweak your Apdex T-value you have to do it here, but what is this parameter and what is the right value to put in it? Well, New Relic explains it in the following way:
Your application's Apdex T-value is set to 0.5 seconds. That means requests responding in less than 0.5 seconds are satisfying (s), responding between 0.5 seconds and 2.0 seconds are tolerating (t), and responding in more than 2.0 seconds are frustrating (f).
Essentially, New Relic uses the Apdex value to gauge the health of your application as far as performance is concerned, so if many of the requests that are monitored by New Relic take longer than your Apdex value, New Relic will consider your application to be performing poorly and if you've set up alerts, will notify you of the fact. Basically, you have to figure out, how fast you want each server request to be fulfilled by your application, so if you're OK with a backend request taking two seconds, you can set your Apdex value to 2.0, but if you need a response to be returned within 100ms then you should set your Apdex value to 0.1.
If you have a new application you may set the Apdex value to the performance you desire from your application. If your app is an existing one, you may have some metrics regarding how fast it is/should be performing, and you can be guided by that. All requests which are fulfilled by the server in less than the Apdex T-value will be considered by New Relic to be fine. All requests fulfilled within Apdex * 4 seconds will be considered tolerating (i.e. users can tolerate it). All responses that take longer than Apdex * 4 will be considered frustrating (frustrated users don't tend to stick around). So, set your Apdex T-value in such a way that you actually get useful information out of it, the actual value depends on your domain and what you want to achieve (in terms of performance), there is no right or wrong answer.
We will set our Apdex T-value to 100ms (0.1), since all we have is a 'Hello World' app, and it should be able to return a response very quickly (even in development mode).
Even More New Relic Configuration
It was a little funny that most of the configuration comes from the newrelic.yml file, but the Apdex T-value is in the application settings, so New Relic now allows you to move all the configuration values from the YAML file into New Relic:
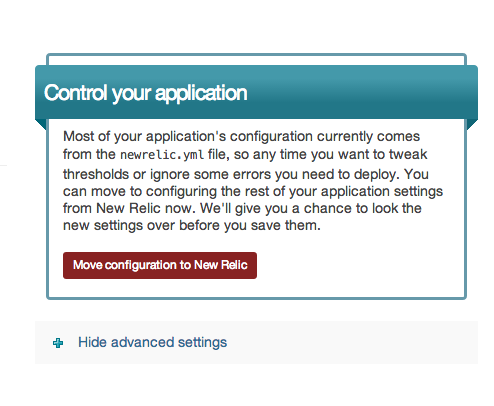
The advantage of this is that you don't have to redeploy every time you want to tweak your configuration values, so it is definitely something worth considering. We will stick with the YAML file for now.
So what are some of the other useful New Relic parameters we should know about?
Well, there is a set of parameters dealing with the New Relic agent log file:
log_level: info
log_file_path: 'log'
log_file_name: 'newrelic_agent.log'
These have sensible defaults, but if we want the log file to go to a specific place or if we want to see more or less info in the file, we can easily control this. Since we're just setting up New Relic we will set the log level to debug, to make sure we don't miss any important information (when we deploy we may want to set it to warn, or even error).
We now get a wealth of information in the log file, which (if read carefully) can give us a lot of insights into how New Relic works:
% cat log/newrelic_agent.log</p>
[09/22/13 17:23:39 +1000 skorks-envato (12925)] INFO : Starting the New Relic agent in "development" environment.
[09/22/13 17:23:39 +1000 skorks-envato (12925)] INFO : To prevent agent startup add a NEWRELIC_ENABLE=false environment variable or modify the "development" section of your newrelic.yml.
[09/22/13 17:23:39 +1000 skorks-envato (12925)] INFO : Reading configuration from config/newrelic.yml
[09/22/13 17:23:39 +1000 skorks-envato (12925)] DEBUG : Not in Rake environment so skipping blacklisted_rake_tasks check: uninitialized constant Rake
[09/22/13 17:23:39 +1000 skorks-envato (12925)] DEBUG : Updating config (add) from NewRelic::Agent::Configuration::YamlSource. Results:
[09/22/13 17:23:39 +1000 skorks-envato (12925)] DEBUG : {...}
[09/22/13 17:23:39 +1000 skorks-envato (12925)] DEBUG : Not in Rake environment so skipping blacklisted_rake_tasks check: uninitialized constant Rake
[09/22/13 17:23:39 +1000 skorks-envato (12925)] DEBUG : Updating config (add) from NewRelic::Agent::Configuration::ManualSource. Results:
[09/22/13 17:23:39 +1000 skorks-envato (12925)] DEBUG : {...}
[09/22/13 17:23:39 +1000 skorks-envato (12925)] DEBUG : Not in Rake environment so skipping blacklisted_rake_tasks check: uninitialized constant Rake
[09/22/13 17:23:39 +1000 skorks-envato (12925)] DEBUG : Installed New Relic Browser Monitoring middleware
[09/22/13 17:23:39 +1000 skorks-envato (12925)] DEBUG : Installed New Relic Agent Hooks middleware
[09/22/13 17:23:39 +1000 skorks-envato (12925)] DEBUG : Agent is configured to use SSL
[09/22/13 17:23:39 +1000 skorks-envato (12925)] DEBUG : Using JSON marshaller
[09/22/13 17:23:39 +1000 skorks-envato (12925)] DEBUG : Transaction tracing threshold is 2.0 seconds.
[09/22/13 17:23:39 +1000 skorks-envato (12925)] DEBUG : Ignoring errors of type 'ActionController::RoutingError'
[09/22/13 17:23:39 +1000 skorks-envato (12925)] DEBUG : Ignoring errors of type 'Sinatra::NotFound'
[09/22/13 17:23:39 +1000 skorks-envato (12925)] DEBUG : Errors will be sent to the New Relic service.
[09/22/13 17:23:39 +1000 skorks-envato (12925)] DEBUG : Ignoring errors of type 'ActionController::RoutingError'
[09/22/13 17:23:39 +1000 skorks-envato (12925)] DEBUG : Ignoring errors of type 'Sinatra::NotFound'
[09/22/13 17:23:39 +1000 skorks-envato (12925)] DEBUG : RequestSampler max_samples set to 1200
[09/22/13 17:23:39 +1000 skorks-envato (12925)] DEBUG : Resetting RequestSampler
[09/22/13 17:23:39 +1000 skorks-envato (12925)] INFO : Enabling the Request Sampler.
[09/22/13 17:23:39 +1000 skorks-envato (12925)] INFO : Environment: development
[09/22/13 17:23:39 +1000 skorks-envato (12925)] INFO : Dispatcher: webrick
[09/22/13 17:23:39 +1000 skorks-envato (12925)] INFO : Application: newrelic_rails1 (Development)
[09/22/13 17:23:39 +1000 skorks-envato (12925)] DEBUG : EnvironmentReport failed to retrieve value for "Plugin List": undefined method `plugins' for #<Rails::Application::Configuration:0x007fb232401a00>
[09/22/13 17:23:39 +1000 skorks-envato (12925)] DEBUG : EnvironmentReport failed to retrieve value for "JRuby version": uninitialized constant NewRelic::EnvironmentReport::JRUBY_VERSION
[09/22/13 17:23:39 +1000 skorks-envato (12925)] DEBUG : EnvironmentReport failed to retrieve value for "Java VM version": uninitialized constant NewRelic::EnvironmentReport::ENV_JAVA
[09/22/13 17:23:39 +1000 skorks-envato (12925)] DEBUG : EnvironmentReport ignoring value for "Rails threadsafe" which came back falsey: nil
[09/22/13 17:23:39 +1000 skorks-envato (12925)] DEBUG : Creating Ruby Agent worker thread.
[09/22/13 17:23:39 +1000 skorks-envato (12925)] DEBUG : Creating New Relic thread: Worker Loop
[09/22/13 17:23:39 +1000 skorks-envato (12925)] DEBUG : New Relic Ruby Agent 3.6.7.152 Initialized: pid = 12925
[09/22/13 17:23:39 +1000 skorks-envato (12925)] DEBUG : Connecting Process to New Relic: bin/rails
[09/22/13 17:23:39 +1000 skorks-envato (12925)] DEBUG : Not in Rake environment so skipping blacklisted_rake_tasks check: uninitialized constant Rake
[09/22/13 17:23:39 +1000 skorks-envato (12925)] DEBUG : Created net/http handle to collector.newrelic.com:443
[09/22/13 17:23:39 +1000 skorks-envato (12925)] DEBUG : Sending request to collector.newrelic.com:443/agent_listener/12/1f69cbd2a641bde79bdb5eb4c86a0ab32360e1f8/get_redirect_host?marshal_format=json
[09/22/13 17:23:39 +1000 skorks-envato (12925)] INFO : Installing ActiveRecord 4 instrumentation
[09/22/13 17:23:39 +1000 skorks-envato (12925)] INFO : Installing Net instrumentation
[09/22/13 17:23:39 +1000 skorks-envato (12925)] INFO : Installing deferred Rack instrumentation
[09/22/13 17:23:39 +1000 skorks-envato (12925)] INFO : Installing Rails 4 Controller instrumentation
[09/22/13 17:23:39 +1000 skorks-envato (12925)] INFO : Installing Rails 4 view instrumentation
[09/22/13 17:23:39 +1000 skorks-envato (12925)] INFO : Installing Rails4 Error instrumentation
[09/22/13 17:23:39 +1000 skorks-envato (12925)] INFO : Finished instrumentation
[09/22/13 17:23:39 +1000 skorks-envato (12925)] DEBUG : Registered NewRelic::Agent::Samplers::CpuSampler for harvest time sampling.
[09/22/13 17:23:39 +1000 skorks-envato (12925)] DEBUG : Registered NewRelic::Agent::Samplers::MemorySampler for harvest time sampling.
[09/22/13 17:23:39 +1000 skorks-envato (12925)] DEBUG : NewRelic::Agent::Samplers::ObjectSampler not supported on this platform.
[09/22/13 17:23:39 +1000 skorks-envato (12925)] DEBUG : NewRelic::Agent::Samplers::DelayedJobSampler not supported on this platform.
[09/22/13 17:23:39 +1000 skorks-envato (12925)] INFO : Doing deferred dependency-detection before Rack startup
[09/22/13 17:23:40 +1000 skorks-envato (12925)] DEBUG : Uncompressed content returned
[09/22/13 17:23:40 +1000 skorks-envato (12925)] DEBUG : Created net/http handle to collector-1.newrelic.com:443
[09/22/13 17:23:40 +1000 skorks-envato (12925)] DEBUG : Sending request to collector-1.newrelic.com:443/agent_listener/12/1f69cbd2a641bde79bdb5eb4c86a0ab32360e1f8/connect?marshal_format=json
[09/22/13 17:23:42 +1000 skorks-envato (12925)] DEBUG : Uncompressed content returned
[09/22/13 17:23:42 +1000 skorks-envato (12925)] DEBUG : Server provided config: {...}
[09/22/13 17:23:42 +1000 skorks-envato (12925)] DEBUG : Not in Rake environment so skipping blacklisted_rake_tasks check: uninitialized constant Rake
[09/22/13 17:23:42 +1000 skorks-envato (12925)] DEBUG : Updating config (add) from NewRelic::Agent::Configuration::ServerSource. Results:
[09/22/13 17:23:42 +1000 skorks-envato (12925)] DEBUG : {...}
[09/22/13 17:23:42 +1000 skorks-envato (12925)] DEBUG : Wiring up Cross Application Tracing to events after finished configuring
[09/22/13 17:23:42 +1000 skorks-envato (12925)] DEBUG : Connected to New Relic Service at collector-1.newrelic.com
[09/22/13 17:23:42 +1000 skorks-envato (12925)] DEBUG : Agent Run = 575257565.
[09/22/13 17:23:42 +1000 skorks-envato (12925)] DEBUG : Connection data = {...}
[09/22/13 17:23:42 +1000 skorks-envato (12925)] INFO : Reporting to: https://rpm.newrelic.com/accounts/303380/applications/2507376
[09/22/13 17:23:42 +1000 skorks-envato (12925)] DEBUG : Browser timing header: "<script type=\\"text/javascript\\">var NREUMQ=NREUMQ||[];NREUMQ.push([\"mark\",\"firstbyte\",new Date().getTime()]);</script>"
[09/22/13 17:23:42 +1000 skorks-envato (12925)] DEBUG : Browser timing static footer: "if (!NREUMQ.f) { NREUMQ.f=function() {\nNREUMQ.push([\"load\",new Date().getTime()]);\nvar e=document.createElement(\"script\");\ne.type=\"text/javascript\";\ne.src=((\"http:\"===document.location.protocol)?\"http:\":\"https:\") + \"//\" +\n \"js-agent.newrelic.com/nr-100.js\";\ndocument.body.appendChild(e);\nif(NREUMQ.a)NREUMQ.a();\n};\nNREUMQ.a=window.onload;window.onload=NREUMQ.f;\n};\n"
[09/22/13 17:23:42 +1000 skorks-envato (12925)] DEBUG : Real User Monitoring is using JSONP protocol
[09/22/13 17:23:42 +1000 skorks-envato (12925)] DEBUG : Reporting performance data every 60 seconds.
[09/22/13 17:23:42 +1000 skorks-envato (12925)] DEBUG : Running worker loop
[09/22/13 17:23:50 +1000 skorks-envato (12925)] DEBUG : Attempting to insert RUM header at beginning of head.
For example we can see that:
- We can switch off monitoring even if it's switched on in the configuration file, by setting an environment variable
NEWRELIC_ENABLE=false - We can see that New Relic inserts a bunch of Rack middleware
- We're using Webrick as our server, which is obviously in development mode, but in production it would be good to confirm that New Relic recognises the server that we're using
- New Relic is sending data to
collector.newrelic.com:443 - New Relic is sending data every 60 seconds
- Real user monitoring is done via JSONP
Very useful information when you're trying to figure out how things hang together.
Most of the other configuration parameters are pretty self explanatory e.g.:
browser_monitoring:
  auto_instrument: true
capture_params: false
The only other one to possibly be aware of is:
transaction_tracer:
  transaction_threshold: apdex_f
The transaction tracer captures detailed data about requests that take too long. The transaction threshold is normally a multiple (x4) of the Apdex value, but it is often useful to divorce these values from each other. You might be happy with an Apdex score of one second, but you may want to capture detailed data about requests that take 1.5 seconds or longer (instead of the four seconds or longer which would happen by default). So you can set this parameter separately:
transaction_tracer:
  transaction_threshold: 1.5
The New Relic Developer Mode
One of the configuration values you may have noticed was:
developer_mode: true
This should only be switched on in development (if at all). In development mode, New Relic agent will store performance data about the last 100 requests in memory. You can look at this data at any time by hitting the /newrelic endpoint of your running application:

I hardly ever use it, but it's there if you need it.
Notifying New Relic of Deployments
Whenever you're working on the performance of your application, it's always good to know if a particular deploy has had a positive or negative effect on performance. For this purpose, you can notify New Relic every time you perform a deploy. This way if performance degrades or improves, you'll be able to see which deploy was the culprit. New Relic provides Capistrano hooks to do this, but I prefer the command line way:
% newrelic deployments -a 'newrelic_rails1 (Development)' -e 'development' -u 'skorks' -r 'abc123'
Recorded deployment to 'newrelic_rails1 (Development)' (2013-09-22 18:19:13 +1000)
The key thing is to correctly supply the application name as configured in the newrelic.yml file.
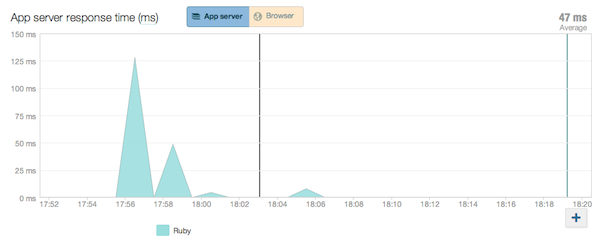
We will get nice lines on the relevant New Relic graphs to indicate when a deployment occurred.
Conclusion
You now know a whole lot about how New Relic works and how to start using it to monitor a Rails application. But configuring things properly is only half the battle, what kind of metrics will New Relic actually capture for you? And how can you use them to improve the performance of your application? We will look at some of these in a subsequent article. For now, have a go at configuring New Relic for your Rails application (you'll get a free T-shirt) and if you have any questions don't forget to leave a comment.


Comments