Xcode 6 brings a number of significant improvements. One of the more notable advances is view debugging. Often times, an app's user interface will not behave the way it's expected to. Views may not be shown or, if they do show, they may display incorrectly. This tutorial outlines how to use Xcode's new view debugging features to easily identify and fix issues in an app's user interface.
1. Demo Project
To get us started, download the sample project from GitHub and open ViewDebugging.xcodeproj. The project contains a simple tabbed application with a few view controllers, an application delegate, and a storyboard. This app was designed for the iPhone, but it will display fine on any device since it uses adaptive layout, introduced in iOS 8.
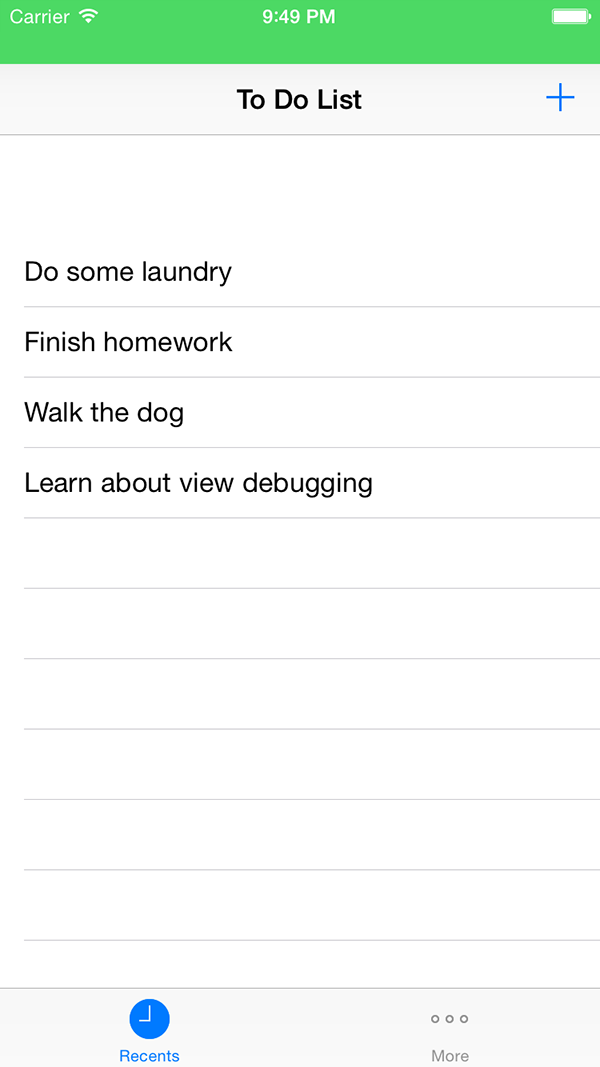
The purpose of the app is to make a simple to-do list. It includes a summary screen to view other information, such as the number of items in the to-do list, the user's avatar, and their Twitter handle. Run the app in the iOS Simulator by clicking build and run in the top left.

Right away, you may notice an issue with the user interface. The table view doesn't seem to be displaying any data. Open up FirstViewController.swift and locate the following line of code.
var mockNotesDataSource: [String] = ["Do some laundry", "Finish homework", "Walk the dog", "Learn about view debugging"]
{
    didSet
    {
        self.tableView.reloadData()
    }
}
The mockNotesDataSource variable serves as the table view's data source. We use Swift's property observer capabilities. As a result, the table view is automatically reloaded whenever the data source changes. By looking at the above code snippet, four items should be displayed in the to-do list. It appears that something else is wrong.
2. Enable View Debugging
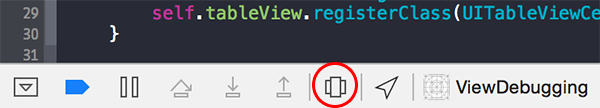
The issue seems to be related to the user interface. While the app is running, press the Debug View Hierarchy button at the bottom. Alternatively, navigating to Debug > View Debugging > Capture View Hierarchy also enables view debugging.
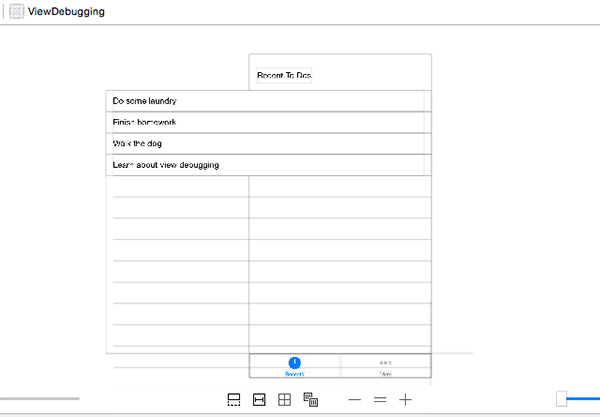
When view debugging is enabled, Xcode takes a snapshot of the application's view hierarchy and presents a three-dimensional, exploded view of the user interface. It shows the application's view hierarchy, the position, order, and size of each view as well as how the views are interacting with one another.
Looking at the three-dimensional render, we can see that the to-do list is loading fine, but the table view cells are too wide.
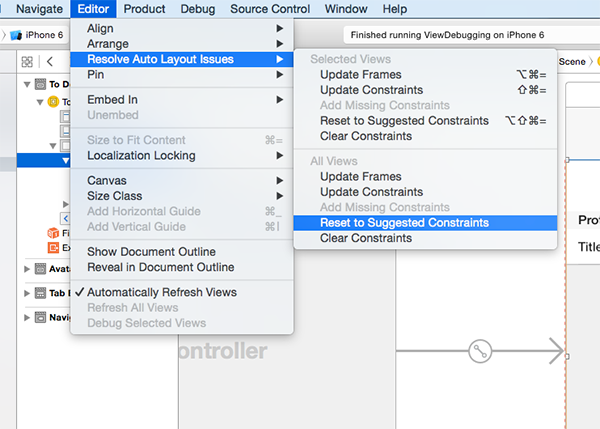
Stop debugging the application and navigate to Main.Storyboard to fix the issue. Click on the table view and select Editor > Resolve Auto Layout Issues > Reset to Suggested Constraints.
Build and run the application once more to confirm that the user interface is displaying correctly. Click the Debug View Hierarchy button to take a closer look at some of the other features of view debugging.
3. View Debugging Features
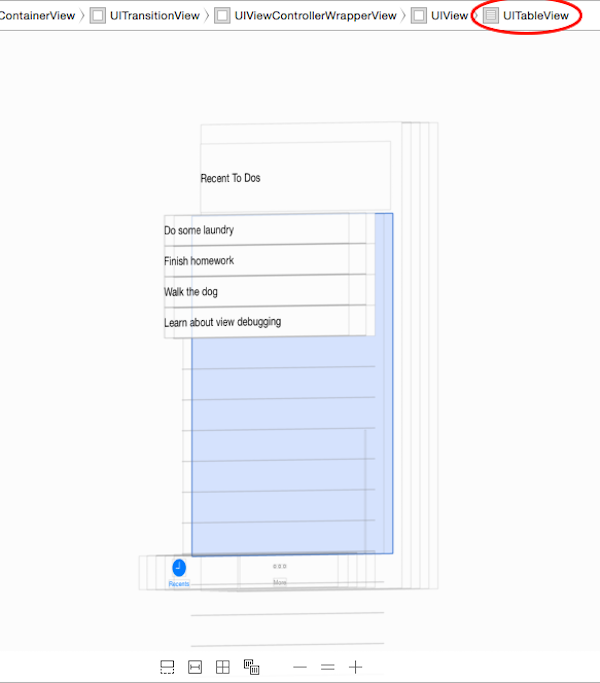
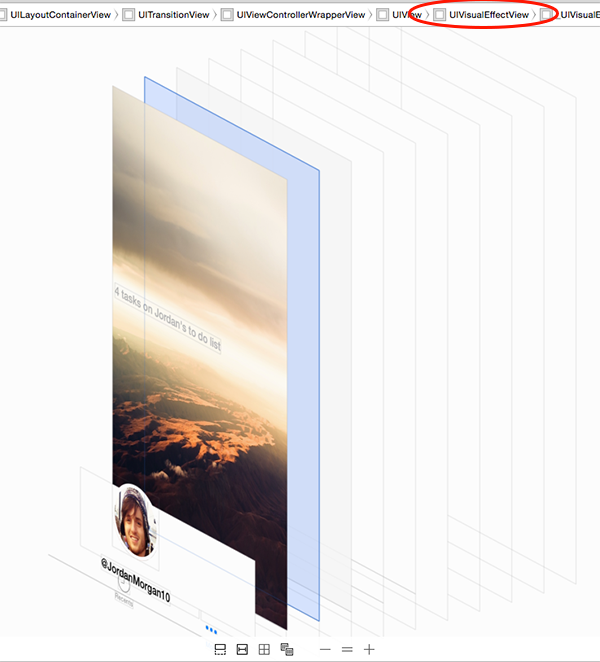
Click and drag anywhere inside the three-dimensional render to tilt and pan the user interface. Tilt it to the left or right to select the table view.
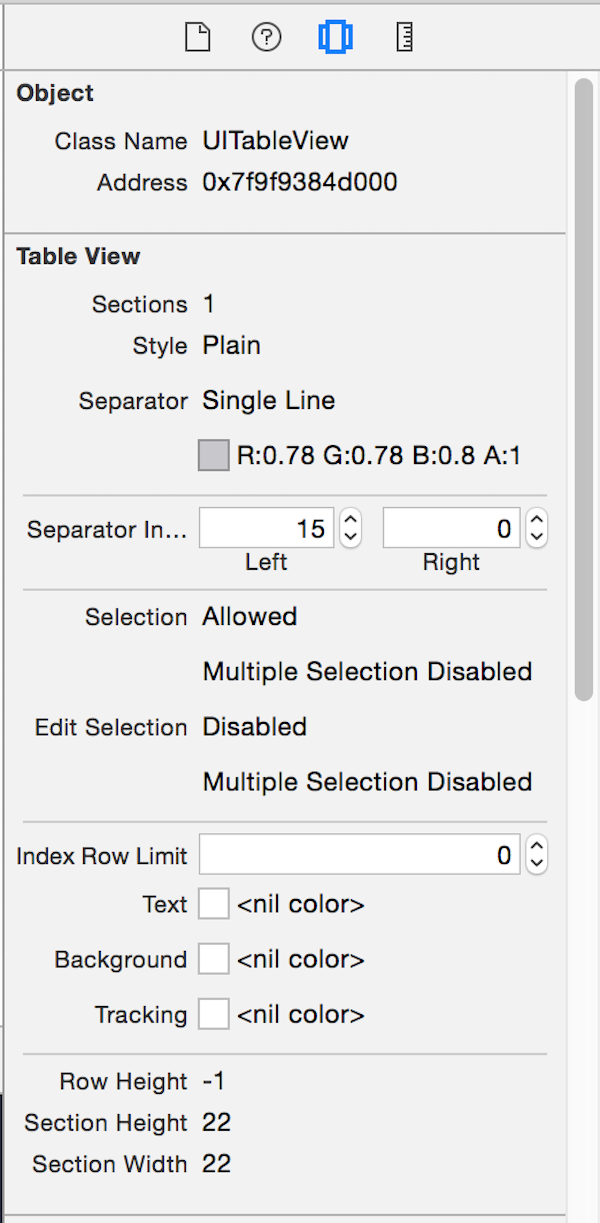
Once a view is selected, Xcode highlights the view and populates the Object and Size inspectors on the right. To confirm that you've selected the table view, look at the jump bar at the top and verify that UITableView is the last item on the right.
The Object and Size inspectors include a wealth of helpful information. In the past, developers had to rely on log statements or breakpoints to inspect a view's configuration.
Open up the Size inspector on the right and, in the Auto Layout section, notice that the correct constraints are now applied to the view. In the Object inspector, you can inspect the attributes of the selected view.
Right above the debugging area in Xcode, there are nine buttons and sliders used for view debugging.

This is what each of these controls does, from left to right:
- adjust spacing between views: adjusts how much space is shown between views
- show clipped content: shows clipped content on the view currently displayed
- show constraints: shows only the constraints of the selected view
- reset the viewing area: sets the 3D render perspective back to its default
- adjust the view mode: display the 3D render with just the content, wireframes, or a combination of the two
- zoom out: zooms the 3D render out
- actual size: resets the 3D render back its default
- zoom in: zooms the 3D render in
- adjust the range of visible views: hides views, starting from the back of the 3D render, sliding the slider from right to left has the opposite effect
Take a few minutes to play with these controls to properly understand what each of them does.
4. Sorting Through View Layers
Build and run the application again and tap the More tab at the bottom of the app's user interface. At first glance, the user interface looks okay, but it isn't behaving exactly how it should. A blur effect on top of the picture isn't displaying. Debug the view hierarchy to better identify the problem.
Start by panning to the left or right to view everything at an angle. Next, drag the view spacing slider towards the right.

With the user interface pulled apart, it becomes clear that there is another view hidden beneath the image. Select it to confirm it's the missing visual effect view.
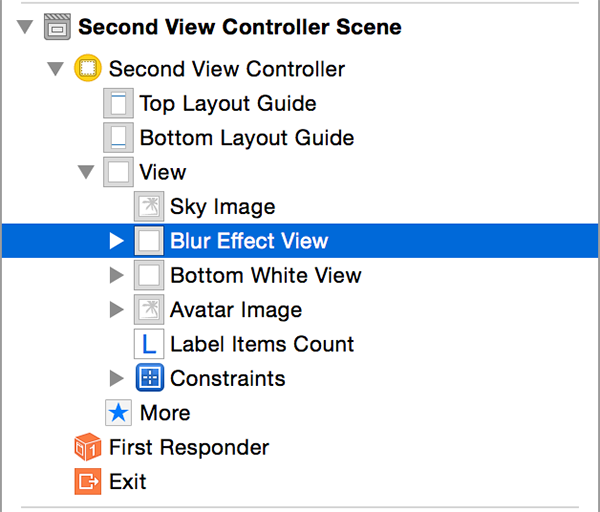
Open Main.storyboard and navigate to Second View Controller Scene. In the document outline pane on the left, expand the Second View Controller's View object to see how its subviews are ordered.
Xcode layers views in ascending order within the document outline. In other words, the ones at the top of the list are the foundation of the view hierarchy.
Fixing our issue is simple. Blur Effect View will be beneath Sky Image at runtime, because it's the first view in the view hierarchy. Click and drag the Blur Effect View underneath Sky Image in the document outline. The result should now look like the screenshot below.
If you run the app again, the blur effect should be visible. The app's user interface now looks as it was designed. Let's look at some of the iOS Simulator's debugging features to see what else can be improved.
5. iOS Simulator Debugging Features
Build and run the app in the iOS Simulator. With the iOS Simulator selected, select Color Blended Layers from the Debug menu.
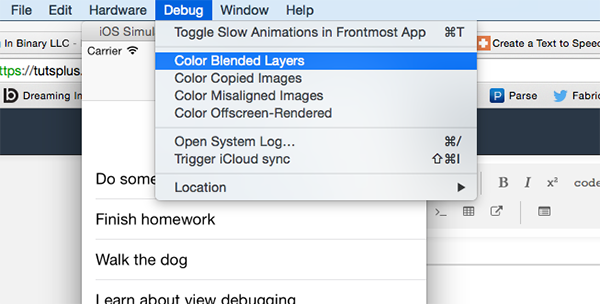
The app's user interface is overlaid with a mix of green and red. These are cues to show which layers have blending enabled and which ones are opaque. Blending layers is computationally intensive. It is therefore recommended to use opaque layers whenever possible.
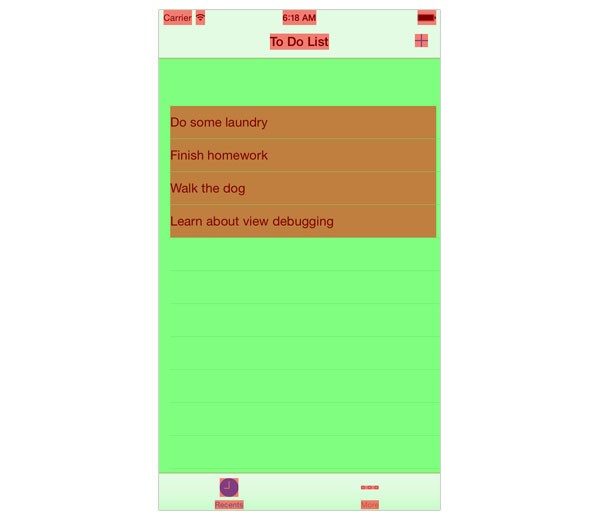
Apple notes in their documentation to try and use opaque layers when dealing with table views. One of the main causes of poor performance when scrolling is due to blended content. When the content's background is opaque, scrolling will generally become smoother.
For this app, if a user has hundreds of items in their to do list they may experience choppy or inconsistent scrolling performance. The table view cells are currently using blended layers. Since the view controller's view background is already white, the end user won't see any difference if the table view cells are blended or opaque with a white background.
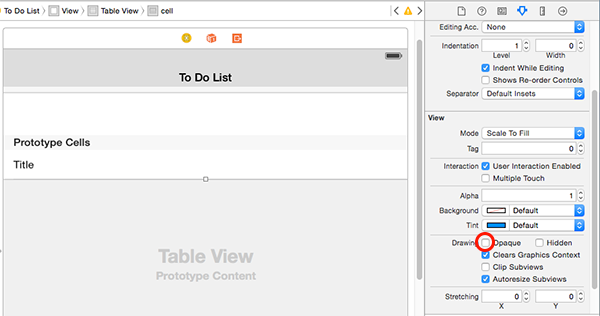
Open Main.storyboard and select the table view cell prototype in the To Do list Scene. In the Attributes Inspector. Scroll down to the Drawing section and check Opaque.
Build and run the app with coloring blended layers enabled. Since the table view cells are now opaque, they are overlaid with a green color, indicating that they're opaque.
Aside from flagging layers, there are a handful of other features that can aid in debugging in the iOS Simulator. Here are some of the ones I find most useful:
- Toggle Slow Animations in Frontmost App: This feature causes all animations in the app to run slower, which is helpful when debugging complex animations that aren't behaving as expected. You can also enable this options by pressing Command-T.
- Color Copied Images: This options adds a blue overlay to each copied image using Core Animation.
- Color Misaligned Images: This features colors images with a magenta overlay if the bounds are not perfectly aligned with the destination pixels. A yellow overlay is added if used if the image is drawn using a scale factor.
- Color Off Screen Rendered: This option add a yellow overlay to content that is rendered off screen.
Something overlooked by many developers is the impact of the status bar on your app if a call is in progress. You can easily test this by toggling the in-call status bar. You do this by selecting Toggle In-Call Status Bar from the Hardware menu in the iOS Simulator.
To see how your app responds to such an event, press Command-T, to enable slow animations, and press Command-Y to display the in-call status bar. If your app uses a navigation bar, then the operating system takes care of this for you.
Aside from coloring views, keep in mind that the iOS Simulator can also debug Core Location issues. You can simulate a device at a specific latitude and longitude and there are even a number of sample locations included to test with. If your app is using iCloud to manage data, then you can also manually trigger a synchronization event.
Conclusion
While the demo app included is very simple, using the techniques mentioned in this article can shave hours off of future projects. View debugging can help you correct many problems that come up in the user interface.
Outside of Xcode and interface builder, using the iOS Simulator's debugging features can help boost performance and identify bottlenecks. Apple's own human interface guidelines stress the importance of responsive apps that are easy to use and navigate. With the improvements made to interface builder, it's never been easier to do just that.

Comments