A running application is not just a bunch of code, the code also has to run somewhere. I am talking about your production servers. It is just as important to ensure that your production boxes are behaving themselves as it is to make sure that your application code is performant. You can set up systems like Nagios to help you with this, but these can be extremely complex to work with, require significant infrastructure of their own and can be total overkill (unless your infrastructure needs are extremely complex). New Relic provides a less full-featured but very simple alternative when it comes to infrastructure monitoring.
If you've read some of our previous articles on New Relic, you should be right at home with how the New Relic dashboards work. The server monitoring dashboards use the same concepts. If you're already using New Relic, you can begin receiving data about your server performance very quickly. Even if you haven't previously set up New Relic, it may be worth using it just for server monitoring. The six or so dashboards that New Relic provides can significantly delay (or even entirely remove) the need for a more full-featured infrastructure monitoring solution.
Why Do I Need a Service to Monitor Boxes at All?
Depending on the needs of your application, you may have a web component, database, cache, search, load balancer, etc. Some of these may share the same box. But, once your application gets beyond a certain size, you will start putting some of these on their own boxes. When you only have one production server things are easy. You SSH into that box, run a few shell commands and get a pretty good idea regarding the health of that one server. As the number of boxes grows this can become a bit of a chore. It would be handy if you could have a way to find out about the health of all your boxes at once. This is exactly the problem that New Relic server dashboards solve. You get a snapshot of the health of all your production servers at once.
Of course, manually checking the health of all your servers is not the most efficient thing to do. When things go wrong, you want to find out as soon as it happens, not the next time you decide to check. Most infrastructure monitoring systems have a way to send alerts when particular parts of the monitored servers fail (e.g., disk full, using too much RAM etc). New Relic is no different. You can use the very flexible, alert policy infrastructure to send failure notifications in any way you like, such as email, web hooks etc.
Lastly, infrastructure issues often don't appear suddenly, historical context is important. RAM will slowly get eaten up for hours before the box begins to fail, the disk will fill up for days before things come to a head. Spot checking your servers does not give you the historical context you need to prevent the issues from happening. If you just happen to check the disk usage when it's getting a bit full, you can do something about it. If not, you only learn about the problem when your boxes die. New Relic collects data and sends it back to their servers all the time, so the dashboards are all about historical context. This makes it very easy to preempt certain classes of problems.
It Works in Real Life
Let me tell you a couple of stories. We use New Relic in Tuts+ for both application performance monitoring and server monitoring. A few months ago I was on call, when our boxes started misbehaving every few minutes. They weren't quite falling over, but the application would perform very poorly for short periods of time. I logged on to the boxes and found that the memory usage was very high. So I rebooted the servers one by one and things seemed to be ok for a while. But a few hours later it all started happening again. This smelled like a memory leak.
So I logged in to New Relic to have a look at the graphs. Sure enough, one of the deploys we did previously had introduced a memory leak into the application. It would take a few hours for all the memory to be consumed by the application at which point it would go into a desperate garbage collection frenzy, causing all sorts of funny issues. Looking at the memory graphs on all the boxes it was immediately obvious what was happening. At the time we didn't have any alerts set up (we do now), so we didn't become aware of the problem until it caused other issues to manifest. But, being able to compare all the boxes to each other, as well as having the historical context, let me easily diagnose the problem, roll out a fix and get to sleep on time that night.
Here is another one. Recently there was an outage in the AWS datacenter where Tuts+ is hosted. When things finally settled down, we rebooted all the boxes to make sure there were no niggling issues. But when the boxes came back, the application would intermittently return 500 responses or perform very poorly some of the time. This was likely an issue with one or more of the servers, which is very annoying to diagnose when you have many boxes. Once again, looking at New Relic allowed us to surface the issue very quickly. One of our boxes came back with a rogue process which was consuming a lot of CPU, causing the app on that box to perform poorly. Another box was affected by some sort of AWS glitch which caused the disk IO utilization of that box to be 100%. We took that box out of our load balancer, got rid of the rogue process on the other one and the application started to perform fine again.
The graphs New Relic provides are truly useful and I wouldn't want to do without them, so let me show how to get server monitoring up and running.
Installing the New Relic Server Monitoring Agent
Basically it all comes down to logging on to your server and installing the New Relic server monitoring daemon (nrsysmond). If you've read the New Relic for PHP article, the procedure is almost identical. As usual, let's assume we're on Ubuntu.
The first thing to do is to import the New Relic repository key:
wget -O - https://download.newrelic.com/548C16BF.gpg | sudo apt-key add -
Now we add the New Relic repository itself to the system:
sudo sh -c 'echo "deb http://apt.newrelic.com/debian/ newrelic non-free" > /etc/apt/sources.list.d/newrelic.list'
Now we just use apt:
sudo apt-get update
sudo apt-get install newrelic-sysmond
After it's finished installing, you will get a nice message like this:
*********************************************************************
*********************************************************************
***
***  Can not start the New Relic Server Monitor until you insert a
***  valid license key in the following file:
***
***     /etc/newrelic/nrsysmond.cfg
***
***  You can do this by running the following command as root:
***
***     nrsysmond-config --set license_key=<your_license_key_here>
***
***  No data will be reported until the server monitor can start.
***  You can get your New Relic key from the 'Configuration' section
***  of the 'Support' menu of your New Relic account (accessible at
***  https://rpm.newrelic.com).
***
*********************************************************************
*********************************************************************
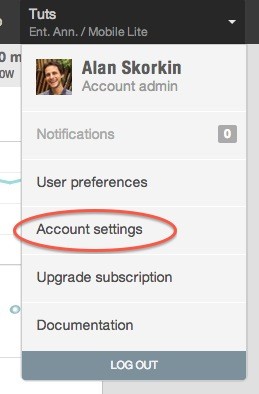
Let's do what it says. Firstly, let's jump into our New Relic account settings to look up our license key (it will be on the right):
Now let's run the command:
nrsysmond-config --set license_key=<your_license_key_here>
If you check the config file now: /etc/newrelic/nrsysmond.cfg. You'll see your license key in there. We're ready to start the agent:
/etc/init.d/newrelic-sysmond start
You can now check your process list to make sure it is running:
ps -ef | grep nrsys
newrelic 10087     1  0 09:25 ?        00:00:00 /usr/sbin/nrsysmond -c /etc/newrelic/nrsysmond.cfg -p /var/run/newrelic/nrsysmond.pid
newrelic 10089 10087  0 09:25 ?        00:00:00 /usr/sbin/nrsysmond -c /etc/newrelic/nrsysmond.cfg -p /var/run/newrelic/nrsysmond.pid
ubuntu   10100  9734  0 09:25 pts/1    00:00:00 grep --color=auto nrsys
As per the PHP agent, there are two processes. One is a monitor process and the second is the worker. The worker actually does the job of communicating with the New Relic servers, the monitoring process simply watches the worker and if the worker dies, for whatever reason, it will spawn a new one.
We can also check the logs to make sure there were no errors on startup:
cat /var/log/newrelic/nrsysmond.log
2014-05-25 09:25:02 [10089/main] always: New Relic Server Monitor version 1.4.0.471/C+IA started - pid=10089 background=true SSL=true ca_bundle=<none> ca_path=<none> host=ip-10-196-10-195
2014-05-25 09:25:03 [10089/main] info: RPM redirect: collector-102.newrelic.com(50.31.164.202) port 0 (0 means default port)
Everything looks fine, and you should now start seeing data appear in the New Relic UI.
Configuring the Server Monitoring Agent
Most of the time you won't need to configure anything else beyond the license key, but if you do need to up the log level or configure a proxy, it is definitely possible. It all lives in /etc/newrelic/nrsysmond.cfg. The file is very well commented and pretty self-explanatory. If you do change anything, remember to restart the daemon:
/etc/init.d/newrelic-sysmond restart
There is only one subtle thing when it comes configuring server monitoring and that's the name of the server, as it will be seen in the New Relic dashboards. By default New Relic will take the hostname of the box and make that the name of the server in the dashboards (i.e., the output of the hostname command). I recommend you keep it this way. If you're also using New Relic for application monitoring, keeping the hostname, as output by the hostname command, as the name of the server will ensure that New Relic can correctly work out which applications are running on which boxes and link everything up properly in the UI.
If you really have to, you can change the name of the server as it will appear in the UI by setting the hostname= parameter in the configuration file: /etc/newrelic/nrsysmond.cfg. You will need to restart the daemon for this to take effect. You can also modify the name of the server directly in the UI which won't affect the daemon.
Using the Server Monitoring Dashboards
The first thing you see when you click the Servers link on the left is a snapshot of all your servers and the key metrics for all of them (CPU, Disk, Memory, IO).
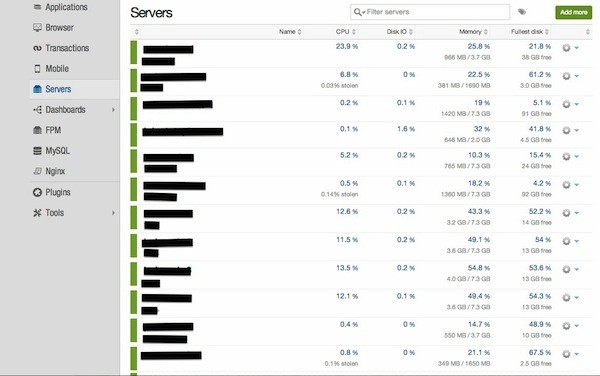
This page can let you see if one or more of your boxes are obviously misbehaving. Here you can also rename a server or add tags to it, if necessary.
If we click on one of the servers, we come to the main server dashboard:
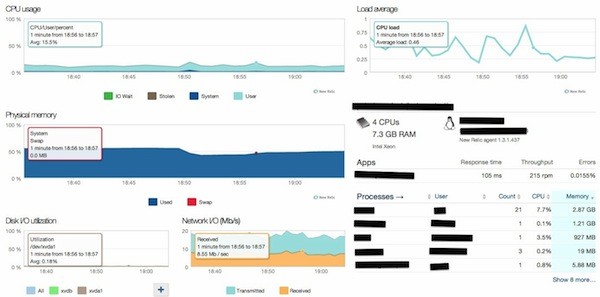
There are six main metrics here:
- CPU usage
- Memory usage
- Disk IO utilization
- Network IO
- Load average
- Process List
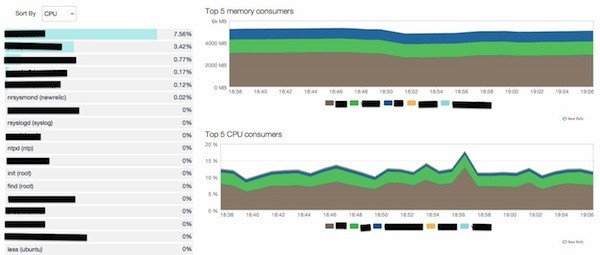
This will give you a quick overview of a particular server. You can drill down into each of the graphs to get more information. For example, you can drill down into the CPU graph to see which processes are using the CPU:
Or you can drill down into the disk graph to see your IO rate, a breakdown of reads and writes, as well as get an estimate of how long it will be before your disk is full.
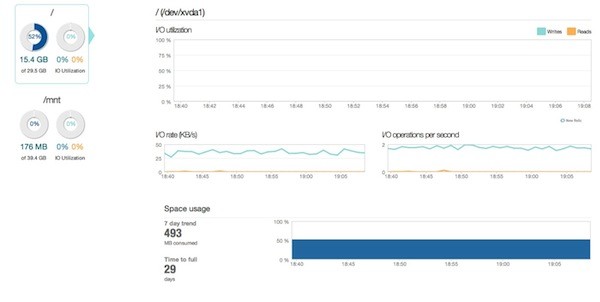
The best part is you can use the same operations on all these graphs as you can on application-level graphs. So, you can zoom in on a five minute window to look at a CPU usage spike more closely, or you can have a look at a seven day trend in memory usage.
The best part is, the graphs are simple to understand, you're not overwhelmed with metrics and you can compare similar boxes to each other. This can help you diagnose 99% of common problems you're likely to encounter with your infrastructure.
Setting up Server Monitoring Alerts
New Relic has recently done a lot of work to improve their alerting capabilities. Alert policies is what they've come up with across their whole system (e.g. there are application alert policies for application and server alert policies for boxes). It may be a little confusing at first, but it is pretty simple once you get the hang of it. There are two main concepts, policies and channels. In terms of server alerts, it works like this:
We set up a policy and assign some servers to it:
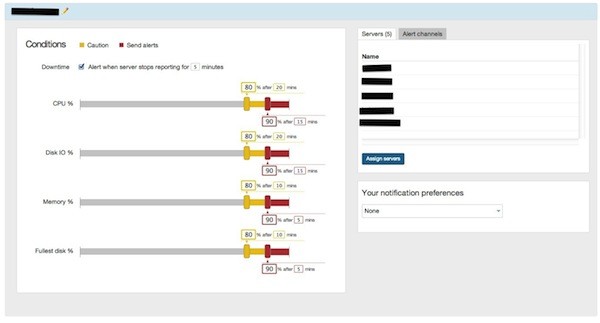
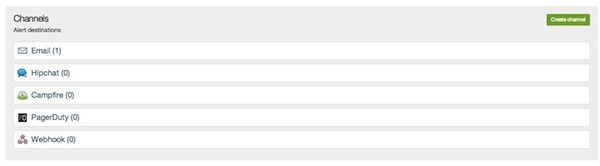
You also create a channel (e.g. email, webhook) to which alerts can be sent:
You then assign a channel to a policy. From that point on, depending on the settings for the channel (e.g. first critical event, all critical events, downtime only). You will get notifications on that channel.
The only confusing bit about alert policies is where to find them. They live under Tools->Alert Policies:
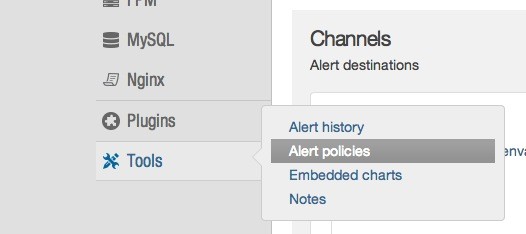
You then need to click on Servers in the menu at the top, to find server alert policies.
Conclusion
If you're already using an infrastructure monitoring solution like Nagios and it's working well for you, then you may not get too much extra from New Relic server monitoring (although the graphs and historical trends are pretty excellent). However, if you're not monitoring your infrastructure at all or your current solution isn't working for you, definitely give New Relic a try. For me, it has become the first tool I go to when I suspect that something is wrong with my servers. And often enough, it will let me know that trouble is brewing before the situation becomes critical. As developers, that's the kind of tools we all want in our arsenal.

Comments