When you first get introduced to New Relic, it's easy to be overwhelmed by all the features. But like with most tools, as you slowly climb the learning curve and get familiar with the features provided out of the box, you begin to wonder how it all hangs together under the hood and if there is more you can do with what you have at hand.
Today I will look at how New Relic actually monitors transactions and how you can hook into the process. We will take a quick glance at the support provided by New Relic for monitoring background jobs and we'll also dig into New Relic custom metrics, how you would use them and the benefits you get from doing so. By the end you will have a deeper understanding of how New Relic works and be able to utilize it more fully. In other words, we will have a deeper knowledge of our tools—something every developer should strive for.
Let's begin by taking a quick look at how New Relic actually hooks-in to track the performance of your application.
This content was commissioned by New Relic and was written and/or edited by the Tuts+ team. Our aim with sponsored content is to publish relevant and objective tutorials, case studies, and inspirational interviews that offer genuine educational value to our readers and enable us to fund the creation of more useful content.
How New Relic Tracks Transactions and How You Can Do the Same
It may seem a little like magic, you include a gem in your Gemfile:
gem 'newrelic_rpm'
And somehow New Relic monitors all your code. Of course it is just code, so let's see how New Relic actually instruments your app so it can begin monitoring it when the agent gem is required. We will do this in the context of a Rails 4 app.
The first place to look is newrelic_rpm.rb, which has the following relevant code in it:
...
if Rails::VERSION::MAJOR.to_i >= 3
  module NewRelic
    class Railtie < Rails::Railtie

      initializer "newrelic_rpm.start_plugin" do |app|
        NewRelic::Control.instance.init_plugin(:config => app.config)
      end
    end
  end
else
...
So a Railtie gets created when the Rails version is above three, this gets a NewRelic::Control singleton instance (when it is initialized) and calls init_plugin. When the NewRelic::Control instance is created it figures out what framework is running (Rails 4 in our case) and loads some relevant code; we can see this in new_relic/control/class_methods#load_framework_class. The init_plugin method that gets executed lives in new_relic/control/instance_methods. The interesting code here is:
...
if Agent.config[:agent_enabled] && !NewRelic::Agent.instance.started?
  start_agent
  install_instrumentation
  load_samplers unless Agent.config[:disable_samplers]
...
The install_instrumentation call is the important one. The implementation lives in new_relic/control/instrumentation. Skipping over the boilerplate bits, this works out which instrumentation files it needs to load and then requires them one by one. In our case, it will load files under new_relic/agent/instrumentation/rails4. One of the files here is action_controller.rb, when this gets required it eventually executes the following code via some metaprogramming magic:
executes do
  class ActionController::Base
    include NewRelic::Agent::Instrumentation::ControllerInstrumentation
    include NewRelic::Agent::Instrumentation::Rails4::ActionController
  end
  NewRelic::Agent::Instrumentation::ActionControllerSubscriber \
    .subscribe(/^process_action.action_controller$/)
end
And here we get to the crux of it: ActionController::Base (from which all your controllers inherit) gets a couple of modules included in it, the most important of which is NewRelic::Agent::Instrumentation::ControllerInstrumentation. This is the start of how New Relic begins to monitor all your controller actions as 'transactions'. Of course, it's a somewhat simplified view and we're glossing over a lot of detail, but it gives you an idea of how New Relic monitors your code. The question is, how can you use this information?
Monitoring Custom Frameworks & Background Jobs
You're highly unlikely to find yourself in a situation where you're using a web framework that New Relic does not already have instrumentation for (in the Ruby world), but let's say you did. Knowing what we know now, we can easily manually instrument the controller actions of this custom framework. If we have a controller like this:
class CustomController
  def custom_action
    ...
  end
end
We can instrument it like so:
class CustomController
  include NewRelic::Agent::Instrumentation::ControllerInstrumentation

  def custom_action
    ...
  end
  add_transaction_tracer :custom_action
end
Now your controller method will be tracked like a transaction in the same way Rails actions get tracked. Of course, if you've rolled your own web framework which includes database handling code, you will need to do extra work to instrument much of that code, to allow New Relic to monitor more than just controller actions. But the general idea remains sound.
The above pattern becomes more useful when you want New Relic to track background jobs in your application. You're a lot more likely to have rolled some custom background job handling code than you are to have written your own web framework. In fact, we did just this with Tuts+ initially, although we're now migrating to Sidekiq. If you're using one of the well-known background jobs systems like Sidekiq, Resque or Delayed Job, New Relic already has instrumentation built in, but if you did roll your own, the above pattern is all you need to monitor your tasks.
For example, our custom Tuts+ background jobs were regular ruby classes that responded to the execute method, so all we have to do is this:
class SomeBackgroundJob
  include NewRelic::Agent::Instrumentation::ControllerInstrumentation

  def execute
    ...
  end
  add_transaction_tracer :custom_action, category: :task
end
The last bit, category: :task, is to ensure that New Relic does not track it as a web transaction, but instead treats it as a background task and makes it appear under the background tasks tab in the New Relic UI. If we create a base class for all our jobs, we can put the instrumentation there and child classes will inherit it, so we don't have to worry about doing the above in every job class.
Customizing a Transaction Even More
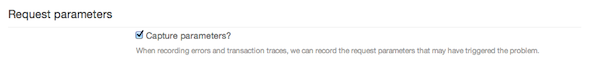
Interestingly enough, even the web transactions that New Relic automatically monitors are not sacrosanct. You can, for example, add some custom parameters to be sent to New Relic for the transaction that is currently executing (if you've switched on capturing parameters).
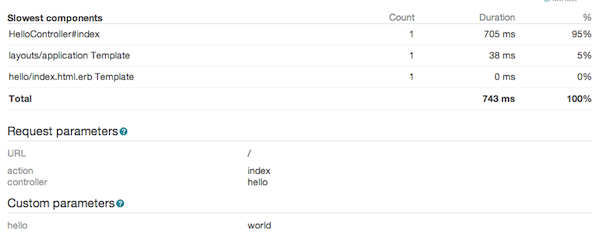
You can do this at any point during the transaction. All you have to do is call ::NewRelic::Agent.add_custom_parameters(:key => 'value') at any time and the parameters you pass in will get added to the parameter data you see inside New Relic. For example, if we had a controller that looked like this:
class HelloController < ApplicationController
  def index
    ::NewRelic::Agent.add_custom_parameters(:hello => 'world')
  end
end
Slow transactions would give us the following:
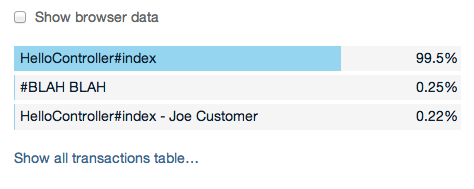
This isn't all we can do. We can segment a transaction while it's running by renaming it. Let's say we want to treat a transaction as special when it is performed by a particular user. You may do something like this:
class HelloController < ApplicationController
  def index
    new_relic_name = NewRelic::Agent.get_transaction_name
    if current_user.name == 'Joe Customer'
      NewRelic::Agent.set_transaction_name("#{new_relic_name} - Joe Customer")
    end
  end
end
Now this transaction will be treated as a separate transaction in the New Relic UI:
Even default New Relic instrumentation has some room for customization, but sometimes, just like Captain Kirk, you just need more power. This is where custom metrics come in.
New Relic Custom Metrics & How They Are Useful
Back in the day, you would have used custom metrics to monitor things like external service communication and use of various common tools like Redis. These days, New Relic has better ways of monitoring that stuff, so what do we need custom metrics for? I've found custom metrics to be useful in four situations:
- monitoring code that New Relic can't see
- monitoring code you don't control
- monitoring scripts
- monitoring totally custom events
Let's take a quick look at each of them.
Monitoring Code New Relic Can't See
New Relic is pretty good at breaking down the performance of your various application methods in a transaction trace, but sometimes you will see something like this in a trace:
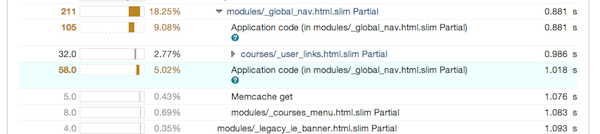
It seems there is application code that New Relic couldn't instrument for some reason. What we can do is help New Relic (and ourselves) out with some custom metrics. We need to figure out which method New Relic had trouble monitoring and hook in some custom metrics to track how long this method took to execute. This will then appear in all subsequent traces. Let's say we have a class with a method we want to monitor via custom metrics:
class Order
  def amount
    ...
  end
end
We can begin to track the amount method like so:
require 'new_relic/agent/method_tracer'

class Order
  include ::NewRelic::Agent::MethodTracer

  def amount
    ...
  end
  add_method_tracer :amount, 'Custom/amount'
end
The second parameter to add_method_tracer is the name that this custom metric will get in the New Relic UI. Metric names are slash separated strings and all custom metrics should start with 'Custom/'. You could, for example, name your custom metric as 'Custom/<class_name>/<method_name>'. At this point you will begin seeing the amount method in your transaction traces, in the New Relic UI. But, what if our amount method is highly complex and we want to monitor parts of it which we suspect are slow? My advice is that you should refactor your method—it's too big, but if you can't do that, you can instrument random code like so:
class Order
  extend ::NewRelic::Agent::MethodTracer

  def amount
    ...
    self.class.trace_execution_scoped(['Custom/amount/complex_code']) do
      ...complex code...
    end
    ...
  end
end
Now the instrumented part of the method will be reported separately in your transaction traces. If you've previously instrumented the method itself, your new 'inner' metric will be grouped under the previous one.
This is by far the most common way you'll end up using custom metrics in your code, but let's look at the others anyway.
Monitoring Code You Don't Control
Often you may be using a library which, you suspect, is slowing down your application. New Relic won't instrument any random gem for you by default, so what can you do? You can fork the gem and add some instrumentation using the method we saw above, but an even simpler solution exists—use initializers. Let's say you're using the foobar library which has a class Foo with a method bar that you suspect has some slow code in it. All you need to do is create an initializer foobar_instrumentation.rb, and put the following in it:
require 'new_relic/agent/method_tracer'

Foo.class_eval do
  include ::NewRelic::Agent::MethodTracer

  add_method_tracer :bar
end
As you can see the code is very similar to what we had above, New Relic will work out a sensible name for your new custom metric based on the class and method name and you will begin to see it in your transaction traces. Use this to work out if that suspicious library is actually making your code perform badly, but don't keep this instrumentation around permanently. It spams unnecessary initializers in your Rails app and pollutes your New Relic UI with custom metrics that you don't really need to track permanently.
Monitoring Scripts
One part of web applications that is often neglected is scripts. To paraphrase a presentation I did recently—they're still production code and should be treated as such. You don't want production code to be performing badly, especially if you execute it on an ongoing basis via cron jobs (or a similar method that is not a background job in your system), so we can use New Relic to figure out if your scripts are slow.
You may instrument your script code using custom metrics as described above. It won't show up in transaction traces as it won't be part of a transaction. What you will be able to do though, is create a custom dashboard from the metrics you collect which should give you an idea if your script is performing badly.
The other thing you can do is to treat your script as a type of background job and instrument it accordingly (include NewRelic::Agent::Instrumentation::ControllerInstrumentation and so on). It will get lumped together with other background jobs in the UI, but you don't have to worry about custom dashboards.
The only caveat with scripts is this: New Relic only sends data over the wire periodically. With a one-off script that executes quickly you will need to ensure that the collected data actually gets sent, so you may need to shut down the New Relic agent manually. A good rule of thumb is to manually start the agent at the beginning of each script and to shut it down at the end:
require 'newrelic_rpm'

::NewRelic::Agent.manual_start

... codez ...

::NewRelic::Agent.shutdown
This way you won't ever need to wonder why your data is not appearing in the UI.
Monitoring Totally Custom Events
One of the interesting things about New Relic is that it lets you take advantage of its UI and data aggregation facilities for metrics that have nothing to do with performance (in theory). For example, you may want to have some visibility on how often users sign up to your application, the frequency of sales, or the total amount users pay when they make purchases. These are more business metrics than performance ones, but if it's too much trouble to track these separately you can use New Relic to do so.
New Relic lets you record custom metrics directly via two API calls:
record_metricincrement_metric
You can use record_metric to track any metric that has an amount and increment_metric is pretty self explanatory. So we may, for example, do this:
...
def purchase(amount)
...
  ::NewRelic::Agent.record_metric('Custom/purchase_amount', amount)
  ::NewRelic::Agent.increment_metric('Custom/purchase_count')
...
end
...
The only way for you to see these metrics in the UI would be to create some custom dashboards. I have to mention that this would be a somewhat "creative" use of the New Relic API as it's designed with performance data in mind, but it is certainly a handy thing to know when you need to throw a quick dashboard together and don't want to set up a bunch of extra infrastructure.
The Dangers of Monitoring Too Much
Of course, all this power has a cost. If you collect too many custom metrics, it can begin to slow down your application. It can also slow down the New Relic UI and make it difficult to interpret the data as New Relic will collapse similar metrics into a summary one. New Relic recommends keeping the number of custom metrics you collect below 2000. I have found that custom metrics are best used periodically. Instrument the code you need, use the instrumentation to solve the problem you're having and then remove the instrumentation. This way you get to solve your performance issues and the number of custom metrics you use is unlikely to grow too high.
Conclusion
We've dug into the internals of the newrelic_rpm gem and have learned how to tell New Relic about code that you consider a web transaction. We've looked at how to alter transactions on the fly, how to monitor background jobs and the various situations where it makes sense to use custom metrics. There is much you can do with New Relic beyond the functionality it provides out of the box and you're now much more able to utilize it to its full potential. But, there is always more to learn, like how to build custom dashboards out of the metrics that you capture, or how to monitor infrastructure with plugins. We'll be covering those topics and more in subsequent articles, so make sure to check back often. And as always if you have a question, want to share your own New Relic story or just want to say hi, don't forget to leave a comment.

Comments