Recall that all widget providers have to implement
Provider interface. They also have to sit inside folder named widget, and under the namespace AX\StatBoard\Widget. If we want to add a new kind of metric, just create a corresponding class, and create an object and add it to Widget class with the add_provider method.RAM Usage Widget
One of the first pieces of information we want to display is how much RAM is currently being used and how much is currently free.
In this case, free -m is our friend - it tells us RAM usage. the -m switch is to output the result in megabytes.
[vagrant@vagrant-centos64 ~]$ free -m
             total       used       free     shared    buffers     cached
Mem:           589        366        223          0          9         57
-/+ buffers/cache:        299        290
Swap:            0          0          0
We will name the class is Ram. The corresponding file will be widget/ram.php. We just compose the basic and implement get_title here.
<?php
namespace AX\StatBoard\Widget;

class Ram implements Provider {
  function __construct() {
  }

  public function get_title() {
    return "Ram Usage";
  }

?>
Next, we will implement get_metric to actually run the necessary shell command and pull out the information. I will explain more detail of get_metric later.<?php
function get_metric() {
$df = `free -m | grep -E "(Mem|Swap)" | awk '{print $1, $2, $3, $4}'`;
$df = explode("\n", $df);
if ( is_array( $df ) && 2 <= count( $df ) ) {
$df = array_map( function ( $line ) {
if ( empty( $line ) ) {
return;
}
$segment = preg_split( '/\s+/', $line );
return array(
'type' => trim( $segment[0]," :" ),
'total' => (int)$segment[1],
'used' => (int)$segment[2],
'free' => (int)$segment[3],
);
}, $df );
return $df;
}
return false;
}
?>
We execute the command free -m | grep -E "Mem|Swap" | awk '{print $1, $2, $3, $4}'. Its output looks similar to this.[vagrant@vagrant-centos64 ~]$ free -m | grep -E "Mem|Swap" | awk '{print $1, $2, $3, $4}'
Mem: 589 541 47
Swap: 255 0 255
[vagrant@vagrant-centos64 ~]$We parse each bit of information with PHP by splitting the lines into an array. We use array_map to loop over all element of array and for each of line, we split by spaces, then return an associative array with elements:-
type: first field
-
total: second field
-
used: third field -
free: forth field
get_content. public function get_content() {
$metric = $this->get_metric();
$data = array(
array('Type', 'Used(MB)', 'Free(MB)')
);
foreach ($metric as $item) {
if (empty($item)) {
continue;
}
if ($item['type'] !== 'Mem' && $item['type'] !== 'Swap') {
continue;
}
if ( 0 == ($item['free'] + $item['used'])) {
continue;
}
$data[] = array(
$item['type'],$item['used'], $item['free']
);
}
$data = json_encode($data);
echo <<<EOD
<div id="widget_ram_usage"></div>
<script type="text/javascript">
google.setOnLoadCallback(function () {
var data = google.visualization.arrayToDataTable({$data});
var options = {
isStacked: true
};
var chart = new google.visualization.ColumnChart(document.getElementById('widget_ram_usage'));
chart.draw(data, options);
})
</script>
EOD;
}We used stacked bar chart to display the RAM usage. get_metric() to get the necessary data. Then, we just loop over it and format it to match Google chart data requirement. Finally, we use json_encode to convert them into a JavaScript object notation (or JSON). Then, we output a HTML code that contains a div element to hold the chart object. div element.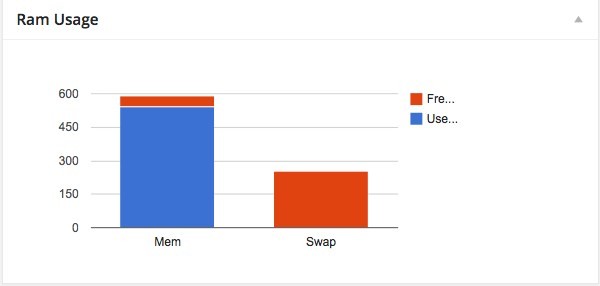
Installed Software
The second widget we will cover is one that will display installed software. It's a widget that's intended to show what common packages we have on server and which version. widget/software.php with this initial content:<?php
namespace AX\StatBoard\Widget;
class Software implements Provider {
function __construct() {
}
public function get_title() {
return "Installed Software";
}
function get_metric() {
$cmds = array();
$package = array(
'php' => '-v',
'node' => '-v',
'mysql' => '-V',
'vim' => '--version',
'python' => '-V',
'ruby' => '-v',
'java' => '-version',
'curl' => '-V');
foreach ( $package as $cmd=>$version_query ) {
if ( NULL == $cmds[$cmd] = shell_exec( "which $cmd" ) ) {
$cmds[ $cmd ] = 'Not installed';
continue;
}
$version = shell_exec( "$cmd $version_query" );
$version = explode( "\n", $version );
if ( is_array( $version ) ) {
$version = array_shift( $version );
}
$cmds[ $cmd ] .= '<br>' . $version;
}
return $cmds;
}
So, as always, we have the get_title and it just return a simple string. For the get_metric(), we want to know if particular piece of software is installed or not. If so, then get its version information. php -v shows version information, mysql --version shows MySQL information. shell_exec returns false if the command returns and error or the command is not found. In that case, we can determine that the software isn't installed; otherwise, we can parse the result to show the version information. Then, we split the result line-by-line, and retrieve the first line as version information. That's because the information we need is found only on the first line. get_content method. public function get_content() {
$cmds = $this->get_metric();
$content = '';
foreach ( $cmds as $cmd => $info ) {
$content .= "<p><strong>$cmd</strong> $info</p>";
}
echo $content;
}We just show a basic table for this kind of data. Here is out dashboard when showing up: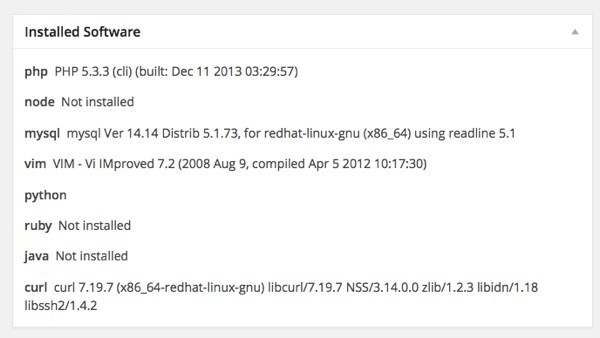
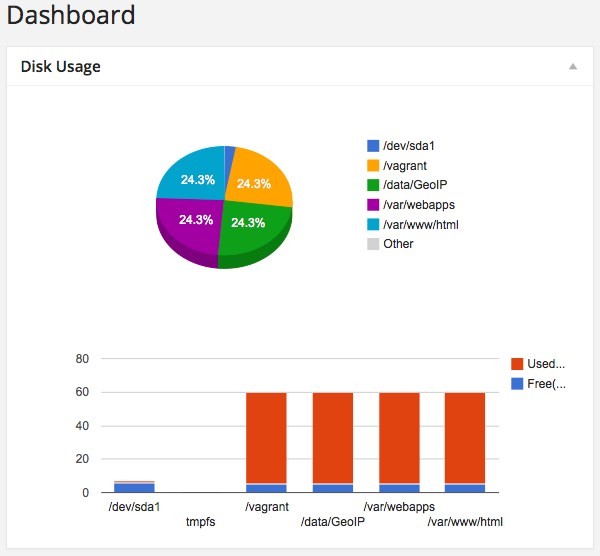
Disk Usage
Now we'll tackle disk usage. We name the class that handles this task Disk. Let's craft basic skeleton first.
<?php
namespace AX\StatBoard\Widget;

class Disk implements Provider {
  function __construct() {
  }
  public function get_title() {
    return "Disk Usage";
  }
}
As always, we have to implement Provider interface. We set a title for our widget here. Next is the heart of our class: The method for getting disk usage.<?php
function get_metric() {
$df = `df -h`;
$df = explode("\n", $df);
if (is_array($df) && count($df)>=2) {
array_shift($df); //Get rid the first line
$df = array_map(function ($line) {
if (empty($line)) {
return NULL;
}
$segment=preg_split('/\s+/', $line);
return array(
'filesystem' => $segment[0],
'size' => $segment[1],
'used' => $segment[2],
'available' => $segment[3],
'use_percent' => $segment[4],
);
}, $df);
return $df;
}
return false;
}In the first part of this series, we gained some insight with the df command so understanding the following command should be easy: df output:[vagrant@vagrant-centos64 ~]$ df -h Filesystem Size Used Avail Use% Mounted on /dev/sda1 7.3G 1.4G 5.6G 20% / tmpfs 295M 0 295M 0% /dev/shm /vagrant 60G 55G 4.9G 92% /vagrant /data/GeoIP 60G 55G 4.9G 92% /data/GeoIP /var/webapps 60G 55G 4.9G 92% /var/webapps /var/www/html 60G 55G 4.9G 92% /var/www/htmlWe split it line-by-line to turn it into an array. We loop through every line, split whole line by spaces to again turn it into an array. Then, we just map the value to have a more friendly, human readable associative array. When we have this data, we can put it into
get_content. public function get_content() {
$metric = $this->get_metric();
$data = array(
array( 'Disk', 'Space' )
);
$disk_container = array();
$data_partition = array(
array('Filesystem', 'Free(GB)', 'Used(GB)')
);
foreach ( $metric as $disk ) {
$size = intval( $disk['size'] );
if ( 'M' == substr( $disk['size'], -1 ) ) {
$size = round( $size / 1024, 2 );
}
$used = intval( $disk['used'] );
if ('M' == substr( $disk['used'], -1 ) ) {
$used = round( $used / 1024, 2 );
}
if ( empty( $size ) ) {
continue;
}
$data[] = array( $disk['filesystem'], $size );
$data_partition[] = array($disk['filesystem'], $size - $used, $used);
}
}
We loop through over the metric array and try to convert the space in MB to GB. We build an array to match the chart data format requirement. The data array should looks like:[Once we have the data, we start to render the charts. We will make two charts:
['File System', 'Free', 'Used', ['/dev/sda1', 10, 24], ['/dev/sda2', 28, 19]
]
- The first chart is for the space of each mounted file system on the total. For this data, we will be using a pie chart.
- The second chart is for displaying the disk usage of each individual mounted file system. For this, we'll be using a bar chart.
To that end, let's modify our method to the following:
  public function get_content() {
    $metric = $this->get_metric();
    $data = array(
      array('Disk', 'Space')
    );

    $disk_container = array();
    $data_partition = array(
      array('Filesystem', 'Free(GB)', 'Used(GB)')
    );
    foreach ($metric as $disk) {
      $size = intval($disk['size']);
      if ('M' == substr($disk['size'], -1)) {
        $size = round($size / 1024, 2);
      }
      $used = intval($disk['used']);
      if ('M' == substr($disk['used'], -1)) {
        $used = round($used / 1024, 2);
      }

      if (empty($size)) {
        continue;
      }
      $data[] = array($disk['filesystem'], $size);
      $data_partition[] = array($disk['filesystem'], $size - $used, $used);
    }
    $data = json_encode($data);
    $data_partition = json_encode($data_partition);

    echo <<<EOD
      <div id="widget_disk_usage"></div>
      <div id="widget_disk_partion"></div>
      <script type="text/javascript">
      google.load("visualization", "1", {packages:["corechart"]});
      google.setOnLoadCallback(function () {
        var data = google.visualization.arrayToDataTable({$data});
        var options = {
          is3D: true,
        };
        var chart = new google.visualization.PieChart(document.getElementById('widget_disk_usage'));
        chart.draw(data, options);

        var data2 = google.visualization.arrayToDataTable({$data_partition});
        var options2 = {
          isStacked: true
        };
        var chart2 = new google.visualization.ColumnChart(document.getElementById('widget_disk_partion'));
        chart2.draw(data2, options2);

      })
    </script>
EOD;
  }
We created two div elements to contain the informationThen the chart is then rendered inside those element with draw method of chart API. The most confusing thing here could be data format for our chart.
      <div id="widget_disk_usage"></div>
      <div id="widget_disk_partion"></div>
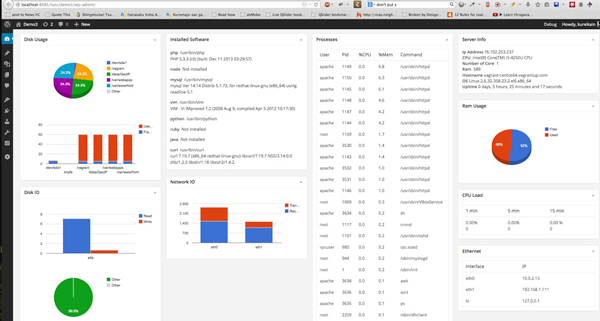
Server Information
This widget shows us the information: Linux kernel, CPU architecture, Up time, IP Address. We don't need a chart here, a simple data table do the job. Calling the class is Server. Here is out first content for widget/server.php
<?php
namespace AX\StatBoard\Widget;
use DateTime;

class Server implements Provider {
  function __construct() {
  }

  public function get_title() {
    return "Server Info";
  }

  /**
   * Return server info: OS, Kernel, Uptime, and hostname
   * @return array with 3 metric:
   *          * hostname
   *          * os
   *          * uptime
   */
  function get_metric() {
    $server = array();
    $server['hostname'] = `hostname`;
    $server['os']       = `uname -sr`;
    $server['core']     = `grep -c ^processor /proc/cpuinfo`;
    $total_uptime_sec = time() - `cut -d. -f1 /proc/uptime`;

    $now = new DateTime("now");
    $server['uptime'] = $now->diff(new DateTime("@$total_uptime_sec"))->format('%a days, %h hours, %i minutes and %s seconds');

    // Get the external ip with ifconfig.me, a website that show you ip address in plaintext
    // when sending request with curl header
    $server['ip'] = `curl ifconfig.me`;
    $server['ram'] = `free -m | grep Mem | awk '{print $2}'`;
    $server['cpu'] =`cat /proc/cpuinfo | grep "model name" | awk '{print $4,$5,$6,$7}'`;

    return $server;
  }

}
By this point, you should be familiar with get_title(). We just return the title of this widget.use DateTime because we are inside the namespace AX\StatBoard\Widget and the DateTime class is from the global namespace. Every time we want to use DateTime we have to type \DateTime. So we use namespace importing to make DateTime name available inside our current name space. get_metric we run shell command to get result and just assign it back.hostname
Show your server hostname.
uname -sr
Show Linux kernel information:
[vagrant@vagrant-centos64 ~]$ uname -sr
Linux 2.6.32-358.23.2.el6.x86_64
grep -c ^processor /proc/cpuinfo
-c switch prints a count of matching line in the input string. /proc/cpuinfo contains processor information. We grep it and count the occurrence of the word processor. Here is my result with 32 cores.
$ grep -c ^processor /proc/cpuinfo
32
cut -d. -f1 /proc/uptime
This command shows how many seconds the server has been up and running. We convert that numbers of second into a format of "x day y hour z minute" to make it more user-friendly.
Using DateTime::diff we can achieve this easily. We create a DateTime object with current timestamp and another one with the timestamp is the current timestamp minus the numbers of second of uptime. Then using format method to format it to a human friendly string.
Here is my result with the uptime of 26194091 seconds.
$ cut -d. -f1 /proc/uptime
26194091
curl ifconfig.me
ifconfig.me is a service that shows your IP address when visiting directly inside a browser. If you send it a request with curl, it returns your IP address as a single string.
[vagrant@vagrant-centos64 ~]$ curl ifconfig.me
76.102.253.237
CPU Model
As mentioning above,/proc/cpuinfo stores CPU information. We can extract the CPU model from it. For example:[vagrant@vagrant-centos64 ~]$ cat /proc/cpuinfo | grep "model name" | awk '{print $4,$5,$6,$7}'
Intel(R) Core(TM) i5-4250U CPUOnce we have all the data available in an array, we return it and feed the get_content method these piece of data. Here is out get_content, just showing the data: public function get_content() {
$server = $this->get_metric();
echo <<<EOD
<strong>Ip Address</strong> {$server['ip']}<br>
<strong>CPU</strong> {$server['cpu']}<br>
<strong>Number of Core</strong> {$server['core']}<br>
<strong>Ram</strong> {$server['ram']}<br>
<strong>Hostname</strong> {$server['hostname']}<br>
<strong>OS</strong> {$server['os']}<br>
<strong>Uptime</strong> {$server['uptime']}<br>
EOD;
}Here is our widget on dashboard.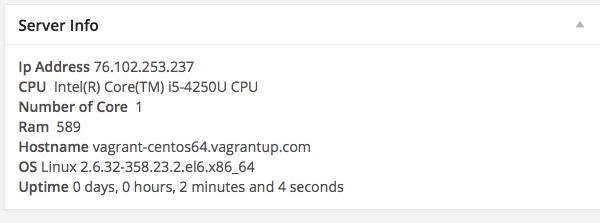
Processor
Monitoring our processor is one of the most important things we can display. We want to know how much of the CPU is being used and/or the amount of memory a particular process is consuming. We call our classProcess, starting with get_title and get_metric first. I will explain more detail of get_metric after the code:<?php
namespace AX\StatBoard\Widget;
class Process implements Provider {
public function get_title() {
return "Processes";
}
/**
* Return server info: OS, Kernel, Uptime, and hostname
* @return array with 3 metric:
* * hostname
* * os
* * uptime
*/
function get_metric() {
$processes = array();
$output = `ps -eo pcpu,pmem,pid,user,args,time,start | grep -v '\[' | sort -k 1 -r | head -30 | awk '{print $4,$3,$1,$2,$7,$6,$5}'`;
$output = explode("\n", $output);
if (!is_array($output) || count($output)<2) {
return false;
}
array_shift($output);
foreach ($output as $line) {
//$line = preg_split('/\s+/', $line);
$line = explode(' ', $line);
if (count($line)<6) {
continue;
}
//var_dump($line);
//echo count($line);
if (empty($processes[$line[6]])) {
$processes[$line[6]] = array_combine(array('user', 'pid', '%cpu', '%mem','start','time', 'command'), $line);
} else {
$processes[$line[6]]['%cpu'] += $line[2];
$processes[$line[6]]['%mem'] += $line[3];
}
}
return $processes;
}
}
The command that shows us process is running is ps. It gives an extensive information with the switch -e as it allows us to see every process. For our widget, we only need to pull our COU, memory, PID, users, args, time and start. -o mean user-defined format like: ps -eo pcpu,pmem,pid,user,args,time,start. If you try out that command, you will get some of weird process like:[vagrant@vagrant-centos64 ~]$ ps -eo pcpu,pmem,pid,user,args,time,start %CPU %MEM PID USER COMMAND TIME STARTED 0.0 0.2 1 root /sbin/init 00:00:00 06:50:39 0.0 0.0 2 root [kthreadd] 00:00:00 06:50:39 0.0 0.0 3 root [migration/0] 00:00:00 06:50:39Notice the [kthread], [migration/0]. Basically, this means the command can not be located in file system. It could be some internal system process or kernel thread and we may not never want to care about it. Therefore, we should eliminate those process with
grep. grep has -v switch enable us to to invert matching. It return the result that doesn't contain the string we pass to it.[vagrant@vagrant-centos64 ~]$ ps -eo pcpu,pmem,pid,user,args,time,start | grep -v '\[' %CPU %MEM PID USER COMMAND TIME STARTED 0.0 0.2 1 root /sbin/init 00:00:00 06:50:39 0.0 0.1 292 root /sbin/udevd -d 00:00:00 06:50:41 0.0 0.1 811 root /sbin/dhclient -H vagrant-c 00:00:00 06:50:48 0.0 0.2 948 root /sbin/rsyslogd -i /var/run/ 00:00:00 06:50:50 0.0 0.1 966 rpc rpcbind 00:00:00 06:50:50 0.0 0.2 984 rpcuser rpc.statd 00:00:00 06:50:50 0.0 0.0 1011 root rpc.idmapd 00:00:00 06:50:51 0.0 0.2 1073 root /usr/sbin/VBoxService 00:00:00 06:50:51To make the data looks good, we should sort the process by memory or CPU. In our tutorial, let's sort by
%MEM. We can do that with sort command of Linux. And %MEM is the second column. sort -k 1. It sorts lowest to highest. We actually care about the process that's consuming lot memory first. To that end, we should reverse the order with sort -k 1 -r. Once we got the result, we may only need the first 30 processes. Of course, it depends on you as you can choose to include everything, but I want to keep it short. 30 sounds like a reasonable number. [vagrant@vagrant-centos64 ~]$ ps -eo pcpu,pmem,pid,user,args,time,start | grep -v '\[' | sort -k 1 | head -30 | awk '{print $4,$3,$1,$2,$7,$6,$5}'
root 1151 0.0 0.0 00:00:00 -d /sbin/udevd
root 1152 0.0 0.0 00:00:00 -d /sbin/udevd
root 292 0.0 0.0 00:00:00 -d /sbin/udevd
root 811 0.0 0.0 vagrant-c -H /sbin/dhclient
root 1 0.0 0.1 06:50:39 00:00:00 /sbin/init
root 2153 0.0 0.1 -q -1 /sbin/dhclient
root 3642 0.0 0.1 00:00:00 -s /usr/sbin/anacron
vagrant 3808 0.0 0.1 pcpu,pmem,pid,user,a -eo ps
vagrant 3810 0.0 0.1 1 -k sort
vagrant 3811 0.0 0.1 00:00:00 -30 head
vagrant 3812 0.0 0.1 $4,$3,$1,$2,$7,$ {print awk
root 948 0.0 0.1 /var/run/ -i /sbin/rsyslogd
rpc 966 0.0 0.1 06:50:50 00:00:00 rpcbind
root 1073 0.0 0.2 06:50:51 00:00:00 /usr/sbin/VBoxService
root 1105 0.0 0.2 06:50:51 00:00:00 /usr/sbin/sshd
root 1121 0.0 0.2 06:50:52 00:00:00 crond
rpcuser 984 0.0 0.2 06:50:50 00:00:00 rpc.statd
496 1088 0.0 0.3 -p -d memcached
vagrant 3544 0.0 0.3 00:00:00 vagrant@pts/0 sshd:
vagrant 3545 0.0 0.3 06:59:27 00:00:00 -bash
root 1113 0.0 1.7 06:50:52 00:00:00 /usr/sbin/httpd
apache 1157 0.0 4.2 06:50:53 00:00:01 /usr/sbin/httpd
apache 3438 0.0 4.2 06:55:39 00:00:01 /usr/sbin/httpdOnce we get the result back, we split it into an array and loop through it with foreach. We group same name process into an element and add up the CPU percent and memory into it.<?php
//...
// inside get_content
foreach ( $output as $line ) {
//$line = preg_split( '/\s+/', $line );
$line = explode( ' ', $line );
if ( 6 > count( $line ) ) {
continue;
}
if ( empty( $processes[ $line[6] ] ) ) {
$processes[ $line[6]] = array_combine( array( 'user', 'pid', '%cpu', '%mem','start','time', 'command' ), $line );
} else {
$processes[ $line[6] ]['%cpu'] += $line[2];
$processes[ $line[6] ]['%mem'] += $line[3];
}
}
//... We use array_combine to create an associative array from two arrays: one for keys and one for values. get_content method. Just a remind that we have to implement threes method: get_title, get_metric , and get_content. For the process, we only want to show a simple table. get_content method is straight forward. public function get_content() {
$processes = $this->get_metric();
$html = '<table class="wp-list-table widefat"><thead><tr>
<th>User</th>
<th>Pid</th>
<th>%CPU</th>
<th>%Mem</th>
<th>Command</th>
</tr></thead><tbody>';
foreach ($processes as $process) {
$html .= "<tr>
<td>{$process['user']}</td>
<td>{$process['pid']}</td>
<td>{$process['%cpu']}</td>
<td>{$process['%mem']}</td>
<td>{$process['command']}</td>
</tr>";
}
$html .= '</tbody></table>';
echo $html;
}And here is what we get: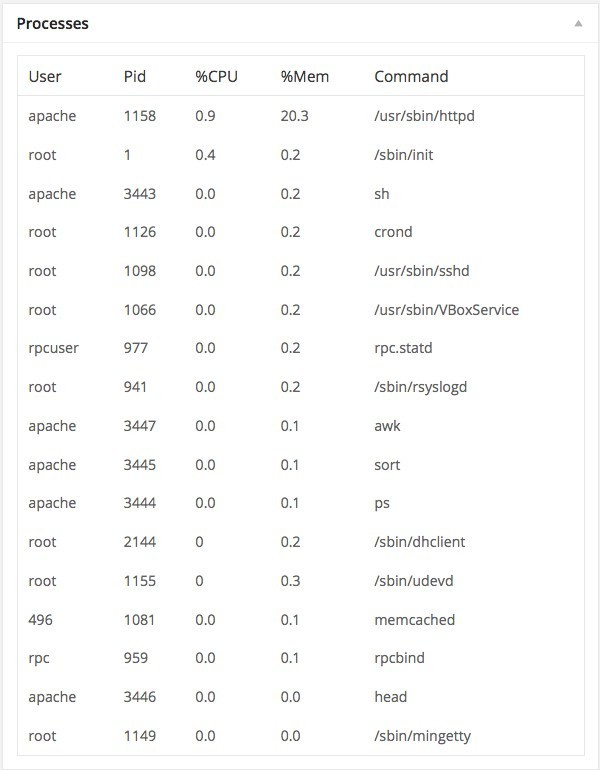
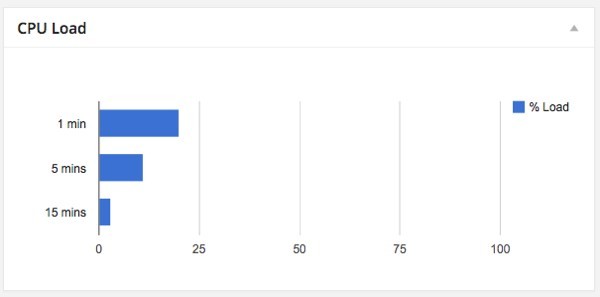
Average Load
Linux has a command that shows us the average load of CPU and IO in over the last minute, five minutes, and 15 minutes. Let crunch it into a widget. Call it Cpuload, and create our widget/cpuload.php<?php
namespace AX\StatBoard\Widget;
class Cpuload implements Provider {
function __construct() {
}
public function get_title() {
return "CPU Load";
}
function get_metric() {
$number_of_core = intval(`/bin/grep -c processor /proc/cpuinfo`);
$loadAvg = `cat /proc/loadavg | /usr/bin/awk '{print $1,$2,$3}'`;
$loadAvg = explode(' ', $loadAvg);
if ($loadAvg <3) {
return false;
}
$loadTimes = array('1 min', '5 mins', '15 mins');
return array_map(
function ($loadtime, $value, $number_of_core) {
return array($loadtime, round($value * 100 / $number_of_core, 2), $value);
},
$loadTimes,
$loadAvg,
array_fill(0, 3, $number_of_core)
);
}
}
The first thing is we count the number of CPU cores by reading /proc/cpuinfo and count the number of line contains the word "processor". We covered this in the section entitled Server Information./proc/loadavg hold average load information. The first three columns are the load of one minute, five minutes and 15 minutes, respectively. awk is used here to filter out only fields that we need.➜ ~ cat /proc/loadavg
0.01 0.04 0.05 1/217 16089
➜ ~ cat /proc/loadavg | awk '{print $1, $2, $3}'
0.01 0.04 0.05
The above result is split by spaces to build an array with three elements. The average load are calculated for all cores. So to to get the result, we loop through the $loadAvg array with array_map and divide with the number of cores we have. Note that we create 2 extra arrays with same length as the $loadAvg, one is for the key, another are to hold the number of core to pass all of the one by one to the callback of array_map. get_content: public function get_content() {
$metrics = $this->get_metric();
if ( ! $metrics ) {
return false;
}
// see https://google-developers.appspot.com/chart/interactive/docs/gallery/barchart#Data_Format for more detai of format
$data = array( array( 'Duration', '% Load' ) );
foreach ( $metrics as $key=>$metric ) {
array_push( $data, array( $metric[0], $metric[1] ) );
}
$data = json_encode( $data );
echo <<<EOD
<div id="avg_load"></div>
<script type="text/javascript">
google.load("visualization", "1", {packages:["corechart"]});
google.setOnLoadCallback(drawChart);
function drawChart() {
var data = google.visualization.arrayToDataTable($data);
var options = {
hAxis: {
titleTextStyle: {color: 'red'},
minValue:0,
maxValue:100
}
};
var chart = new google.visualization.BarChart(document.getElementById('avg_load'));
chart.draw(data, options);
}
</script>
EOD;
}We use bar chart and create a data array from our array, then using json_encode to turn it into a JavaScript notation array that match the data format of bar chart. [Here is our result when the chart is rendered:
["Duration","% Load"],
["1 min",20],
["5 mins",11],
["15 mins",3]
]
Ethernet Interface
The next widget we will tackle is for the Ethernet interface. Some server can have multiple ethernet interfaces with different IP Addresses are assigned to them.
Seeing this information is very useful. Let's call this class Ethernet, start with this basic thing for widget/ethernet.php.
<?php
/**
 * Adopt from https://github.com/afaqurk/linux-dash/blob/master/sh/ip.php
 *
 */
namespace AX\StatBoard\Widget;

class Ethernet implements Provider {
  function __construct() {
  }

  public function get_title() {
    return "Ethernet";
  }

  function get_metric() {
    $ethernet = array();
    $output = shell_exec("ip -oneline link show | awk '{print $2}' | sed 's/://'");
    if (!$output) { // It didn't work with "ip" , so we do it with ifconfig
      $output = shell_exec(
        'ifconfig | /bin/grep -B1 "inet addr" | /usr/bin/awk \'' .
        '{ if ( $1 == "inet" ) { print $2 }' .
        'else if ( $2 == "Link" ) { printf "%s:",$1 } }\' | /usr/bin/awk' .
        ' -F: \'{ print $1","$3 }\''
      );
      $output = trim($output, " \n");
      $output = `ifconfig | grep "Link encap" | awk '{ print $1 }'`;
      $interfaces = explode("\n", $output);
      $output = `ifconfiga | grep "inet addr" | awk '{ print $2 }' | sed 's/addr://'`;
      $addreses = explode("\n", $output);
      $output = trim($output, " \n");
      return array_combine($interfaces, $addreses);
    }

    $output = trim($output, " \n");
    $interfaces = explode("\n", $output);
    $addreses = array();
    foreach ($interfaces as $interface) {
      $output = shell_exec("ip -oneline -family inet addr show $interface | awk '{print $4}' | cut -d'/' -f1");
      $addreses[] = $output;
    }
    return array_combine($interfaces, $addreses);
  }

}
So the title of widget will be Ethernet. For get_metric, we will try to get all ethernet interface names, then we get the IP address of each one, and combine the device name and IP address to return. ip instead of ifconfig; therefore, we should run ip first to get ethernet devices.$output = shell_exec("ip -oneline link show | awk '{print $2}' | sed 's/://'");
Using IP Utility
The ip command with -oneline will show output in only one line, where as link and show will list all devices. We use awk to get the second column, with the device names; however it contains the : char. We used sed to replace : with an empty string. [vagrant@vagrant-centos64 sbin]$ ip -oneline link show
1: lo: <LOOPBACK,UP,LOWER_UP> mtu 16436 qdisc noqueue state UNKNOWN \ link/loopback 00:00:00:00:00:00 brd 00:00:00:00:00:00
2: eth0: <BROADCAST,MULTICAST,UP,LOWER_UP> mtu 1500 qdisc pfifo_fast state UP qlen 1000\ link/ether 08:00:27:08:c2:e4 brd ff:ff:ff:ff:ff:ff
3: eth1: <BROADCAST,MULTICAST,UP,LOWER_UP> mtu 1500 qdisc pfifo_fast state UP qlen 1000\ link/ether 08:00:27:eb:11:e4 brd ff:ff:ff:ff:ff:ff
[vagrant@vagrant-centos64 sbin]$ ip -oneline link show | awk '{print $2}'
lo:
eth0:
eth1:
[vagrant@vagrant-centos64 sbin]$ ip -oneline link show | awk '{print $2}' | sed 's/://'
lo
eth0
eth1
[vagrant@vagrant-centos64 sbin]$If the shell_exec runs successfully, we proceed with the IP utility. The above output is split into an array line by line. $output = trim($output, " \n");
$interfaces = explode("\n", $output);
Then we loop through that array, and again use the ip command ip -oneline -family inet addr show device_name to get the IP address that is assigned to the device. $addreses = array();
foreach ($interfaces as $interface) {
$output = shell_exec("ip -oneline -family inet addr show $interface | awk '{print $4}' | cut -d'/' -f1");
$addreses[] = $output;
}
The IP address appears in column four, so awk is used to print out that value. Then we use cut to split the command by / and get the first element with swich -f1. [vagrant@vagrant-centos64 sbin]$ ip -oneline -family inet addr show eth1
3: eth1 inet 192.168.1.111/24 brd 192.168.1.255 scope global eth1
[vagrant@vagrant-centos64 sbin]$ ip -oneline -family inet addr show eth1 | awk '{print $4}'
192.168.1.111/24
[vagrant@vagrant-centos64 sbin]$ ip -oneline -family inet addr show eth1 | awk '{print $4}' | cut -d'/' -f1
192.168.1.111
[vagrant@vagrant-centos64 sbin]$When we got the device name in interfaces array and IP address in addresses array, we create an associative array with the interface name as key and IP address as value.return array_combine($interfaces, $addreses);
Servers Using ifconfig
In the case of ifconfig, theshell_exec of ip will return false. In that case, we run ifconfig instead. if (!$output) { // It didn't work with "ip" , so we do it with ifconfig
$output = `ifconfig | grep "Link encap" | awk '{ print $1 }'`;
$interfaces = explode("\n", $output);
$output = `ifconfig | grep "inet addr" | awk '{ print $2 }' | sed 's/addr://'`;
$addreses = explode("\n", $output);
$output = trim($output, " \n");
return array_combine($interfaces, $addreses);
}Let's run above command in terminal so we have an idea as to what's happening. ifconfig shows the IP address directly in the output, therefore we can just get them instead of running a loop over devices array and get IP address of each one.[vagrant@vagrant-centos64 sbin]$ ifconfig
eth0 Link encap:Ethernet HWaddr 08:00:27:08:C2:E4
inet addr:10.0.2.15 Bcast:10.0.2.255 Mask:255.255.255.0
inet6 addr: fe80::a00:27ff:fe08:c2e4/64 Scope:Link
UP BROADCAST RUNNING MULTICAST MTU:1500 Metric:1
RX packets:4230 errors:0 dropped:0 overruns:0 frame:0
TX packets:2575 errors:0 dropped:0 overruns:0 carrier:0
collisions:0 txqueuelen:1000
RX bytes:444488 (434.0 KiB) TX bytes:2288676 (2.1 MiB)
eth1 Link encap:Ethernet HWaddr 08:00:27:EB:11:E4
inet addr:192.168.1.111 Bcast:192.168.1.255 Mask:255.255.255.0
inet6 addr: fe80::a00:27ff:feeb:11e4/64 Scope:Link
UP BROADCAST RUNNING MULTICAST MTU:1500 Metric:1
RX packets:4470 errors:0 dropped:0 overruns:0 frame:0
TX packets:2449 errors:0 dropped:0 overruns:0 carrier:0
collisions:0 txqueuelen:1000
RX bytes:1689803 (1.6 MiB) TX bytes:271675 (265.3 KiB)
lo Link encap:Local Loopback
inet addr:127.0.0.1 Mask:255.0.0.0
inet6 addr: ::1/128 Scope:Host
UP LOOPBACK RUNNING MTU:16436 Metric:1
RX packets:264 errors:0 dropped:0 overruns:0 frame:0
TX packets:264 errors:0 dropped:0 overruns:0 carrier:0
collisions:0 txqueuelen:0
RX bytes:15840 (15.4 KiB) TX bytes:15840 (15.4 KiB)
[vagrant@vagrant-centos64 sbin]$ ifconfig | grep "Link encap"
eth0 Link encap:Ethernet HWaddr 08:00:27:08:C2:E4
eth1 Link encap:Ethernet HWaddr 08:00:27:EB:11:E4
lo Link encap:Local Loopback
[vagrant@vagrant-centos64 sbin]$ ifconfig | grep "Link encap" | awk '{ print $1 }'
eth0
eth1
lo
[vagrant@vagrant-centos64 sbin]$ ifconfig | grep "inet addr"
inet addr:10.0.2.15 Bcast:10.0.2.255 Mask:255.255.255.0
inet addr:192.168.1.111 Bcast:192.168.1.255 Mask:255.255.255.0
inet addr:127.0.0.1 Mask:255.0.0.0
[vagrant@vagrant-centos64 sbin]$ ifconfig | grep "inet addr" | awk '{ print $2 }'
addr:10.0.2.15
addr:192.168.1.111
addr:127.0.0.1
[vagrant@vagrant-centos64 sbin]$ ifconfig | grep "inet addr" | awk '{ print $2 }' | sed 's/addr://'
10.0.2.15
192.168.1.111
127.0.0.1
[vagrant@vagrant-centos64 sbin]$Once we have the data, putting them in get_content is easy because we just show a simple table here. public function get_content() {
$interfaces = $this->get_metric();
$html = '<table class="wp-list-table widefat"><thead><tr>
<th>Interface</th>
<th>IP</th>
</tr></thead><tbody>';
foreach ( $interfaces as $interface => $ip ) {
$html .= "<tr>
<td>{$interface}</td>
<td>{$ip}</td>
</tr>";
}
$html .= '</tbody></table>';
echo $html;
}Here is how it shows up to the administrator: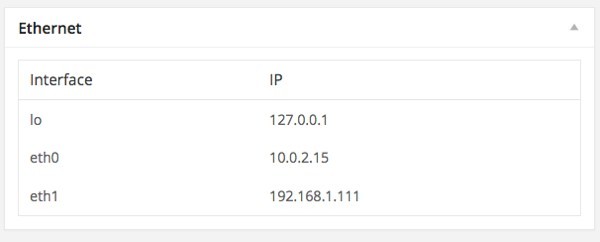
Network Traffic
Network traffic, or Network IO, shows the status of transferring packages over the network of computers. The information is pulled off from netstat.
[vagrant@vagrant-centos64 sbin]$ netstat -i
Kernel Interface table
Iface       MTU Met    RX-OK RX-ERR RX-DRP RX-OVR    TX-OK TX-ERR TX-DRP TX-OVR Flg
eth0       1500   0     4828      0      0      0     2933      0      0      0 BMRU
eth1       1500   0     4806      0      0      0     2679      0      0      0 BMRU
lo        16436   0      276      0      0      0      276      0      0      0 LRU
Let's get our basic class
Networkio in file widget/networkio.php<?php
/**
* Adopt from https://github.com/afaqurk/linux-dash/blob/master/sh/ip.php
*
*/
namespace AX\StatBoard\Widget;
class Networkio implements Provider {
function __construct() {
}
public function get_title() {
return "Network IO";
}
function get_metric() {
$ethernet = array();
$output = `netstat -i | grep -v -E '(Iface|Interface)' | awk '{print $1","$4","$8}'`;
$lines = explode("\n", $output);
foreach ($lines as $line) {
$line = explode(',', $line);
if (count($line)<3) {
continue;
}
$ethernet[] = array($line[0], intval($line[1]), intval($line[2]));
}
return $ethernet;
}
}
I will explain them later in the article. For now, let try to evaluate the command we used in above code. [vagrant@vagrant-centos64 sbin]$ netstat -i
Kernel Interface table
Iface MTU Met RX-OK RX-ERR RX-DRP RX-OVR TX-OK TX-ERR TX-DRP TX-OVR Flg
eth0 1500 0 5727 0 0 0 3400 0 0 0 BMRU
eth1 1500 0 5004 0 0 0 2797 0 0 0 BMRU
lo 16436 0 292 0 0 0 292 0 0 0 LRU
[vagrant@vagrant-centos64 sbin]$ netstat -i | grep -v -E '(Iface|Interface)'
eth0 1500 0 5736 0 0 0 3405 0 0 0 BMRU
eth1 1500 0 5004 0 0 0 2797 0 0 0 BMRU
lo 16436 0 292 0 0 0 292 0 0 0 LRU
[vagrant@vagrant-centos64 sbin]$ netstat -i | grep -v -E '(Iface|Interface)' | awk '{print $1","$4","$8}'
eth0,5760,3420
eth1,5004,2797
lo,292,292
[vagrant@vagrant-centos64 sbin]$
netstat return many things, we used grep to eliminate the line contains words Iface or Kernel (the first two lines), we only care about the last three lines with our ethernet devices and their package transferring. awk is used to print out the data of first, forth and eighth column meaning the name of interface, RX-OK and TX-OK. In our
get_metric, we split the result line-by-line into an array. Because each of line contains data separate by the comma, so they are split again into an array. get_content. public function get_content() {
$interfaces = $this->get_metric();
$data = array_merge(array(array('Interface', 'Receive(package)', 'Transfer(package)')), $interfaces);
$data = json_encode($data);
echo <<<EOD
<div id="nio_chart"></div>
<script type="text/javascript">
google.setOnLoadCallback(function () {
var data = google.visualization.arrayToDataTable({$data});
var options = {
};
var chart = new google.visualization.ColumnChart(document.getElementById('nio_chart'));
chart.draw(data, options);
})
</script>
EOD;
}
We used the bar chart earlier, and tried to format the array of metric data into bar chart data format, then render it. 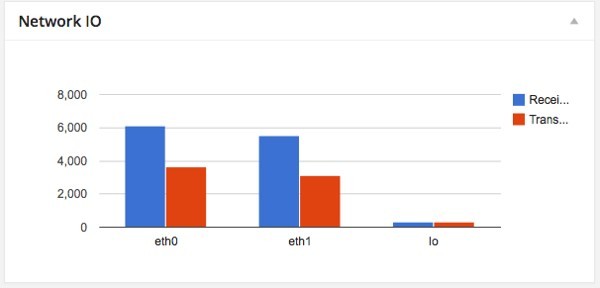
Input/Output Statistics
Now, we tackle io stat. IO means input/output. We will find out how many read/write operations are performed per second. We also tackle io_wait. IO Wait is the time that CPU is idle waiting the result that it read from hard drive.
For example you're reading the MySQL data, and CPU will be idle to wait for the result. The io wait is calculated on 1 second or 1000 milliseconds. If your code takes 100 milliseconds to read data from hard drive, then the io_wait is 100/1000 = 10%. The less IO wait, the better performance for system.
In order to proceed with this, please make sure you have sysstat package on system.
- For Arch Linux, install
with pacman -S sysstat
- For Debian/Ubuntu, you can get them with
apt-get install sysstat
- For Fedora/Centos, you can use
yum install sysstat - For other distributions,:please use your distribution package manager to install it
Once you installed, let's evaluate some commands we will use. First thing's first:
[vagrant@vagrant-centos64 sbin]$ iostat
Linux 2.6.32-358.23.2.el6.x86_64 (vagrant-centos64.vagrantup.com)     04/27/2014 	_x86_64_	(1 CPU)

avg-cpu:  %user   %nice %system %iowait  %steal   %idle
           0.05    0.00    0.25    0.04    0.00   99.66

Device:            tps   Blk_read/s   Blk_wrtn/s   Blk_read   Blk_wrtn
sda               0.18         7.62         1.04     157826      21584
The forth line contains data of IO status. We are interested in iowait value in fourth column. The data from seventh line going forward contains read/write block per second of the hard drive. [vagrant@vagrant-centos64 ~]$ cat /sys/block/sda/queue/physical_block_size 512 [vagrant@vagrant-centos64 ~]$So my sda's block size is 512. We multiply the number of block read per second with the block size to get the real size of read/write data.
With the basic above knowledge, let's create our class
Iostat in widget/iostat.php. <?php
namespace AX\StatBoard\Widget;
class Iostat implements Provider {
function __construct() {
}
public function get_title() {
return "Disk IO";
}
/**
* Make sure we install package sysstat
* yum install sysstat
* or apt-get install sysstat
*
* Return IO Stat information. CPU waiting time, disk read/write
*
*/
function get_metric() {
$metric = array();
$output = `iostat`;
$number_of_core = intval(`/bin/grep -c processor /proc/cpuinfo`);
$lines = explode("\n", $output);
//We should have more than 4 lines
if (!is_array($lines) || sizeof($lines)<4) {
return false;
}
$avg_cpu = preg_split("/\s+/", $lines[3]);
$metric['cpu'] = array(
'user' => floatval($avg_cpu[0]) * $number_of_core,
'system' => floatval($avg_cpu[2]) * $number_of_core,
'io_wait' => floatval($avg_cpu[3]) * $number_of_core,
'other' => 100 - ($avg_cpu[0] + $avg_cpu[2] + $avg_cpu[3])
);
if (sizeof($lines) >=7) {
for ($i=6,$l = sizeof($lines);$i<$l; $i++) {
$line = preg_split("/\s+/", $lines[$i]);
if (!is_array($line) || sizeof($line)<5) {
continue;
}
// Calculate block size
$block_size = shell_exec("cat /sys/block/{$lines[1]}/queue/physical_block_size");
$metric['disk'][$line[0]] = array(
'read' => floatval($line[2]) * $block_size / 1024,
'write' => floatval($line[3]) * $block_size / 1024,
);
}
}
return $metric;
}
}
We just tried to implement our theory into PHP code. Getting output of iostat, turn it into an array with every line is an element. get_content and render our chart. public function get_content() {
$metric = $this->get_metric();
$disk_io = array(
array('Disk', 'Read(MB)', 'Write(MB)'),
);
foreach ($metric['disk'] as $disk=>$stat) {
$disk_io[] = array($disk, $stat['read'], $stat['write']);
}
$disk_io = json_encode($disk_io);
$cpu_io = json_encode(array(
array('CPU Time', 'Percent'),
array('IO Wait', $metric['cpu']['io_wait']),
));
echo <<<EOD
<div id="widget_disk_io"></div>
<div id="widget_cpu_io_wait"></div>
<script type="text/javascript">
google.load('visualization', '1', {packages:['gauge']});
google.setOnLoadCallback(function () {
var data = google.visualization.arrayToDataTable({$cpu_io});
        var goptions = {
          redFrom: 80, redTo: 100,
          yellowFrom:50, yellowTo: 80,
          minorTicks: 5
        };
var chart = new google.visualization.Gauge(document.getElementById('widget_cpu_io_wait'));
chart.draw(data, goptions);
var data2 = google.visualization.arrayToDataTable({$disk_io});
var chart2 = new google.visualization.ColumnChart(document.getElementById('widget_disk_io'));
chart2.draw(data2, {});
})
</script>
EOD;
}
For disk IO read and writes, we used a bar chart. For IO wait, we use gauge chart to make it look nice. We consider an IOwait of 80-100 is a critical incident, and highlight it with red. var goptions = {
redFrom: 80, redTo: 100,
yellowFrom:50, yellowTo: 80,
minorTicks: 5
};Let's see our hard work in real life: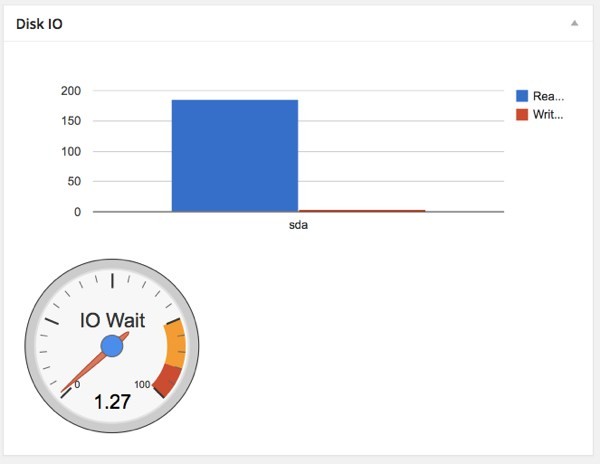
What's Next?
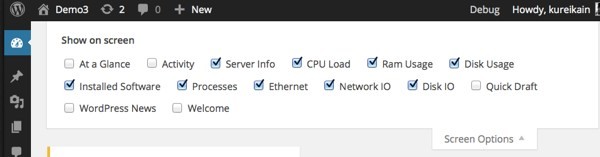
At this point, we've finished all of the widgets for our plugin. You can download the plugin in this tutorial to avoid typing all of the tutorial code. Installing plugin, then refreshing your dashboard and use the Screen Option to decide which widget you want to show.
Our plugin works great at this point; however, we can go further to implement Users and Roles check because the data can be sensitive.
We also should use cronjob to pull these metric. Stay tuned for the next part.
As always, be sure to leave a comment to let us know what you think about the plugin, and if you customize it (as well as how!).

Comments