There was a time when programmers were paid by the number of lines of code they wrote. They were treated as source code producing machines working in cubicles and in return they considered programming just a job that they do eight hours a day and then forget about it, for the rest of the day.
But times have changed. Most cubicle workplaces disappeared and programmers started loving their craft. With the advent of Agile techniques and the Software Craftsmanship movement, many new tools emerged to help the programmer and the process. TDD is slowly becoming the de facto way of writing code and the secrets of SCRUM or Kanban were revealed even to the programmers in the darkest corners of the cubicle world.
Automated testing and test driven development (TDD) are some of the essential techniques Agile provided to us programmers. And a tool that comes with those methodologies is used to produce test code coverage, which is the topic of this article.
Definition
"In computer science, code coverage is a measure used to describe the degree to which the source code of a program is tested by a particular test suite." ~ Wikipedia
The definition above, taken from Wikipedia, is one of the simplest ways to describe what code coverage means. Basically, in your project you have a bunch of production code as well as a bunch of test code. The test code exercises the production code and the test coverage tells you how much of your production code was exercised by the tests.
Information can be presented in various ways, from simple percentages to nice graphics or even real-time highlighting in your favorite IDE.
Let's Check It in Action
We will use PHP as the language to exemplify our code. Additionally, we will need PHPUnit and XDebug to test our code and gather coverage data.
The Source Code
Here is the source code we will use. You can also find it in the attached archive.
class WordWrap {

	public function wrap($string = '', $cols) {
		$string = trim($string);
		if (strlen($string) > $cols) {
			$lastSpaceIndex = strrpos(substr($string, 0, $cols), ' ');
			if ($lastSpaceIndex !== false && substr($string, $cols, 1) != ' ') {
				return substr($string, 0, $lastSpaceIndex) . "\n" . $this->wrap(substr($string, $lastSpaceIndex), $cols);
			} else {
				return substr($string, 0, $cols) . "\n" . $this->wrap(substr($string, $cols), $cols);
			}
		}

		return $string;
	}
}
The above code contains a simple function that wraps text to a specified number of characters, per line.
The Test Code
We wrote this code using Test Driven Development (TDD) and we have 100% code coverage for it. This means that by running our test, we exercise each and every line of the source code.
require_once __DIR__ . '/../WordWrap.php';

class WordWrapTest extends PHPUnit_Framework_TestCase {

	function testItCanWrap() {
		$w = new WordWrap();

		$this->assertEquals('', $w->wrap(null, 0));
		$this->assertEquals('', $w->wrap('', 0));
		$this->assertEquals('a', $w->wrap('a', 1));
		$this->assertEquals("a\nb", $w->wrap('a b', 1));
		$this->assertEquals("a b\nc", $w->wrap('a b c', 3));
		$this->assertEquals("a\nbc\nd", $w->wrap('a bc d', 3));
	}
}
Running the Tests in CLI With Text Only Coverage
One way to obtain coverage data is to run our tests in the CLI (command line interface) and analyze the output. For this example, we will assume a UNIX like operating system (Linux, MacOS, FreeBSD, etc). Windows users will need to slightly adapt the paths and executable names, but it should be fairly similar.
Let's open a console and change directories in to your test folder. Then run phpunit with an option to generate coverage data as plain text.
phpunit --coverage-text=./coverage.txt ./WordWrapTest.php
This should work out of the box on most systems if XDebug is installed, however in some cases, you may encounter an error related to time zones.
PHP Warning:  date(): It is not safe to rely on the system's timezone settings.
You are *required* to use the date.timezone setting or the date_default_timezone_set() function.
In case you used any of those methods and you are still getting this warning, you most likely
misspelled the timezone identifier. We selected the timezone 'UTC' for now, but please set
date.timezone to select your timezone. in phar:///usr/share/php/phpunit/phpunit.phar/
PHP_CodeCoverage-1.2.10/PHP/CodeCoverage/Report/Text.php on line 124
This can be easily fixed by specifying the suggested setting in your php.ini file. You can find the way to specify your timezone in this list. I am from Romania, so I will use the following setting:
date.timezone = Europe/Bucharest
Now, if you run the phpunit command again, you should see no error messages. Instead, the test results will be shown.
PHPUnit 3.7.20 by Sebastian Bergmann.
..
Time: 0 seconds, Memory: 5.00Mb
OK (2 tests, 7 assertions)
And the coverage data will be in the specified text file.
$ cat ./coverage.txt

Code Coverage Report
  2014-03-02 13:48:11

 Summary:
  Classes: 100.00% (1/1)
  Methods: 100.00% (1/1)
  Lines:   2.68% (14/522)

WordWrap
  Methods: 100.00% ( 1/ 1)   Lines: 100.00% (  7/  7)
Let's analyze this a little bit.
-
Classes: refers to how many classes were tested and how many of them were covered.
WordWrapis our only class. -
Methods: same as with classes. We have only our
wrap()method, nothing else. - Lines: same as above, but for lines of code. Here we have a lot of lines because the summary contains all the lines from PHPUnit itself.
- Then we have a section for each class. In our case, that is only
WordWrap. Each section has its own methods and line details.
Based on these observations, we can conclude that our code is 100% covered by tests. Exactly as we expected before analyzing the coverage data.
Generating HTML Coverage Output
By just changing a simple parameter for PHPUnit, we can generate nice HTML output.
$ mkdir ./coverage
$ phpunit --coverage-html ./coverage ./WordWrapTest.php
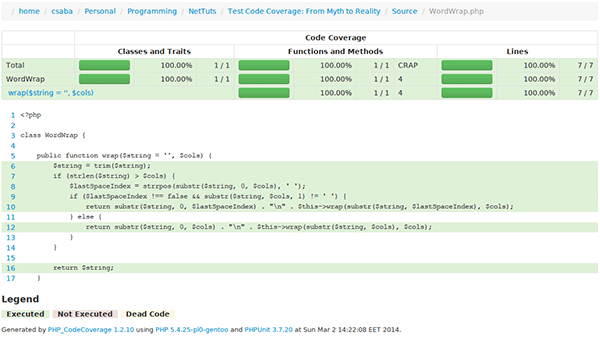
If you check your ./coverage directory, you will find a lot of files there. I won't paste the list here because it is quite extensive. Instead, I will show you how it looks in a web browser.
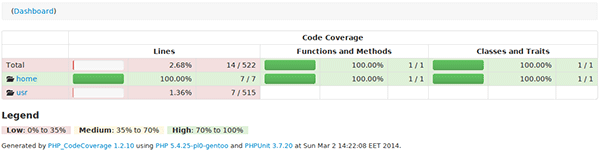
This is the equivalent of the summary section from the text version above. We can zoom in by following the proposed links and see more details.
Coverage Inside Our IDE
The previous examples were interesting and they are quite useful, if your code is built on some remote server to which you have only SHH or web access to. But wouldn't it be nice to have all this info, live in your IDE?
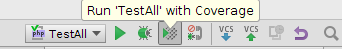
If you use PHPStorm, everything is within the distance of a single click! Select to run your tests with coverage and all the info will just simply show up, magically.
The coverage information will be present in your IDE, in several ways and in several places:
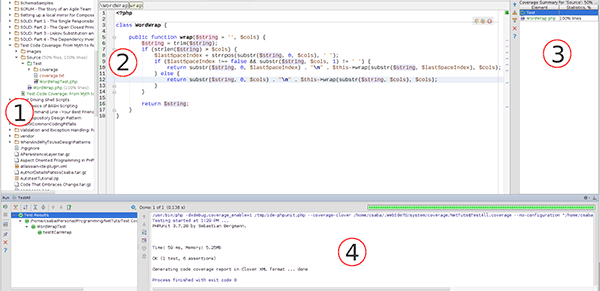
- Test coverage percentage will be shown near each directory and file.
- In the editor, while editing code, on the left of the line numbers, a green or red rectangle will mark each line. Green represents tested lines, red represents untested ones. Lines without actual code (empty lines, only braces or parentheses, class or method declarations) will not have any marks.
- On the right side there will be file browsers where you can quickly browse and sort files by coverage.
- In the test output, you will see a line of text announcing to you that code coverage was generated.
The Myths About Code Coverage
With such a powerful tool in the developer's hands and under the management's nose, it was inevitable for some myths to surface. After programmers refused to be payed by the number of lines of code they write, or managers realized how easy it is to game the system, some of them started paying programmers by the percentage of code coverage. Higher code coverage means the programmer was more careful, right? It's a myth. Code coverage is not a measure of how well you write code.
Sometimes programmers tend to think that code with 100% coverage has no bugs. Another myth. Code coverage merely tells you that you have tested each line of code. It is a measure of the number of lines exercised. It is not a measure of the number of lines correctly implemented. For example, half written algorithms with only half defined tests will still have 100% coverage. This does not mean the algorithm is finished or that it works correctly.
Finally, gaming the system is very easy. Of course, if you use TDD, you are naturally having a high coverage value. On whole projects, 100% is impossible. But on small modules or classes, obtaining 100% coverage is very easy. Take for example our source code and imagine you have no tests at all. What would be the simplest test to exercise all the code?
function testItCanWrap() {
	$w = new WordWrap();
	$this->assertEquals("a b\nc", $w->wrap('a b c', 3));
	$this->assertEquals("a\nbc\nd", $w->wrap('a bc d', 3));
}
That's it. Two assertions and full coverage. This is not what we want. This test is so far from descriptive and complete, that it is ridiculous.
The Reality About Code Coverage
Code coverage is a status indicator, not a unit to measure performance or correctness.
Code coverage is for programmers, not for managers. It is a way to spot problems in our code. A way to find old, untested classes. A way to find paths not exercised by the tests that could lead to problems.
On real projects, code coverage will always be under 100%. Achieving perfect coverage is not possible, or if it is, it's rarely a must. However, to have 98% of coverage you must target 100%. Having anything else as your target is non-sense.
Here is the code coverage on Syneto's StorageOS configuration application.
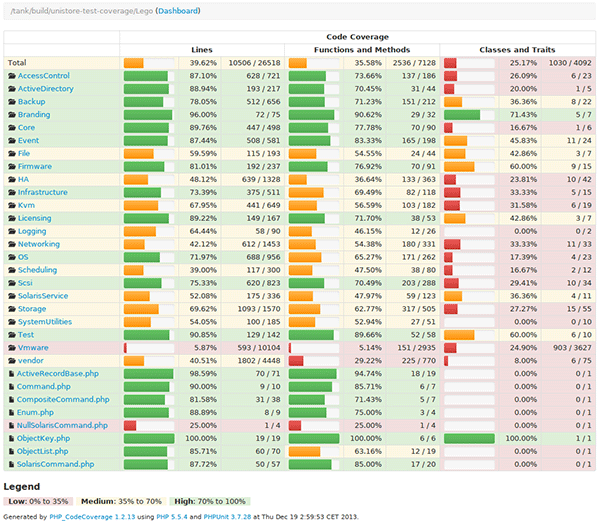
The total is only about 35%, but the results need interpretation. Most of the modules are in the green, with more than 70% coverage. However there is a single folder, Vmware, which pulls down the average. It is a module with a lot of classes containing only definitions for the communication API. There is no reason to test those classes. They were automatically generated by trusted code. The programmers will know this and they will know how to interpret the results. A manager may insist on testing it because it is a red bar and it looks suspicious for someone not knowing the internal details of the project. Would it make any sense to test it? Not at all! It would be a useless test, that would take up precious tens of seconds of build time without any advantage.
Final Thoughts
So here is where we are with code coverage: it's a great tool for programmers, a source of information to highlight possible problems, a misunderstood reality for most managers, and another tool to force and measure programmers' activities. As with any other tool, it is one that can be correctly used and misused easily.

Comments