Following on from the great introductory articles featured recently on Nettuts+, this article looks to show how you can take New Relic to the next level. As a performance monitoring tool New Relic is fantastic, but what about performance testing, before you go live. That's where JMeter comes in to play. In this tutorial, you will see how we can stress test our application under realistic load, and combine the output of JMeter and New Relic to give you confidence in your applications performance, before releasing into a production environment.
This content was commissioned by NewRelic and was written and/or edited by the Tuts+ team. Our aim with sponsored content is to publish relevant and objective tutorials, case studies, and inspirational interviews that offer genuine educational value to our readers and enable us to fund the creation of more useful content.
Why wait until deployment to see how your application is going to fare against real world traffic. If there is a bottleneck in your code that degrades the user experience, do you really want that to go live? What if we could find these bottlenecks early, improve performance and deliver a great application to our end users the first time, and maintain that going forward with regular benchmarking. JMeter and New Relic together can give you this perfect performance testing suite.
Demo Application
Before we can begin using New Relic and JMeter we need a simple app to do some performance testing on! So, lets write a simple Ruby Sinatra app that has a service we can test. I won't go into the creation of this application too much, as you can read up on Sinatra in other articles on Nettuts+.
The application will be faked a little, to allow us to see some interesting results along the lines of what we may see in various applications. We will write a service that takes an id, and depending on that id will return a value either straight away or with a delay. This will show us what can happen if requests are handled quickly or slowly and the impact this has on your apps overall performance as many users make requests.
Here is the code that defines the services:
             require 'sinatra'
             require 'puma'
             require 'newrelic_rpm'

             module Example
             class App < Sinatra::Base
             get '/example/:id' do |id|
             result = id
             if id == '1'
             result = "This is our id: #{id}"
             end
             if id == '2'
             sleep 3
             result = "We waited for id: #{id}"
             end
             result
             end
             end
             end
As you can see this is clearly a contrived example, but the idea is that we have some fast responding services and one with a slight delay. We can now use this app and start to write our performance testing plan in JMeter. Lets first get JMeter installed on our machine.
Hooking Into New Relic
Getting your application reporting to New Relic is a very simple process. New Relic support Ruby, Python, PHP, Java and other platforms, featuring easy to follow guides for all. In the case of Ruby an Sinatra, it is literally a four step process:
- Add the 'newrelic_rpm' gem to your GemFile and 'bundle install'.
- In your main 'app.rb' where we defined the service route above, add a "require 'newrelic_rpm'" line.
- Download the 'newrelic.ini' file from your account in New Relic and place in a config folder in your app.
(Ensuring Monitor Mode is set to 'true' for Development if running locally.) - Rackup your application and see it listed in New Relic!
Once you have follow these simple steps, you should start to see some data coming through to New Relic as you hit your app with some traffic. You'll know it's working when the app is listed and turns green.

For the sake of completeness, I will just list a brief overview of the main view New Relic provides for your applications. The design on New Relic is mainly to monitor applications that are in production environments with live traffic. The overview screen provides an at a glance look at the current status of your application and how it is responding to customers requests.
The screen can be broken down as follows:
- Response Time - this is the average response time of calls across your application.
-
Apdex - New Relics metric for customer experience. A score more towards 1 indicates the vast majority of user's
requests are falling within a reasonable time. The apdex can be useful for alerting when it falls below as set number. - Throughput - the requests per minute (RPM) being made to your application.
- Web Transactions - the different routes being accessed in your application. These are ordered by the most time consuming requests.
- Error rate - the percentage of requests causing an error. You can click through and debug individual errors here.

What Is JMeter?
JMeter is a Java application that allows you to build up test plans that can stress test your application. You can set everything from the amount of simultaneous users of the service, to the amount of requests they make a second. You can even ramp up the requests to see how your app deals with changing load, just as it could in real world deployment.
As part of this tutorial, I will show the basics of getting a test plan running against your applications, but with a wealth of plugins and documentation there are plenty of tools to handle any kind of performance testing you may need.
Installation and Usage
Installation is fairly straightforward and here we will list instructions for Mac and Linux.
Mac OS X
On a Mac JMeter can be installed very easily via Brew. Once you have Brew try the
following command:
brew install jmeter
Linux
On a Linux machine, simply download from the JMeter downloads page. Then, simply follow the instructions provided.
All Platforms
Once you have the main JMeter package, we also need to install the standard set of plugins. We will be making use of one plugin in particular later on, therefore we need to add these in to be able to use it. The standard plugin set can be obtained from this link: http://jmeter-plugins.org/downloads/file/JMeterPlugins-1.0.0.zip Once downloaded extract into the JMeter package which is located at: "/usr/local/Cellar/jmeter/" on a Mac, and wherever you installed it to on Linux.
Analysis In New Relic - First We Need a JMeter Test Plan!
So now we have JMeter installed and our simple application, let's test this app and see how it behaves. When you fire up JMeter you will get this screen:
Now, let's set the base URL for our requests. Right click on "Test Plan" in the left pane, and choose 'Add -> Config Element -> HTTP Request Default'. We can now enter our base URL in here like so.

We can now add the amount of threads or "users" of our system. To do this right click on "Test Plan" again and choose 'Add -> Threads (Users) -> Thread Group'. We can then enter the users, in this case 20. Make sure to choose the loop count forever option, as this will allow us to control the time and number of requests via a plugin later.

Once we have the the thread group we can now define the requests we want to make to our application that we are going to performance test. To do this we will add "HTTP Request" to our "Test Plan". This can found by right clicking on the "Thread Group" and choosing "Add -> Sampler -> HTTP Request". We can then define the request to make in the pane as below.

You can see how we dont need to define the base URL, as we did that earlier on and instead just need to add the path for the request. In this case the path is to our 'example/1' response. You will also notice I have gone ahead and added the other two requests along with the result and graphing panes, which we will use to analyse the results of the tests. By now you should of got the hang of adding elements and they can be easily found in the menu from their names. The main two of interest are the "Throughput Shaping Timer" and the "Composite Graph".
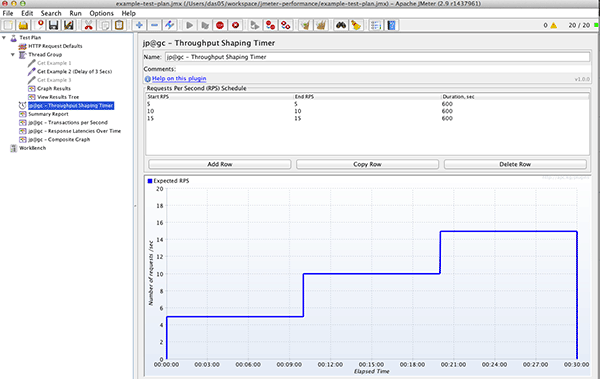
The Shaping Timer enables us to map how we want the requests to be made to our application over time. For example, we can configure one request per second for 60 seconds, and then ramp up to five requests a second for 60 seconds and see the effect this has on our response times. Let's take a look how we configure that in the Shaping Timer pane.

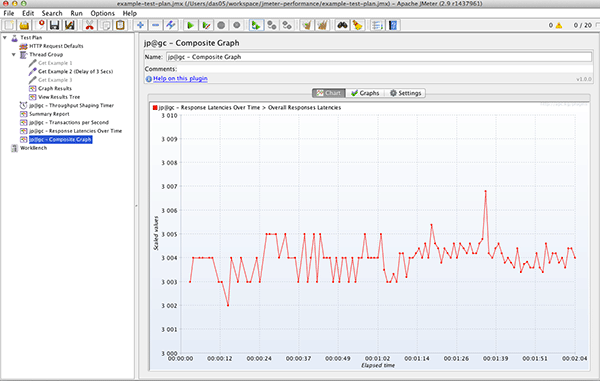
So, by going in and adding each row, you can define the amount of request to make and for how long it should do this for. We can then view our results using the "Composite Graph", which shows the transactions made per second against the response time of our requests. This requires minimal configuration, simply adding the two graphs we will combine, then in the settings for the composite graph, add in the graphs we require like so:

That's it! We can now run our test plan and start seeing some results. Hit play towards the top of the screen and then click on the composite graph. It will start to ploy out the results as they come in and you can get a picture of how your application is responding. Let's look at our results.

We can clearly see the jump in requests at one minute has a fairly sizeable impact on our application. For the first minute the requests are stable at one per second and give response times of around two/three ms. However, when we increase to five, the response times increase slightly hitting five and five m/s. Obviously these are very quick response times in the real world, but we are just showing here how we can increase the load and see the affect, if any, this will have.
Let's compare these results with the service that has a delay of three seconds. How will that cope with the increase in load? To switch to example two, right click on example one and choose toggle. This will disable that request, then do a toggle on example two and that will enable it. Be sure to click the "Clear All" (Sweeping brush) icon at the top to clear the last run's results, then hit play.
Even with the three second delay, the server managed the requests quite well and we see much the same in the way of results for this service. Only a few millisecond increase as the requests increase. With such a simple service, this is to be expected.
New Relic Analytics
The real power now comes with combining this data with New Relic. We could for example, set JMeter to run for half an hour with different variations of load and then use New Relic to analyse the results and use its drill down functionality to look for bottlenecks in the application. These can then be fine tuned, increasing your performance before delivering to your customers.
Again, I won't go into the setup of New Relic as this is covered in other recent articles on Nettuts+ (See here). But once your application is connected, it's simply a case of generating the load through JMeter and logging into New Relic to see the results. For this run, I have set up the Shaping Timer to run our load for 30 minutes ramping up the requests from five to 10 and then 15 per second. This should give us some reasonable traffic to look at in New Relic.
Once the JMeter test has run, we can take a look into New Relic which we can now see has stat on the traffic following through the app.

This clearly shows the ramping up of the requests, at its peak hitting around 400 request per minute (RPM) and the response times remaining stable at three seconds. We can delve deeper into the stats and look into the transaction we are making. If we click through to the Web Transactions view, we can see the analysis New Relic has done on just this part of the application. If the code that handled the request had more layers to it, such as methods to call other systems to get data before presenting back to the user, we would see more of a breakdown.
For example, on the left it shows we spent 100% of the request time, in that call. If we had multiple stage such as a call to a database, we may see a high percentage there and we would know to optimise the query to the database to increase performance.

New Relic also provides a great reporting view on your applications data, called Scalability. This report can be really useful to monitor your applications ability to handle increasing load. The graph shows your response time against the requests per minute, and you can clearly see if there is any degradation in the response time as they increase. This is great tool and one you should refer to often both in performance testing like this, but also in your performance monitoring of your production application.
In our example below, it is clear that the application is capable of maintaining a three second response time even as the RPM increases.

New Relic also provides another view, that of Capacity. This allows us to look at how much of the available resources our application is making use of. It indicates to the developer whether the number of instances serving your application is enough to handle the kind of load you are getting. This is vital to ensure you are not running near capacity and have the ability to handle any spikes in traffic that may occur outside your normal traffic flow. New Relic summarise the page well, next to the analysis of our application here, which we can see is fairing well even on this single instance.

Conclusion
The aim of this tutorial was to show you how to quickly setup JMeter testing plans for your application, so you can test drive the performance of your application before delivering to your customers. This approach can be used in new projects, ensuring the application you are going to deliver is ready for real world traffic. It can also be used on legacy applications, giving you a baseline performance indicator so that as you make changes going forward you can see whether your application's performance is improving or decreasing.
By leveraging the great tools provided by New Relic, you can both monitor your application online in real time, but also take its toolset and apply it to your own offline analysis. This will give you, the developer, confidence in your product both as it is being developed and when it is released to the wild.

Comments