In part 1, we saw how to write and execute JavaScript using the DevTools. In part 2, we'll look at debugging JavaScript and adopting a workflow such that solving JavaScript errors and diagnosing problems becomes more efficient.
Debugging JavaScript Using the DevTools
Debugger Keyword
You can use the debugger keyword directly in your code to invoke the debugging capabilities (if any) of the JavaScript runtime. The effect of adding the keyword debugger in your code is identical to manually setting a breakpoint via the DevTools UI. In Chrome, the debugger keyword has no effect while DevTools is closed.
Debugger Controls
The debugger controls provide fine grained control over the debugging flow. Use these when paused at a breakpoint to effectively navigate your way through JavaScript code. Each debugger control listed in this section corresponds to a button in the DevTools that you can select while paused at a breakpoint.
Continue
Leaves the current breakpoint and resume code execution as normal. This does not affect other breakpoints which have not been paused yet.
Use Continue when the current paused breakpoint is not helpful and you want code execution to resume as normal.
Step Over
Step through code line-by-line (one line per click) until a function call is reached. At this point, the function call is stepped "over" and you do not step into that particular function call.
Use Step Over when what you are trying to solve is scoped with the current function, and you have no need to look at external function calls.
Step Into
Similar to Step Over, except that in this case, you navigate to external function calls by going to their first line.
Use Step Into when you are interested in line by line execution as well as any external function calls.
Step Out
When you step into a function, Step Out will continue to execute the rest that functions code however it is not debugged.
Use Step Out when you have no interest in the remainder of the current function and wish to continue debugging outside it.
The Call Stack
The call stack is active when paused at a breakpoint. The execution path which leads to the currently paused breakpoint is shown in the call stack, the top call being the most recent.
Each call within the stack contains:
- function name
- file name containing the function
- the line of code where the function exists
Click on any call within the stack to navigate to its point in the source code with the relevant line highlighted. To copy a stack trace to your clipboard, right-click on a call and select Copy stack trace. In the call stack context menu, you can also select Restart Frame.
Rewriting Functions While Paused at a Breakpoint
Consider the use case that the debugger has paused midway through a callback function triggered by a click event handler, and you are trying to debug why the retrieval of the target does not seem to be working as expected.
You see an attempt has been made to access the target property as part of the this keyword, but you then recall it’s a property part of the event object passed as an argument to the callback function.
You can rewrite the function using Live Edit to verify that your changes work, and the new JavaScript is injected into the V8 engine.
monitorEvents
When you are writing an event handler for an event such as scroll, you may start by using console.log to see what the passed argument (the event object) looks like. A quick tip to accomplish this is to use the monitorEvents shortcut. Paste the following code in the Console Panel and then scroll the page:
monitorEvents(window, "resize");
Notice that the event object is logged to the console ready for inspection.
Debug
When you want the debugger to pause on the first line of a function during its execution, you can do either of the following:
- Add a breakpoint via the DevTools UI.
- Add a debugger statement to the function.
Another technique is to execute debug(fn) which is part of the Command Line API. The function takes the function that you wish to debug as its argument, and will break on the first line of that function's execution.
Break on Property Access
This technique enables you to pause the debugger when a property of an object you have interest in is accessed in any way (a read or write). To break when a property of an object is read or written to, execute the following (via the Console Panel or Snippets):
Object.defineProperty(document.body, 'scrollTop', {
	get: function () {
		debugger;
	},
	set: function (val) {
		debugger;
	}
});
This applies a getter and setter to the scrollTop property of the document.body object. In the custom getter and setter, the debugger statement exists. You can also use Object.observe to break on property additions for a specified object:
var watchMe = {};
Object.observe(watchMe, function() {
  debugger;
});
Conditional Breakpoints Using console.log
The debugger keyword aside, to set a breakpoint via DevTools, you can click on the line of code you wish to break at within the line gutter. This method of setting a breakpoint has extra functionality: You set a conditional breakpoint which will instruct the DevTools to pause at a breakpoint only if a certain expression evaluates to true. For example, you can set a conditional breakpoint to pause only if an error argument exists.
To set a conditional breakpoint:
- Right-click within the line gutter.
- Select Add conditional breakpoint.
- Enter the expression that you want DevTools to evaluate.
- Press Enter.
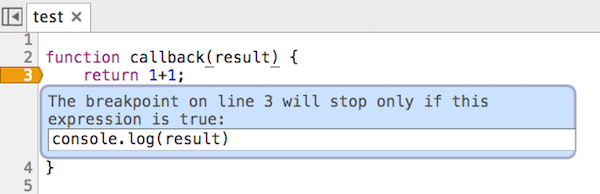
You can also use the conditional breakpoint technique to quickly insert a console.log statement as the expression to evaluate. Since console.log evaluates to undefined, DevTools doesn’t pause, but since the expression is still executed, you can inspect the value of variables this way.
Using Watch Expressions
When the debugger is paused at a breakpoint, you can bring up the Console Panel in Drawer Mode using the Escape key. The code you enter is evaluated in the same context as the point at which you are paused, meaning that variables which are scoped will be accessible to you.
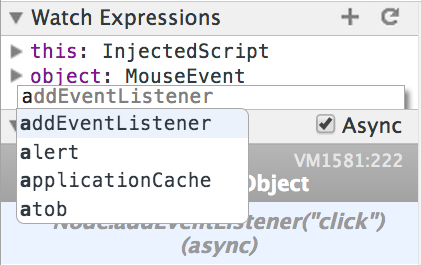
A Watch Expression is a tool to simplify the technique of regular inspection (via console.log for example) of scoped variables. Watch Expressions is a pane within the Sources Panel. You can add or remove Watch Expressions using the Plus and Minus buttons. A typical object to watch for is the this object; notice how it refers to a global window object when you are not paused at a breakpoint.
Watch Expressions will usually update while you step through code. If it does not, however, click the Refresh button.
Exceptions
Consider the following script:
function a() {
    return b();
}

function b() {
    return c();
}

function c() {
    console.trace('The Trace');
    return 42;
}

a();
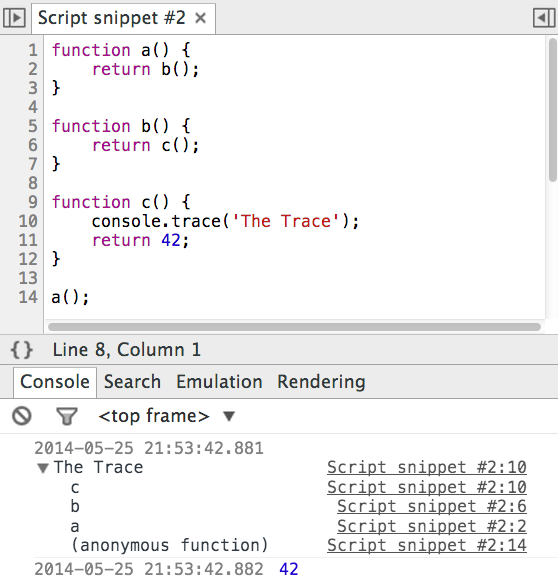
There are three declared functions. Function a calls function b, then function b calls function c. The script initiates the chain with a call to function a. The console.trace statement logs to the console a stack trace from the point where the method was called. Using console.trace displays the output of using console.trace.
Note that function names and the lines where they are called are shown in the trace message. You can click on the line number to be taken to its point in the Source Code via the Sources Panel. This technique also works for snippets.
The debugger offers various modes for dealing with Exceptions:
- Pause on uncaught exceptions.
- Pause on caught and uncaught exceptions.
- Don’t pause on exceptions.
2. Debugging From the Outside In
When you have to debug a site which you have little insight into, you can use a different technique of debugging. In this approach, you hook into events you believe will trigger, and request DevTools breaks on such events if and when they occur. There are two categories of "outside > in" entry points:
- DOM modifications
- Event Listener breakpoints
Break on DOM Modifications
You have the task of debugging a web page, specifically the DOM. Nodes are added and removed during the lifecycle of the page, and you need to inspect the JavaScript which makes this happen. Set a DOM breakpoint with the following steps:
- Right click on a DOM node in the Elements Panel.
- Select a preferred DOM breakpoint from the Break on context menu.
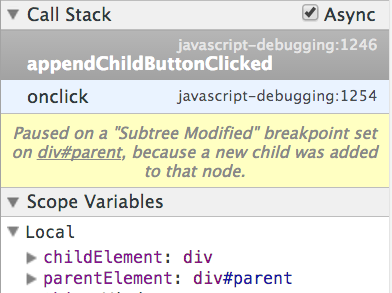
- While you are paused at a breakpoint, you can see a message which explains the reason the debugger has paused, as shown in Reason for pausing at a breakpoint.
Every time you set a DOM breakpoint, you can easily toggle it on and off at the DOM breakpoints pane in the Elements Panel. In this pane, each breakpoint you set is listed, and you can interact with this pane in the following ways:
- Toggle the checkbox on and off to enable or disable the breakpoint.
- Click on the Node name (which is underlined) to navigate to it in the DOM tree view.
- Right-click and select Remove All DOM breakpoints to disable and remove all DOM breakpoints.
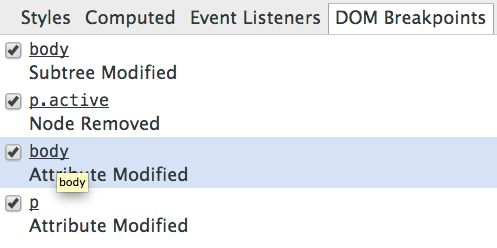
Subtree Modifications
Description: A Subtree modification occurs when the tree of a root node (which has the breakpoint set) is changed. This can include the addition or removal of nodes.
Use case: An empty div container is present in the DOM, and an Ajax request happens on page load which appends some new nodes the the original container. Add a Subtree modification breakpoint on the container to see the exact point in code which adds new nodes to the DOM.
Message examples: Paused on a Subtree Modified breakpoint set on body, because its descendant p was removed. Or: Paused on a Subtree Modified breakpoint set on div#parent, because a new child was added to that node.
Attributes Modifications
Description: An Attribute modification triggers when an attribute name or value on a node is added, removed or modified. This includes all attributes, such as class, data-*, or style.
Use case: A visual change happens on the page at a seemingly random point in time, and you narrow this down to a class which is dynamically set on the body element. You wish to investigate the cause of this dynamic class addition.
Message example: Paused on an Attribute Modified breakpoint set on p.
Node Removal
Description: A node removal breakpoint triggers at the point where a node is removed from the parent containing the set breakpoint.
Use case: You are building a to-do list app and wish to verify that when a user deletes a to-do item, it is also removed from the DOM. You can set a node removal breakpoint to ensure this behaviour is occurs.
Message example: Paused on a Node Removed div#container.
Event Listener Breakpoints
In the DevTools, a number of predefined Event Listener Breakpoints are available for you to enable. These offer entry points into the JavaScript that belongs to a page.
Consider a simple about:blank page. Set a click event listener breakpoint on this page with the following steps:
- Navigate to the Event Listener Breakpoints pane in the Sources Panel.
- Open the
MouseEvent Listener category. - Enable the
Clickevent listener.
You have now set a breakpoint. If you click on the page, notice that nothing happens. Now execute the following piece of JavaScript code in the Console Panel.
document.addEventListener('click', console.log.bind(console))
When you set a breakpoint for the same event you have registered an event listener for, the debugger pauses before the point where your event listener callback is executed.
You can register breakpoints for many types of events such as timers, touch events and more, which are listed in the table below.
| Event Category | Event examples |
|---|---|
Animation |
requestAnimationFrame, cancelAnimationFrame, animationFrameFired |
Control |
resize, scroll, zoom, focus, blur, select, change, submit, reset |
Clipboard |
copy, cut, paste, beforecopy, beforecut, beforepaste |
DOM Mutation |
DOMActivate, DOMFocusIn, DOMFocusOut, DOMAttrModified, DOMCharacterDataModified, DOMNodeInserted, DOMNodeInsertedIntoDocument, DOMNodeRemoved, DOMNodeRemovedFromDocument, DOMSubtreeModified, DOMContentLoaded |
Device |
deviceorientation, devicemotion |
Drag / drop |
dragenter, dragover, dragleave, drop |
Keyboard |
keydown, keyup, keypress, input |
Load |
load, beforeunload, unload, abort, error, hashchange, popstate |
Mouse |
click, dblclick, mousedown, mouseup, mouseover, mousemove, mouseout, mousewheel, wheel |
Timer |
setTimer, clearTimer, timerFired |
Touch |
touchstart, touchmove, touchend, touchcancel |
WebGL |
webglErrorFired, webglWarningFired |
The "debugging from the outside in" technique can be useful when you need to debug a third-party website whose functionality has broken, or even when you are curious as to how something on a page you are viewing is working.
3. Extensions
A number of Chrome extensions exist, many of which enhance DevTools functionality. A featured list is found on the DevTools Extensions Gallery.
DevTools JavaScript Preprocessing
For DevTools Extension authors, the JavaScript preprocessing feature is a worthwhile topic to learn about. The preprocessor can intercept JavaScript source code before it enters the V8 engine, meaning JavaScript source code can be modified via DevTools before it enters the VM, all from an extension.
In addition to interception capabilities, the preprocessing API has programmatic access for reloading of script sources. An extension can, at any point during its lifecycle, reload a JavaScript source without reloading the original web page.
4. Node
This section covers a few tools which offer some level of integration between Node.js and the Chrome DevTools.
Node Inspector
There are two parts to the DevTools:
- Front-end: This is what you use and interact with. It is composed of HTML, CSS, and JavaScript.
- Back-end: In the case of inspecting a page in Google Chrome, the back-end is within the Chrome internals. Messages are passed back and forth via the Remote Debugging Protocol.
Any application can implement communication over the remote debugging protocol and allow its users to debug via DevTools. Node Inspector is one such tool. After installing, you can run any node script using Node Inspector. The tool starts a web server which hosts the DevTools front-end. This special version of the DevTools doesn’t use the Chrome back-end, but rather Node Inspector’s own one.
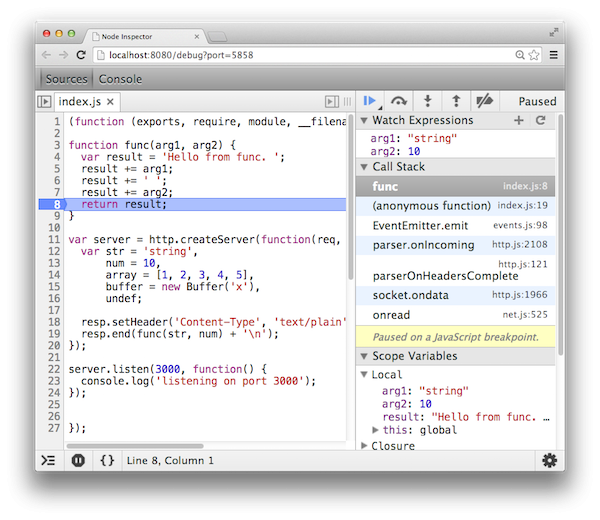
As you can see in Node Inspector, DevTools is paused at a breakpoint. The call stack refers to the calls executed in Node.js. The browser's only involvement here is for the DevTools UI.
Node Heapdump
Use Node Heapdump to take a snapshot of the V8 heap at a point in time in your code. The current state of the V8 heap is serialized and output to a file.
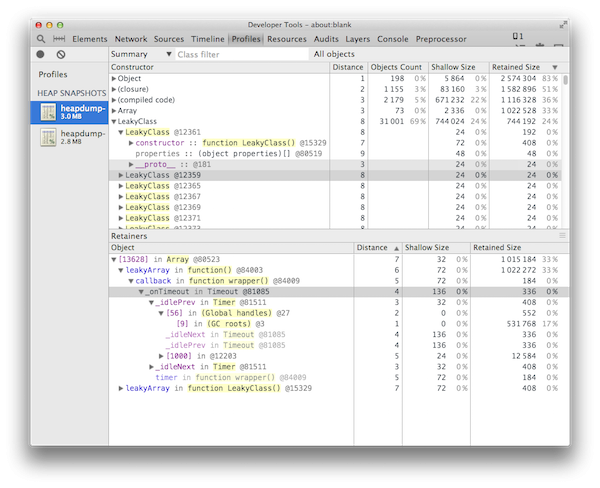
Compare two heap snapshots to discover which objects are not being garbage collected. This is useful for catching memory leaks.
Conclusion
That's it for this two-part series on a modern debugging experience. Hopefully at this point, you're comfortable with authoring and debugging JavaScript within the Chrome DevTools. You're familiar with workflows which can aid debugging and you know some tips and tricks when dealing with a production site you've not worked on before. Be sure to try some of the techniques you learnt here the next time you need to debug.
Thank you for reading!

Comments