In this tutorial series, I will be teaching you how to build a stock quote application with Raphael JS, Titanium Mobile, and Yahoo's YQL web service. Raphael JS charts will be used to graphically present the stock quote information, Titanium Mobile will be used to cross-compile a native iOS app, and YQL data tables will actually retrieve the stock information.
Introduction to Yahoo YQL & Raphael JS
YQL is a SQL-like language that allows you to query, filter and combine data from multiple sources across both the Yahoo! network and other open data sources. Normally, developer access to data from multiple resources is disparate and requires calls to multiple APIs from different providers, often with varying feed formats. YQL eliminates this problem by providing a single endpoint to query and shape the data you request. In this tutorial, we'll be using the YQL open data tables provided by Yahoo Finance in order to retrieve and present stock quote information.
This presentation of this information is where Raphael JS charts come in. Charts and graphs are the easiest, most logical way to present a timeline of financial data, and Titanium mobile does not come with a native charting API. Raphael is open-source and MIT licensed, and it is fortunately very mobile friendly because it is written in standard JavaScript, maintains a low processing footprint, and actually renders in SVG format which means that it can be easily resized to fit any mobile screen without a decrease in image quality!
Final App Preview
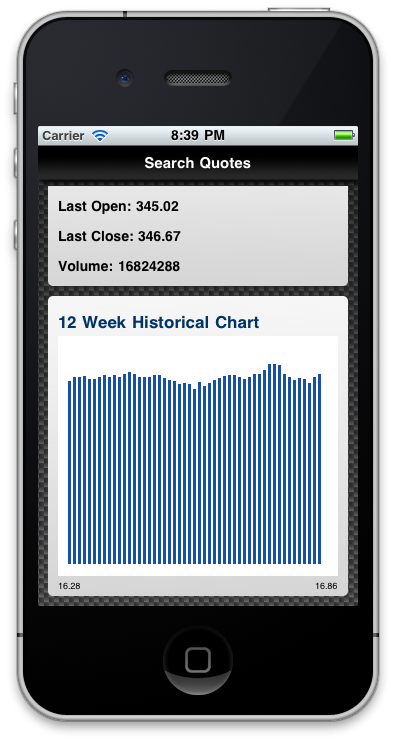
The following is a preview of the application we will be building in this series:
Step 1: Create a New Project
Open up Titanium Developer and create a new project. You can give the project any name you want, but I'll use the title "StockQuotes" for simplicity. Now is a good time to download the source files for this project as well. Download and unzip the project files attached to this post and copy the "images" folder across into the "Resources" directory of your new Titanium project. By default Titanium also includes two icon files in the root of your "Resources" directory called KS_nav_ui.png and KS_nav_views.png - we don't need either so go ahead and move both of these to the trash.
Step 2: Create the Basic Interface
Open the app.js file, in the root of your "Resources" directory, into your favorite editor. We don't need any of the automatically generated code, so delete it all and replace it with the following:
// This sets the background color of the master UIView
Titanium.UI.setBackgroundColor('#000');

// Create the application window
var win1 = Titanium.UI.createWindow({
    backgroundImage: 'images/background.png'
});

// Create the title label for our app
var titleLabel = Titanium.UI.createLabel({
    text: 'Search Quotes',
    color: '#fff',
    height: 20,
    width: 320,
    top: 6,
    textAlign: 'center',
    font: {fontSize: 15, fontFamily: 'Helvetica', fontWeight: 'bold'}
});
win1.add(titleLabel);

//Create the scroll area, all our content goes in here
var scrollArea = Titanium.UI.createScrollView({
    top: 40,
    width: 320,
    height: 420,
    contentHeight: 'auto'
});

// Create the stock quote search box
var searchBox = Titanium.UI.createView({
    width: 300,
    left: 10,
    top: 10,
    height: 50,
    borderRadius: 5,
    backgroundImage: 'images/gradient-small.png'
});

scrollArea.add(searchBox);

// Create the quote information box
var quoteInfoBox = Titanium.UI.createView({
    width: 300,
    left: 10,
    top: 70,
    height: 200,
    borderRadius: 5,
    backgroundImage: 'images/gradient.png'
});

scrollArea.add(quoteInfoBox);

// Create the quote chart box
var quoteChartBox = Titanium.UI.createView({
    width: 300,
    left: 10,
    top: 280,
    height: 300,
    borderRadius: 5,
    backgroundImage: 'images/gradient.png'
});

scrollArea.add(quoteChartBox);

// This small view just adds 10px of padding to the bottom of
// our scrollview (scrollArea)
var emptyView = Titanium.UI.createView({
    height: 10,
    top: 580
});

scrollArea.add(emptyView);

// Add the scrollview to the window
win1.add(scrollArea);

// Open the window
win1.open();
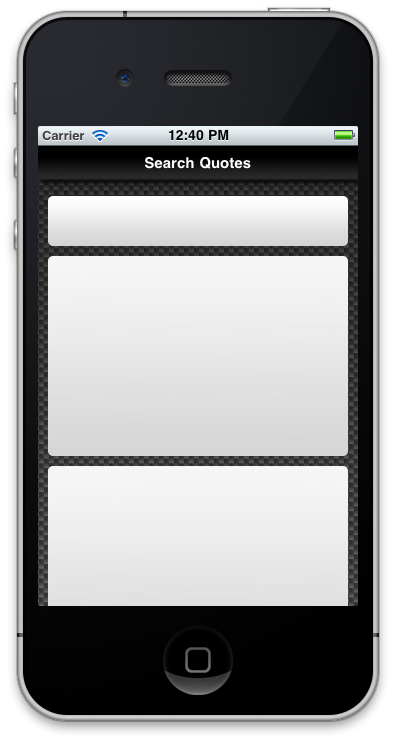
What we've done above is created a basic, nicely styled shell for our application. There's a space at the top to create a search field, and two more empty boxes to place our stock information and our chart. All of this has been added to a ScrollView so we can easily scroll our app to view any information that is hidden from the bounds of the screen. Run your app in the iPhone emulator and it should now look like the image below:
Step 3: Creating the Search Field
Our next step is to create the text field and search button that the user will use to interact with our application by providing a stock symbol (e.g. APPL for Apple Computers) to search upon. Enter in the following code before the line where you added your searchBox object to the scrollArea (line 39).
// This is the input textfield for our stock code
var txtStockCode = Titanium.UI.createTextField({
    hintText: 'Stock code, e.g. APPL',
    borderWidth: 0,
    width: 200,
    left: 10,
    height: 30,
    font: {fontSize: 14, fontColor: '#262626', fontFamily: 'Helvetica'},
    autoCorrect: false,
    autocapitalization: Titanium.UI.TEXT_AUTOCAPITALIZATION_ALL
});

searchBox.add(txtStockCode);

// Create the search button from our search.png image
var btnSearch = Titanium.UI.createButton({
    backgroundImage: 'images/search.png',
    width: 80,
    height: 30,
    right: 10,
    borderRadius: 3
});

// Add the event listener for this button
btnSearch.addEventListener('click', searchYQL);

searchBox.add(btnSearch);
What we accomplished above is to create the two input components necessary for the user to input data (a stock quote in this case) and to perform an action based on that input by tapping the search button. If you hadn't noticed already, our btnSearch button object has an event listener that will fire whenever the user taps it and call a function named searchYQL. If you were to run the app in the emulator now, you would end up with a big red error screen as we haven't created this function yet. Let's do that now.
Enter in the following at the top of your app.js file, after the Titanium.UI.setBackgroundColor line:
// This function is called on search button tap, it will query YQL for our stock data
function searchYQL() {
}
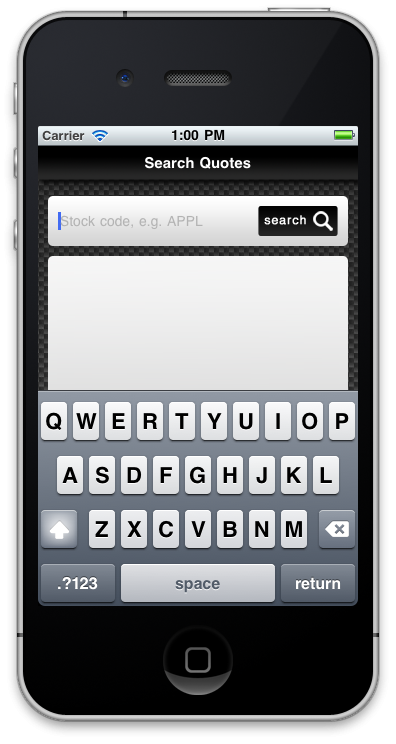
If you haven't already done so, save your app.js file and run it in the emulator. You should see a screen similar to the one below:
Step 4: Searching For Stock Quotes Using Yahoo YQL
Now, before we search YQL for information about our stocks, we need to create some labels and images that will go into our quoteInfoBox and present the information to the user. This is a pretty straight-forward process. The following code should be placed before you add the quoteInfoBox to the scrollArea on line 93.
// Add the labels and images we need to show some basic stock information
var lblCompanyName = Titanium.UI.createLabel({
    width: 280,
    height: 30,
    left: 10,
    top: 10,
    color: '#003366',
    font: {fontSize: 17, fontWeight: 'bold', fontFamily: 'Helvetica'},
    text: 'No company selected'
});
quoteInfoBox.add(lblCompanyName);

var lblDaysLow = Titanium.UI.createLabel({
    width: 280,
    height: 20,
    left: 10,
    top: 50,
    color: '#000',
    font: {fontSize: 14, fontWeight: 'bold', fontFamily: 'Helvetica'},
    text: 'Days Low: '
});

quoteInfoBox.add(lblDaysLow);

var lblDaysHigh = Titanium.UI.createLabel({
    width: 280,
    height: 20,
    left: 10,
    top: 80,
    color: '#000',
    font: {fontSize: 14, fontWeight: 'bold', fontFamily: 'Helvetica'},
    text: 'Days High: '
});

quoteInfoBox.add(lblDaysHigh);

var lblLastOpen = Titanium.UI.createLabel({
    width: 280,
    height: 20,
    left: 10,
    top: 110,
    color: '#000',
    font: {fontSize: 14, fontWeight: 'bold', fontFamily: 'Helvetica'},
    text: 'Last Open: '
});

quoteInfoBox.add(lblLastOpen);

var lblLastClose = Titanium.UI.createLabel({
    width: 280,
    height: 20,
    left: 10,
    top: 140,
    color: '#000',
    font: {fontSize: 14, fontWeight: 'bold', fontFamily: 'Helvetica'},
    text: 'Last Close: '
});

quoteInfoBox.add(lblLastClose);

var lblVolume = Titanium.UI.createLabel({
    width: 280,
    height: 20,
    left: 10,
    top: 170,
    color: '#000',
    font: {fontSize: 14, fontWeight: 'bold', fontFamily: 'Helvetica'},
    text: 'Volume: '
});

quoteInfoBox.add(lblVolume);
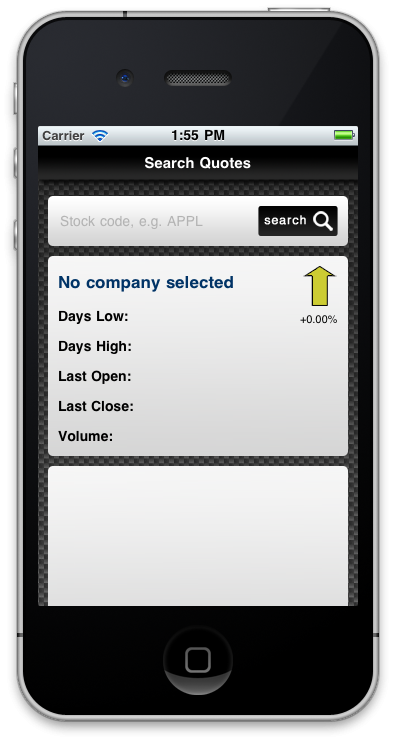
Once your labels and our stock movement image arrow has been added, you should be able to run the emulator and end up with a screen like this one:
Now let's do something useful with this layout and fill it with stock data from Yahoo! To do that we need to expand our empty searchYQL() function and perform a search against the Yahoo YQL finance data tables using a combination of YQL syntax and Titanium's Titanium.Yahoo.yql() method.
// This function is called on search button tap. It will query YQL for our stock data
function searchYQL() {

  // Do some basic validation to ensure the user has entered a stock code value
  if(txtStockCode.value != '')
  {
    txtStockCode.blur(); //hides the keyboard

    // Create the query string using a combination of YQL syntax and the value of the txtStockCode field
    var query = 'select * from yahoo.finance.quotes where symbol = "' + txtStockCode.value + '"';

    // Execute the query and get the results
    Titanium.Yahoo.yql(query, function(e) {
        var data = e.data;

        // Iff ErrorIndicationreturnedforsymbolchangedinvalid is null then we found a valid stock
        if(data.quote.ErrorIndicationreturnedforsymbolchangedinvalid == null)
        {
            //we have some data! let's assign it to our labels etc
            lblCompanyName.text = data.quote.Name;
            lblDaysLow.text = 'Days Low: ' + data.quote.DaysLow;
            lblDaysHigh.text = 'Days High: ' + data.quote.DaysHigh;
            lblLastOpen.text = 'Last Open: ' + data.quote.Open;
            lblLastClose.text = 'Last Close: ' + data.quote.PreviousClose;
            lblVolume.text = 'Volume: ' + data.quote.Volume;
            lblPercentChange.text = data.quote.PercentChange;

            //if the previous close was equal or higher than the opening price, the
            //stock direction is up... otherwise it went down!
            if(data.quote.PreviousClose >= data.quote.Open)  {
                imgStockDirection.image = 'images/arrow-up.png';
            }
            else  {
                imgStockDirection.image = 'images/arrow-down.png';
            }

        }
        else
        {
            //show an alert dialog saying nothing could be found
            alert('No stock information could be found for ' + txtStockCode.value + '!');
        }
    });
  }
  else
  {
    alert('You must provide a stock code to search upon, e.g. AAPL or YHOO');
  }
}
So, what is actually going on here within the searchYQL() function? First, we're doing a very basic validation on the text field to ensure the user has entered in a stock quote before pressing search. If a stock quote is found, we use the blur() method of the text field to ensure the keyboard becomes hidden. The meat of the code revolves around creating a Yahoo YQL query using the correct syntax and providing the text field value as the symbol parameter. This YQL query is simply a string, joined together using the + symbol much as you would do with any other string manipulation in JavaScript. We then execute our query using the Titanium.Yahoo.yql() method, which returns the results within the 'e' object of the inline function.
The data within the 'e' object is simply JSON, a common, fast data format fast becoming ubiquitous on the web and with all the major API's. Using this data is a matter of simple dot notation. In our code, we're first checking the property called data.quote.ErrorIndicationreturnedforsymbolchangedinvalid in order to ensure that the symbol the user entered was a valid stock code. If it is, we can then assign all the values to our labels! Lastly, we do a check to see whether the stock price closed higher than it opened, if so then we can set the stock movement image to a green "up" arrow, indicating it rose in value. If it fell in value, we can move the image to a red, "down" arrow.
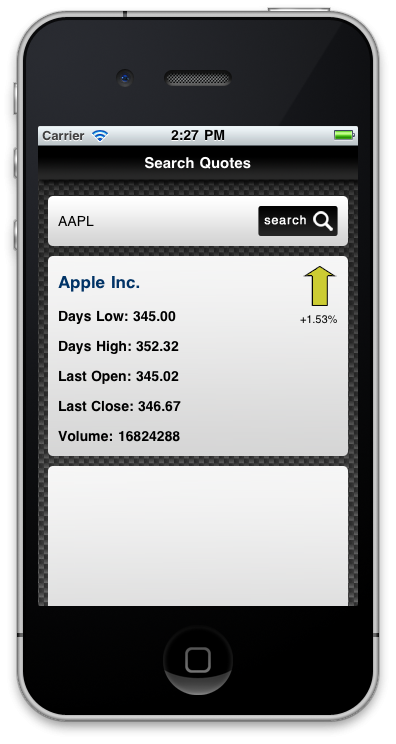
Run the code in your emulator and enter in a code, such as AAPL. You should get the following screen with similar data returned after pressing the search button:
Next Time. . .
In the next tutorial in this series, to be published next week, I'll walk you through setting up the Raphael JS charting library, setting up a web view to display the chart, collecting historical stock data with YQL, and, of course, actually drawing a graphical representation on screen for the user! Be sure to subscribe via RSS or Twitter if you'd like to be notified when the next post is released!

Comments