In this tutorial series, I will be teaching you how to build a stock quote application with Raphael JS, Titanium Mobile, and Yahoo's YQL web service. Raphael JS charts will be used to graphically present the stock quote information, Titanium Mobile will be used to cross-compile a native iOS app, and YQL data tables will actually retrieve the stock information.
Where We Left Off. . .
The last tutorial in this series introduced YQL and Raphael JS as components of a Titanium Mobile application and demonstrated the steps necessary to create our Stock Quote app interface and search for stock quotes using YQL. In this tutorial, we'll finish out our stock quote app by adding in Raphael JS charts that plot historical data obtained using YQL.
Step 5: Setting up the Raphael JS Charting Library
Before we can start to implement a chart into our Stocks app, we have to first download the Raphael libraries, including the charting JavaScript files we'll need to create our bar graph. To do this, follow these steps:
- Download the main RaphaelJS library from http://raphaeljs.com
(Direct link: http://github.com/DmitryBaranovskiy/raphael/raw/master/raphael-min.js). - Download the main Charting library from http://g.raphaeljs.com
(Direct link: http://github.com/DmitryBaranovskiy/g.raphael/blob/master/g.raphael-min.js?raw=true) and any other charting libraries you wish to use. For this example we'll just be implementing the Bar Chart, which is here: http://github.com/DmitryBaranovskiy/g.raphael/blob/master/g.bar-min.js?raw=true - Put your downloaded files into your "Resources" directory. You could put them into a subfolder if you wish, but bear in mind you'd have to ensure your references in the following steps are correct.
- The next step is to rename your raphael-min.js file to something like raphael-min.lib. The main reason here is that if your file is a known JavaScript file (as in it ends in '.js'), the JSLint validator in Titanium will try to validate the Raphael JS library and fail, causing Titanium to lock up - meaning you won't be able to run your app!
Now run your app again, you may get a few validation warnings appear in the Titanium Console from the Raphael code, but everything should still be running and working as it was in Step 4.
Step 6: Implementing a WebView for the Raphael JS Chart
We are going to use a WebView to present our chart to the screen. Let's add a WebView now, and point it to a HTML file that we will create in the next step. We'll also add a label to describe the WebView. This code should go before the line scrollArea.add(quoteChartBox);, which will be near the end of your code file:
// Add the chart label and webview we need to show our raphael chart
var lblChartName = Titanium.UI.createLabel({
    width: 280,
    height: 30,
    left: 10,
    top: 10,
    color: '#003366',
    font: {fontSize: 17, fontWeight: 'bold', fontFamily: 'Helvetica'},
    text: '12 Week Historical Chart'
});
quoteChartBox.add(lblChartName);

var webview = Titanium.UI.createWebView({
    width: 280,
    height: 240,
    left: 10,
    top: 40,
    url: 'chart.html'
});

quoteChartBox.add(webview);

var twelveWeekStartLabel = Titanium.UI.createLabel({
    width: 100,
    left: 10,
    top: 285,
    height: 10,
    textAlign: 'left',
    font: {fontSize: 9, fontFamily: 'Helvetica'},
    color: '#000'
});

quoteChartBox.add(twelveWeekStartLabel);

var twelveWeekEndLabel = Titanium.UI.createLabel({
    width: 100,
    right: 10,
    top: 285,
    height: 10,
    textAlign: 'right',
    font: {fontSize: 9, fontFamily: 'Helvetica'},
    color: '#000'
});

quoteChartBox.add(twelveWeekEndLabel);
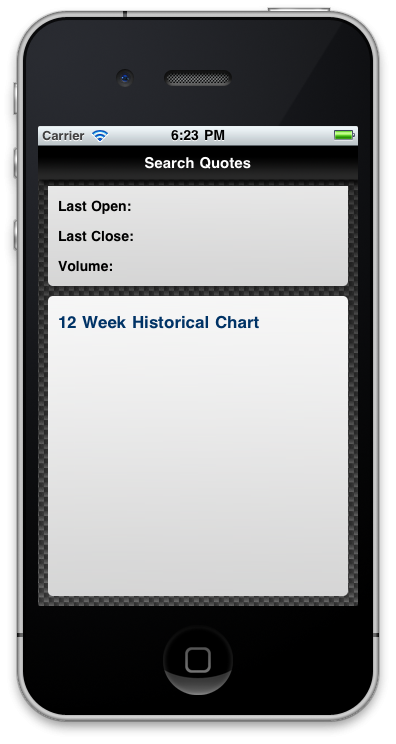
Run your app in the emulator and you should now see an empty WebView and a label in the third box. You will have to scroll to the end of screen to see the third box in its entirety.
Step 7: Creating the Raphael Chart HTML & Event Listener
Now we are going to create an HTML file that includes all of the necessary Raphael libraries, and contains an empty <div> tag where our chart will be rendered to. Create a new, blank HTML file called chart.html and type in the following code:
<html>
<head>
 <title>RaphaelJS Chart</title>
 <meta name="viewport" content="width=device-width, initial-scale=1.0"/>
 <script src="raphael-min.lib" type="text/javascript" charset="utf-8"></script>
 <script src="g.raphael-min.js" type="text/javascript" charset="utf-8"></script>
 <script src="g.bar-min.js" type="text/javascript" charset="utf-8"></script>
</head>
<body>
  <div id="chartDiv" style="width:280px; height: 240px; margin: 0"></div>
  <script>
   //This registers an event listener that you can call
   //from within the app.js file
   Ti.App.addEventListener('renderChart', function(chartData) {
     var r = Raphael("chartDiv");
     r.g.barchart(0, 0, 270, 240, chartData.data, 0, {type: "sharp"}).hover(fin, fout);
   });
  </script>
</body>
</html>
Save your chart.html file in your "Resources" directory if you have not already done so. What this code is doing is creating a basic HTML template, including the raphael libraries you downloaded earlier, and creating a div called chartDiv, which is what Raphael will render our chart into. With the script tags underneath this div, we are creating a standard Titanium event listener, which is going to execute whenever an event called renderChart is fired from somewhere within Titanium. This function will take any passed data and pull that into Raphael for rendering. The r.g.barchart() function takes the following list of parameters in order to create the chart (in order):
Left, Top, Width, Height, Data (an array of single-value arrays), Style Attributes. The hover function at the end of this method tells Raphael to render a fade-in, fade-out, and show column values when a bar line is tapped.
Step 8: Obtaining YQL Historical Data And Passing It to chart.html
It is now time for the final step in our tutorial: rendering the chart! Go into your searchYQL function, and after your previous code for obtaining the stock data, type in the following:
// Get today's date and break that up into month, day, and year values
    var currentTime = new Date();
    var month = currentTime.getMonth() + 1;
    var day = currentTime.getDate();
    var year = currentTime.getFullYear();

    //now create the two dates formatted in yyyy-mm-dd format for YQL query
    var today = year + '-' + month + '-' + day; //today

    //get the date 12 weeks ago.. 1000 milliseconds * seconds in minute * minutes in hour * 2016 hours (12 weeks, 12 * 7 days)
    var currentTimeMinus12Weeks = new Date((new Date()).getTime() - (1000 * 60 * 60 * 2016));
    var month2 = currentTimeMinus12Weeks.getMonth() + 1;
    var day2 = currentTimeMinus12Weeks.getDate();
    var year2 = currentTimeMinus12Weeks.getFullYear();
    var todayMinus12Weeks = year2 + '-' + month2 + '-' + day2; //today - 12 weeks

    //perform a historical query for the stock code for our chart
    var query2 = 'select * from yahoo.finance.historicaldata where symbol = "' + txtStockCode.value + '" and startDate = "' + todayMinus12Weeks + '" and endDate = "' + today + '"';

    //execute the query and get the results
    Titanium.Yahoo.yql(query2, function(e) {
        var data = e.data;
        var chartData = [];

        //loop our returned json data for the last 12 weeks
        for(var i = (data.quote.length -1); i >= 0; i--)
        {
            //push this timeframes close value into our chartData array
            chartData.push(parseFloat(data.quote[i].Close));

            if(i == (data.quote.length - 1)) {
              twelveWeekStartLabel.text = data.quote[i].Close;
            }
            if(i == 0) {
              twelveWeekEndLabel.text = data.quote[i].Close;
            }
        }

        //raphael expects an array of arrays so lets do that
        var formattedChartData = [chartData];

        //fire an event that will pass the chart data across to the chart.html file
        //where it will be rendered by the Raphael JS chart engine
        Ti.App.fireEvent('renderChart', { data: formattedChartData, startDate:  todayMinus12Weeks, endDate: today } );
    });
The final block of code is doing another YQL call, but this time the call is to the service data table called yahoo.finance.historicaldata which is going to return to us a JSON array of historical data values. In our case, we are searching on the last twelve weeks of data for the selected stock code. Once we have this data, it is simply a case of iterating through it backwards (the oldest item is last in the JSON array), and pushing the Close property value into our new array called chartData. Raphael will use the float values to render the values on the bar chart. Finally, we use Ti.App.fireEvent to fire the renderChart event that we created in the previous step, passing our values through to the chart.html file as we do so!
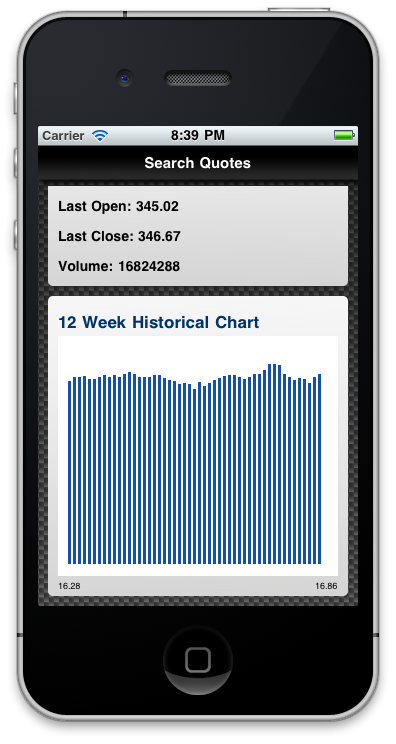
Run the application in your simulator now and you should end up with a chart being presented in our third box!
Conclusion
Well, as Porky says, that's all folks! We have covered a lot in this tutorial, including querying and utilising data from Yahoo YQL, implementing a third party library in Raphael JS Charts, and building a useful, nicely designed app with Titanium Mobile while we were at it. I hope you've enjoyed following along and I'd love to see what else you do with Appcelerator Titanium. It really is a great mobile platform. Have fun coding!

Comments