What Is New Relic Synthetics?
New Relic Synthetics is like a crash test dummy for your software. Synthetics allows you to configure a myriad of tests to run against your website and services from around the world on a recurring schedule. These tests help you find problems and fix them before your customers experience them.
Or, as the fun product video above says, "Your app needs a consistent workout that happens everyday like clockwork and Synthetics is the tough, loving coach to make sure it happens (slaps robot thigh)."

In this tutorial, I'll give you a general overview of the Synthetics product and walk you through configuring monitors and browsing reports.
Feature Overview
Synthetics helps you ensure that important web services are in place and working error-free with customized, automated testing. Whether it's once a minute in San Francisco, or once a day in Dublin, you choose the frequency and location of your tests based on business function and need.
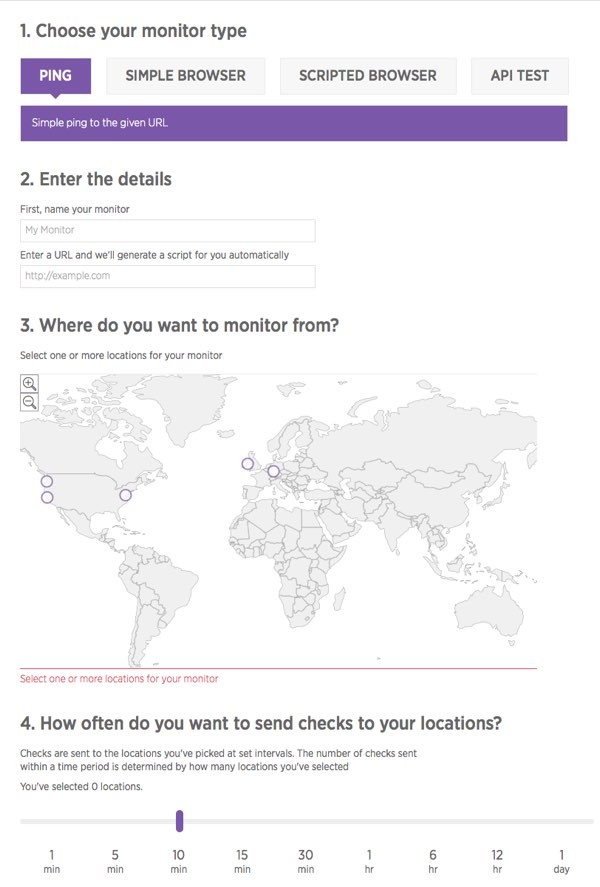
Here's an example configuration form for building an automated monitoring test (I'll go into more detail further below):
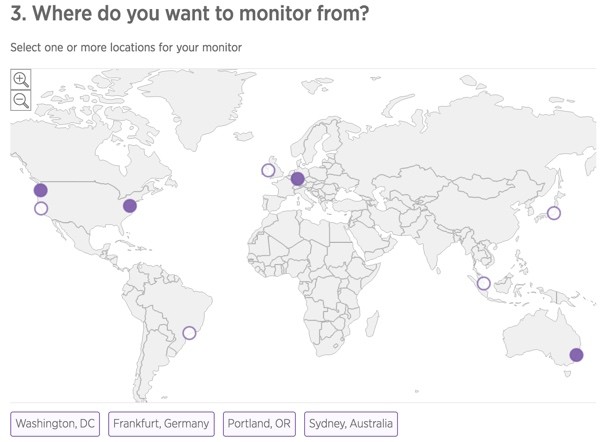
Test From Around the World
Your site may be working in Singapore, but is it also available in São Paulo? Find out in seconds with simple ping or website browser tests. View your software's simulated performance in Washington DC, Portland, San Francisco, São Paulo, Dublin, Singapore, Tokyo, and Sydney.

Real Browser Engine Data
Synthetics lets you view detailed metrics including page load times and individual assets using a real browser engine, so you can identify and address problems that are happening in real time.
API Testing
Script automated calls to your APIs to make sure all output and system responses are successfully returned from multiple locations around the world.
Integration With Other New Relic Services
Synthetics easily integrates with other New Relic products like Insights for a consistent experience and optimal data reporting. Also, get automatic transaction traces through New Relic APM, its back-end app server monitoring tool.
To learn more, watch the brief product tour below:
Powerful Troubleshooting Tools
You can use New Relic Synthetics' in-depth troubleshooting metrics to resolve problems and bugs in your app. Synthetics notifies you when something goes wrong, and points out exactly what needs to be fixed so you can restore and deliver functioning and reliable software to your end users.
Performance & Response Times
Understand how individual asset performance is affected through average page load time and size reporting:
Get a list of system downtimes and failures for your critical transactions. View individual downtime incidents by detail to identify trends and address problems as they occur.
Error Screenshots
See the same issues your users are experiencing with your software through actual screenshots of the errors that are occurring:
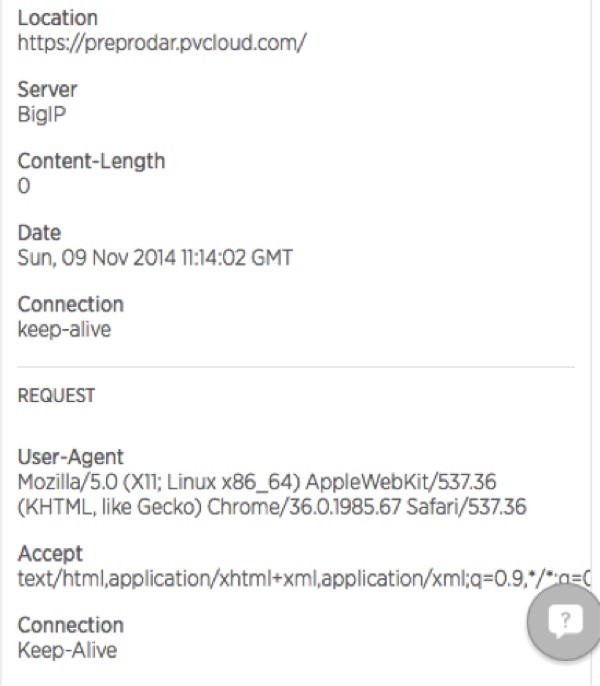
HTTP Request and Response Headers
Receive actionable data including all request and response headers to help debug and fix your software:
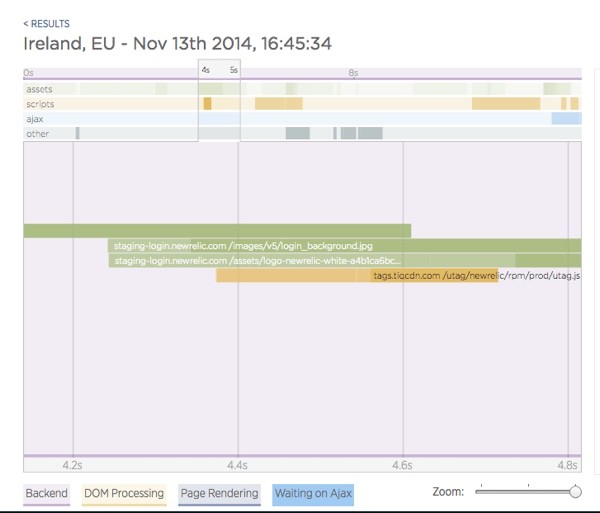
Waterfall Charts
Synthetics provides detailed metrics with page load time for all individual assets into one, easy-to-read waterfall chart. Easily scroll through different time periods on your waterfall chart:
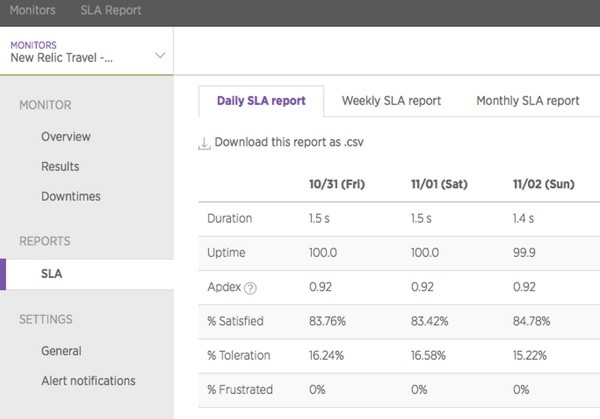
SLA Reporting
Detailed SLA reports help you maintain customer satisfaction. These reports summarize Apdex scoring for benchmarks and performance thresholds and overall uptime:
3-Strike Alert Threshold
Synthetics only sends alerts after running a test three times and getting the same error result (although you're only charged for one test). When you do get an alert, it's real.
You can learn more at the New Relic Synthetics feature overview or check out the Synthetics Datasheet (pdf) and BloomThat Customer Case Study (pdf). Now, let's walk through using the product.
Getting Started With New Relic Synthetics
Once you've signed up for New Relic, you can begin using the free Synthetics trial. Let's begin by creating some monitors.
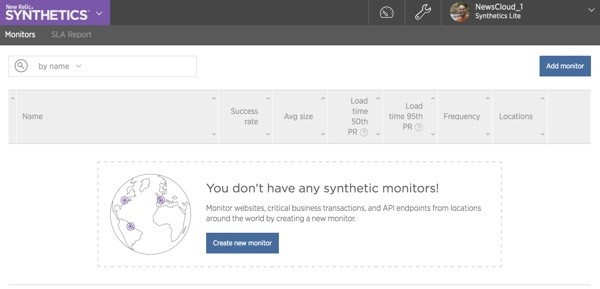
Creating Monitors
This is the Monitor dashboard—it's very straightforward. We'll go ahead and click the Add monitor button to the upper right:
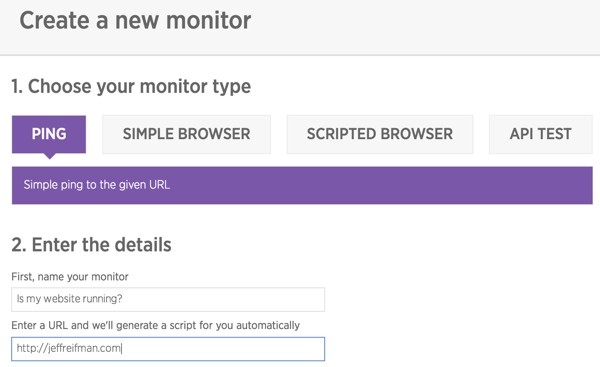
Ping Monitors
The first type of monitor is a simple ping. It tells us that our website is up. We provide a friendly name for the monitor and a URL for testing:
We can easily select geographic regions to run the test from. Synthetics currently offers nine.
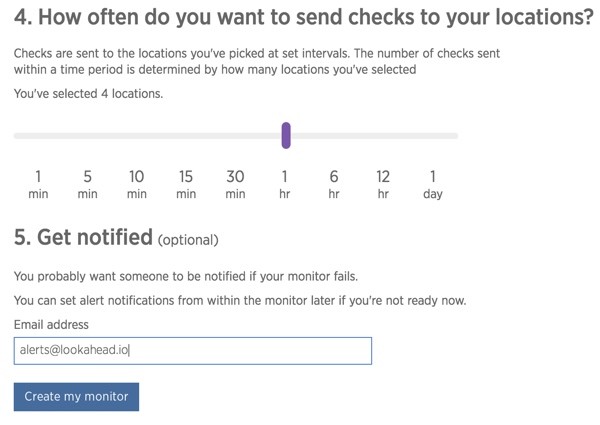
Next, we choose the frequency for these checks with a simple slider, and provide an email address for alerts:
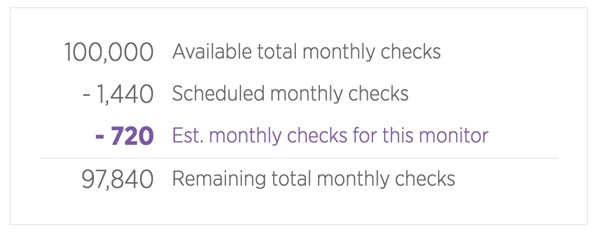
Synthetics makes it easy to see how our new monitor is affecting our overall budget for checks:
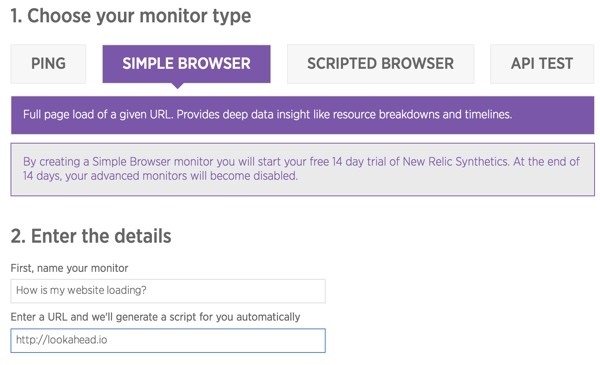
Simple Browser Monitor
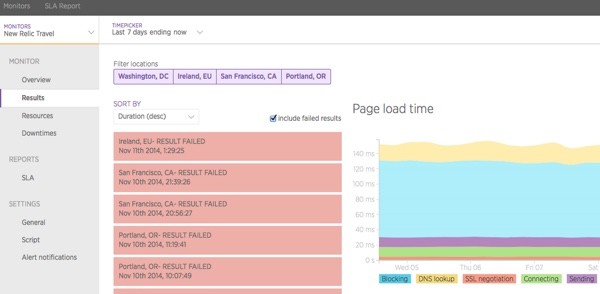
The next type of monitor is a Simple Browser test. We provide a friendly name and URL, and Synthetics will regularly provide a deep dive of analytic results:
Here's an example of the results you'll receive:
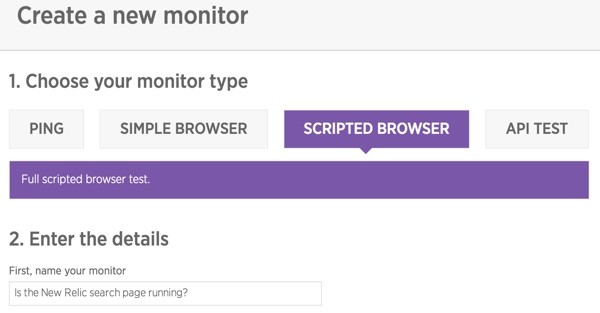
Scripted Browser
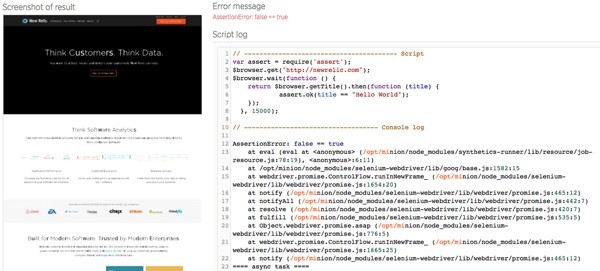
The Scripted Browser test allows you to write JavaScript-based automated tests against your website:
Its scripting environment is like node.js lite. Almost everything you'd expect to find in a node.js environment is available.
When the scripts run, you'll see a screenshot and log of test results:
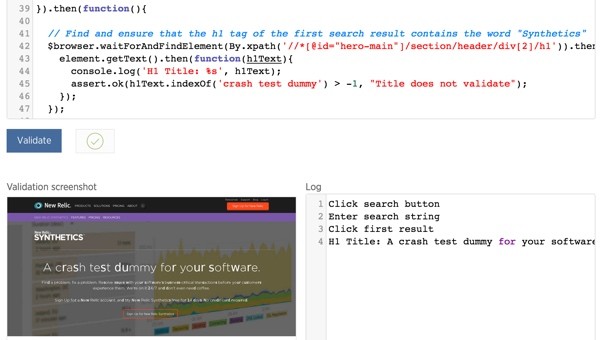
Here's an example script included as a framework to give you an idea of how you would code your own tests:
/**
 * Welcome to the Synthetics JavaScript IDE - Browser Edition
 * You can think of it like node.js lite. Everything you'd expect to find in a
 * node.js environment is also available here, with a few notable exceptions:
 *
 * Feel free to explore, or check out the full documentation
 * https://docs.newrelic.com/docs/synthetics/new-relic-synthetics/scripting-monitors/writing-scripted-browsers
 * for details.
 */

//This script will go to the New Relic home page, click the search button to open a search field, click the first set of search results, and verify that H1 contains the string “synthetics"
var By = $driver.By;
var assert = require('assert');

// Load the New Relic home page
$browser.get("http://newrelic.com").then(function(){

  // Click the search button to open up a text field
  console.log('Click search button');
  return $browser.findElement(By.id("search-start")).click();

}).then(function(){

  // Enter the string "synthetics" then press the enter key
  console.log('Enter search string');
  return $browser.waitForAndFindElement(By.id("st-search-input")).then(function(element) {
    element.sendKeys("synthetics\r");
  });

}).then(function(){

  // Use the xPath of the first result on the search results page and then click it. You can also use CSS classes or IDs, but our element does not have these, so we will use the xPath
  // The xPath can be obtained in the Chrome inspector via the context menu
  console.log('Click first result');
  return $browser.waitForAndFindElement(By.xpath('//*[@id="st-results-container"]/div/div[2]/div[2]/div[1]/div[1]/h3/a')).then(function(element){
    element.click();
  });

}).then(function(){

  // Find and ensure that the h1 tag of the first search result contains the word "Synthetics"
  $browser.waitForAndFindElement(By.xpath('//*[@id="hero-main"]/section/header/div[2]/h1')).then(function(element){
    element.getText().then(function(h1Text){
      console.log('H1 Title: %s', h1Text);
      assert.ok(h1Text.indexOf('crash test dummy') > -1, "Title does not validate");
    });
  });

});
API Testing
You can also use Synthetics for API level testing. Again, you can use Synthetics' JavaScript environment to automate tests against your web services. Here's the included sample test script:
var assert = require('assert'),

// Modify these values for instant gratification:
//------------------------------------------------------------------------------
  SERVICE_URL = 'http://httpbin.org',
  AUTH_USER = 'superbot',
  AUTH_PASSWORD = 'supersecret';
//------------------------------------------------------------------------------

// Example POST with JSON payload, expecting a 200 OK response
$http.post(SERVICE_URL + '/post',
  // Post data
  {
    json: {
      username: AUTH_USER,
      password: AUTH_PASSWORD
    }
  },
  // Callback
  function (err, response, body) {
    if (err) throw new Error('Authentication error: ' + err.message);

    assert.ok(response.statusCode == 200, 'Expected 200 OK response');

    // Extract an API token from the JSON response to use as a header in
    // subsequent requests
    var token = body.token;

    $http.get(SERVICE_URL + '/get', function (err, response, body) {
      if (err) throw new Error('Error getting widgets: ' + err.message);

      // Validate the response code
      assert.ok(response.statusCode == 200, 'Expected 200 OK response');

      // Expect at least 10 widgets
      assert.ok(body.widgets.length >= 10, 'Received less than 10 widgets back');
    });
  }
);

console.log('If we got this far: SUCCESS!');
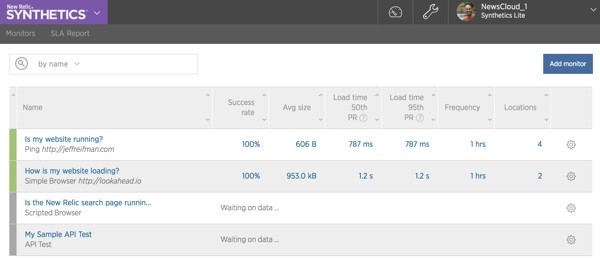
Monitor Dashboard
Once you've set up several tests, you can monitor, edit and review them in the dashboard:
Reporting
Here are some of the kinds of detail and summary reports you can get from Synthetics on a regular basis. The SLA overview report showing historical Apdex and uptime:
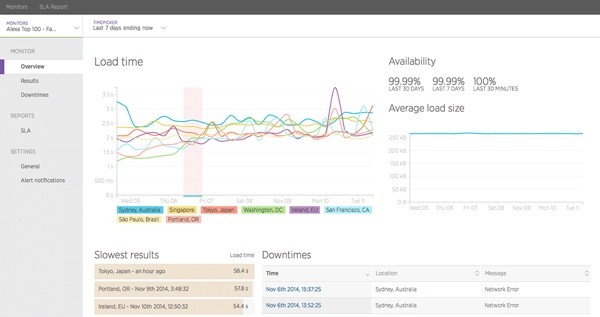
Load time reports—the first from the New Relic demonstration overview:
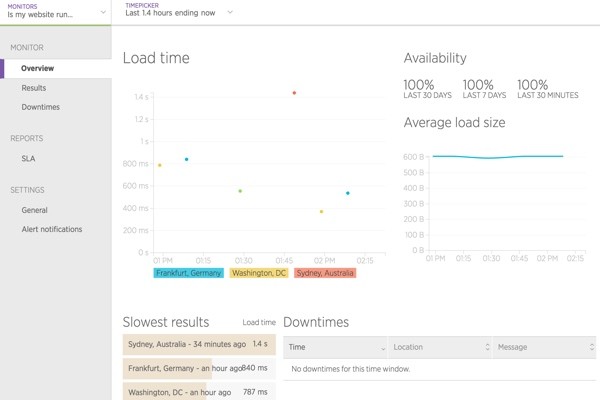
And a simpler report from my own test monitor:
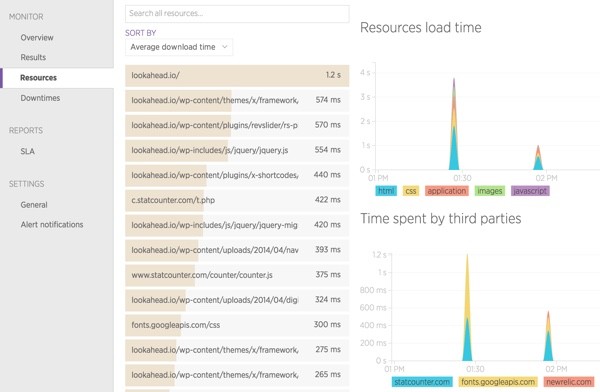
You can study page load and network timings from around the world:
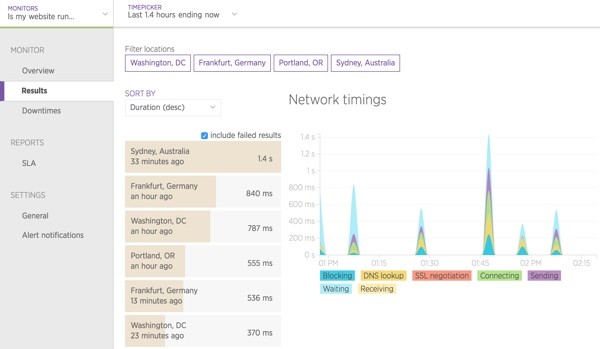
And get resource summaries for your site to help you debug performance issues in more detail:
What's Next?
I hope you've enjoyed learning about New Relic Synthetics. It's obviously a useful and powerful tool for any serious publisher or service provider. I was most impressed by the simplicity and power of the user interface.
For $69/month, you can receive 10,000+ advanced checks and unlimited data retention. You can also request a consultation with a New Relic Synthetics specialist for a product demo or quote.
Please feel free to post your questions and comments below. You can also reach me on Twitter @reifman or email me directly.

Comments