Firefox Developer Edition was released by Mozilla during the tenth anniversary celebration of Firefox last year. Recently, 64-bit builds of Firefox Developer Edition have also been made available for Windows, Linux and Mac OS X. Firefox Developer Edition provides easy accessibility for a wide array of developer tools which help in making debugging easy and help in faster and more professional development. You can download the latest version of the Firefox Developer Edition from here. Let us have a look at some of the great features of the Firefox Developer Edition.
WebIDE

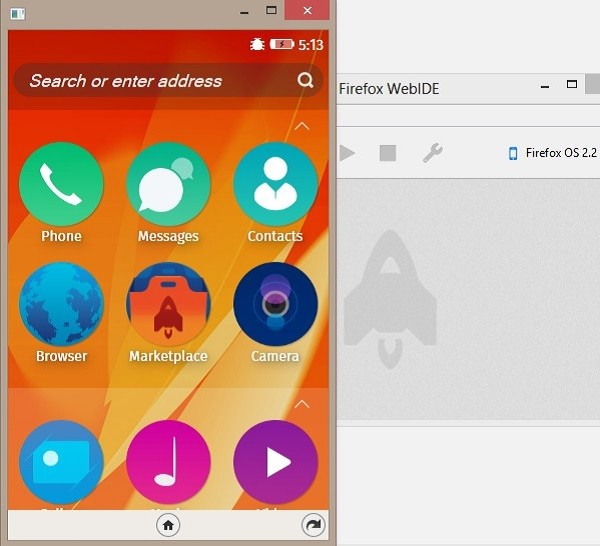
With WebIDE, you can create, edit, test or debug web apps by running them on the Firefox OS simulator. If you are creating a new web app, it also creates a basic app boilerplate or a more complete boiler plate for you along with a proper directory structure. WebIDE also allows you to connect Firefox Devtools to many other web browsers such as Safari (iOS), Firefox (Android) and Chrome (Android).
Responsive Design View

Responsive Design View in Firefox can be invoked by pressing Ctrl + Shift + M. You can check the responsiveness of your web application with the help of this utility. It offers a number of options such as setting the size of the device that you want to emulate, rotating the screen (shift from portrait to landscape mode), simulate touch events and taking screenshot of the webpage in the responsive mode.
Eyedropper Tool

The Eyedropper Tool is a really awesome tool which helps you to know the hexadecimal value of any color in a webpage (just like the eyedropper tool in Photoshop). This helps in finding the color of any element or image which having to browse through it's code via Element Inspector. Clicking on the color copies it's value to your clipboard!
Browser Inspector

We all have worked with the Element Inspector, now what the hell is Browser Inspector? Well, Browser Inspector is used for debugging the Firefox Browser itself. If you want to change the color of the URL bar or for instance change the curve of the tabs with non-persistent results, then you can do that through the Browser Inspector. Although the same result can be achieved through Scratchpad, Browser Inspector is great if you are not a Firefox Developer or if you just want to test out your changes!
3D View

Now this, I feel is the most awesome feature of Firefox Developer Tools. You can look at the 3D rendering of any website, where each elevation block represents an element, in order of their nesting in the website code. This helps you to know which elements are nested in which element.You can access the 3D View by pressing Ctrl + Shift + C and then selecting the box shaped icon on the right hand side of the newly opened panel.
Scratchpad

You can open the Scratchpad by pressing Shift + F4. Scratchpad can be used to run clusters of javascript code and edit, run and examine the results. The way it differs from the Browser Console is that Browser Console, is designed for interpreting a single line of code at a time, but with Scratchpad you can work with larger chunks of code executing it in various ways depending on how you want to use the output.
Conclusion
The Firefox Developer Edition provides a wide array of tools for creating, debugging, performance monitoring, debugging the browser and extending the DevTools themselves. Explaining all the tools is beyond the scope of this article. However, you can have a look at the complete list of tools here. We hope that the introduction to the above mentioned tools help you in your daily web development chores.


Comments