Recently at //BUILD/ 2015 we announced Vorlon.js—an open source,
extensible, platform-agnostic tool for remotely debugging and testing your
JavaScript. I had the opportunity to create Vorlon.js with the help of some
talented engineers and tech evangelists at Microsoft (the same guys that
brought you Babylon.js).
Vorlon.js is powered by Node.js, Socket.IO, and late-night coffee. I would like to share with you why we made it and how to incorporate it into your own testing workflow, as well as sharing some more details on the art of building a JavaScript library like it.
Why Vorlon.js?
Vorlon.js helps you remotely load, inspect, test and debug JavaScript code running on any device with a web browser. Whether it is a game console, mobile device, or even an IoT- connected refrigerator, you can remotely connect up to 50 devices and execute JavaScript in each or all of them.
The idea here is that dev teams can also debug together—each person can write code, and the results are visible to all. We had a simple motto in this project: No native code, no dependency to a specific browser, only JavaScript, HTML and CSS running on the devices of your choice.
Vorlon.js itself is a small web server you can run from your local machine, or install on a server for your team to access, that serves the Vorlon.js dashboard (your command center) and communicates with the remote devices.
Installing the Vorlon.js client in your web site or app is as easy as adding a single script tag. It's also extensible, so devs can write plug-ins that add features to both the client and the dashboard, such as feature detection, logging, and exception tracking.
So why the name? There are actually two reasons. The first one is because I am just crazy about Babylon 5 (the TV show). Based on this, the second reason is because the Vorlons are one of the wisest and most ancient races in the universe and thus, they are helpful as diplomats between younger races. Their helpfulness is what inspired us: for web devs, it's still just too hard to write JavaScript that works reliably in the various devices and browsers. Vorlon.js seeks to make it just a little easier.
You Mentioned Vorlon.js Has Plug-ins?
Vorlon.js has been designed so that you can extend the dashboard and client application easily by writing or installing additional plugins. You can resize or add extra panes to the dashboard which can communicate bidirectionally with the client application. There are three plug-ins to begin with:
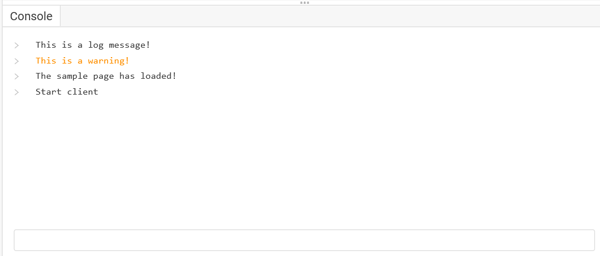
Console
Logging: The console tab will stream console messages from the client to the
dashboard that you can use for debugging. Anything logged with console.log(), console.warn()
or console.error() will appear in the dashboard. Like the F12 Dev Tool
DOM explorer, you can see the DOM tree, select a node (which will be
highlighted on the device, and update or add new CSS properties).
Interactivity: You can also interact with the remote webpage by typing code into the input. Code entered will be evaluated in the context of the page.
DOM Explorer
The DOM inspector shows you the DOM of the remote webpage. You can inspect the DOM, clicking on nodes to highlight them in the host webpage, and if you select one you can also view and modify its CSS properties.

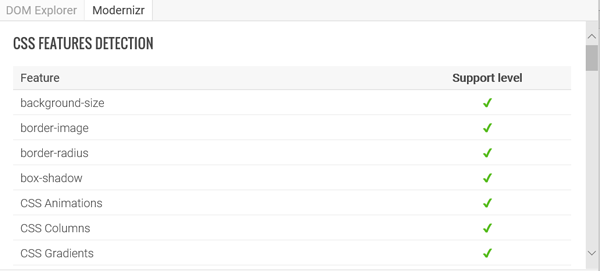
Modernizr
The Modernizr tab will show you the supported browser features as reported by Modernizr. You can use this to determine what features are actually available. This might be particularly useful on unusual mobile devices, or things like games consoles.
How Do I Use It?
From your node command line, just execute this:
$ npm i -g vorlon
$ vorlon
Now you have a server
running on your localhost on port 1337. To get access to the dashboard, just navigate to http://localhost:1337/dashboard/SESSIONID, where SESSIONID is the
id for the current dashboard session. This can be any string you want.
You have then to add a single reference in your client project:
<script src="http://localhost:1337/vorlon.js/SESSIONID"></script>
Please note that SESSIONID can be omitted and in this case, it will be
automatically replaced by "default".
And that's it! Now your client will send debug information to your dashboard seamlessly. Let's now have a look at an example using a real site.
Debugging Babylonjs.com Using Vorlon.js
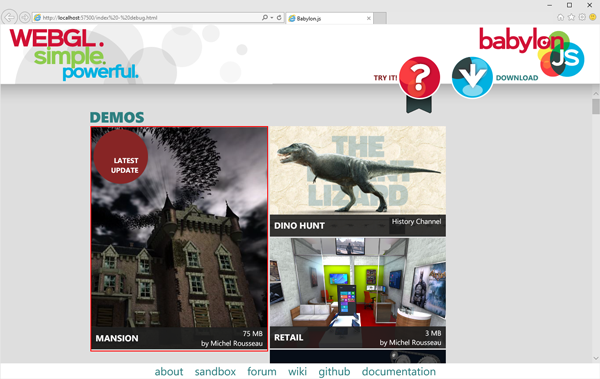
Let's use http://www.babylonjs.com/ for our example. First,
I have to launch my server (using node start.js inside the /server folder).
Then, I just have to add this line to my client site:
<script src="http://localhost:1337/vorlon.js"></script>
Because I am not defining
a SESSIONID, I can just go to http://localhost:1337/dashboard. The
dashboard looks like this:
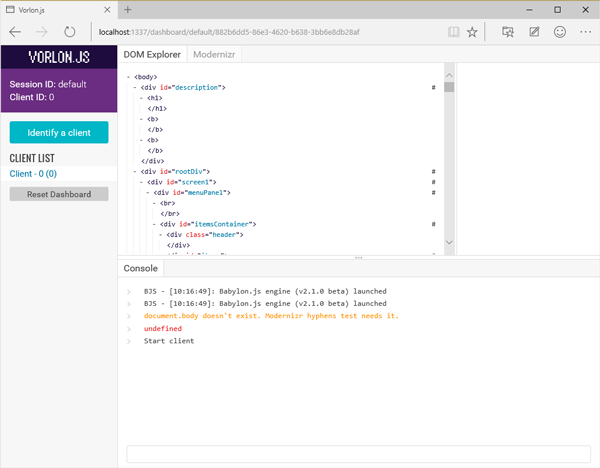
Sidenote: The browser shown above is Microsoft Edge (formerly known as Project Spartan), Microsoft's new browser for Windows 10. You can also test your web apps for it remotely on your Mac, iOS, Android, or Windows device @ http://dev.modern.ie/. Or try Vorlon.js too.
Back to it: I can see console messages for instance, which is useful when I debug Babylon.js on mobile devices (like iOS, Android or Windows Phone). I can click on any node on the DOM Explorer to get info about CSS properties:
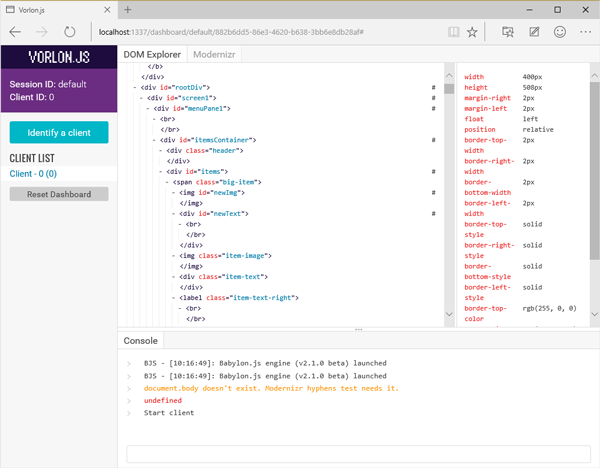
On the client side, the selected node is highlighted with a red border:
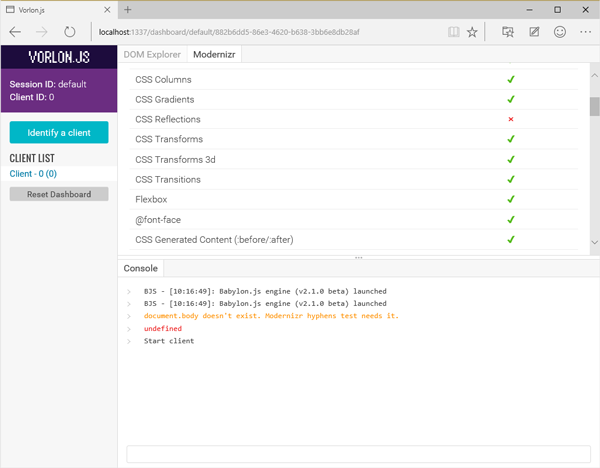
Moreover, I can switch to the Modernizr tab to see the capabilities of my specific device:
On the left side, you can see the list of currently connected clients and you can use the Identify a client button to display a number on every connected device.
A Little More on How We Built Vorlon.js
From the very beginning, we wanted to be sure that Vorlon.js remains as mobile-first and platform-agnostic as possible. So we decided to use open source tech that worked across the broader number of environments.
Our dev environment was Visual Studio Community which you can get for free now. We used the Node.js tools for Visual Studio and Azure for the back-end. Our front-end was JavaScript and TypeScript. If you're not familiar with TypeScript, you can learn why we've built Babylon.js with it in this blog post. Recently Angular 2 has been built with TypeScript. But you don't have to know it to use Vorlon.js.
Here's a global schema of how it works:
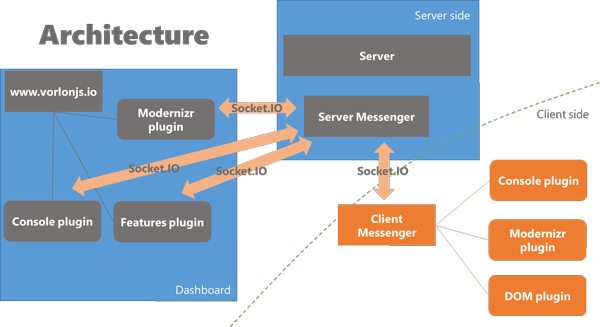
Here are the parts we built it with:
- A Node.js server is hosting a dashboard page (served using Express) and a service.
- The service is using Socket.IO to establish a direct connection with both the dashboard and the various devices.
- Devices have to reference a simple Vorlon.js page served by the server. It contains all the plugins' client code which interacts with the client device and communicates with the dashboard through the server.
- Every plug-in is split in two parts:
- the client side, used to capture information and to interact with the device
- the dashboard side, used to generate a command panel for the plugin inside the dashboard
For instance, the console plugin works this way:
- The client
side generates a hook on top of
console.log(),console.warn()orconsole.error(). This hook is used to send the parameters of these functions to the dashboard. It can also receive orders from the dashboard side that it will evaluate. - The dashboard side gathers these parameters and displays them on the dashboard.
The result is simply a remote console:

You can get an even better understanding of Vorlon.js extensibility, including how to build your own plug-ins, at the Vorlon.js website.
What's Next?
Vorlon.js is built on the idea of extensibility. We encourage you to contribute! And we're already thinking about how we might integrate Vorlon.js into browser dev tools as well as Web Audio debugging.
If you want to try it, you are just one click away: vorlonjs.com. And the more technical docs are on our GitHub.
More Hands-On With JavaScript
It might surprise you a bit, but Microsoft has a bunch of free learning on many open source JavaScript topics, and we’re on a mission to create a lot more with Microsoft Edge. Check out my own:
- Introduction to WebGL 3D with HTML5 and Babylon.JS
- Building a Single Page Application with ASP.NET and AngularJS
- Cutting Edge Graphics in HTML
Or our team’s learning series:
- Practical Performance Tips to Make your HTML/JavaScript Faster (a seven-part series from responsive design to casual games to performance optimization)
- The Modern Web Platform Jump Start (the fundamentals of HTML, CSS, and JS)
- Developing Universal Windows App with HTML and JavaScript Jump Start (use the JS you’ve already created to build an app)
And some free tools: Visual Studio Community, Azure Trial, and cross-browser testing tools for Mac, Linux, or Windows.
This article is part of the web dev tech series from Microsoft. We’re excited to share Microsoft Edge and the new EdgeHTML rendering engine with you. Get free virtual machines or test remotely on your Mac, iOS, Android, or Windows device @ http://dev.modern.ie/.

Comments