Once you start digging around New Relic you begin to realise just how many interesting features the service has to help monitor the performance and health of your application. It was truly difficult to pick just five things to talk about, so rather than focusing on the obvious features let's look at some of the less hyped functionality that New Relic provides and how we can use it in interesting and sometimes unorthodox ways.
When we left you last time, we had a basic 'Hello World' Rails application (called New Relic_rails1, living in ~/project/tmp/New Relic). We will continue using this app, extend it and see if we can use it to demonstrate the features of New Relic that we'll be looking at.
This content was commissioned by New Relic and was written and/or edited by the Tuts+ team. Our aim with sponsored content is to publish relevant and objective tutorials, case studies, and inspirational interviews that offer genuine educational value to our readers and enable us to fund the creation of more useful content.
Availability Monitoring
This is one New Relic feature that usually doesn't make the front page of the marketing material. There is not a lot to it, but if you think about it, what's more important that making sure your app is actually up and running and accessible by your users?
Firstly, when you set up availability monitoring, your application gets a nice asterisk on your main applications dashboard:
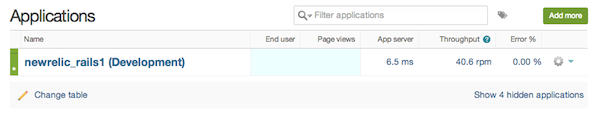
It's a nice visual reminder, so you can see which apps still need availability monitoring switched on.
Let's now look at how we can set up availability monitoring and what we can get out of it. Firstly, you need to jump into your application and then go into Settings->Availability Monitoring. You will see something like this:
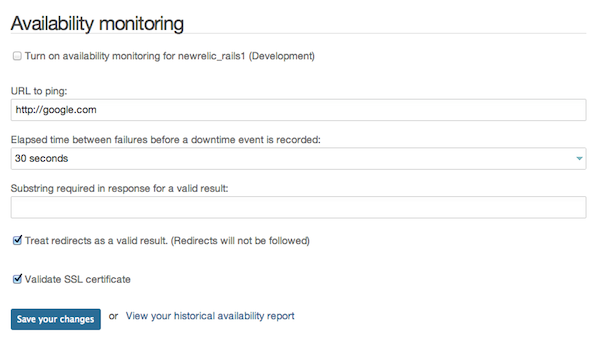
You need to provide a URL you want New Relic to ping, tick the box, save your changes and you're good to go. New Relic will begin hitting your URL every 30 seconds. But the fun doesn't stop there. New Relic will ping your URL via an HTTP HEAD request (and deem everything OK if it receives a 200 response code), but you can supply a response string that you want New Relic to look for in which case it will perform a GET request and examine the response for the string that you provided. This can be very handy if you have a custom 'Health Check' page that you want to hit.
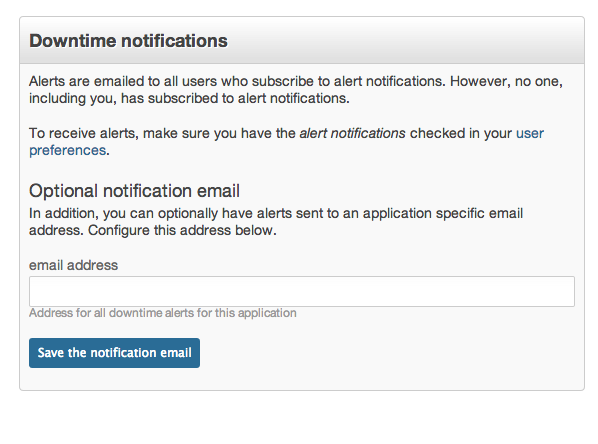
You can also set up email notification if downtime occurs:
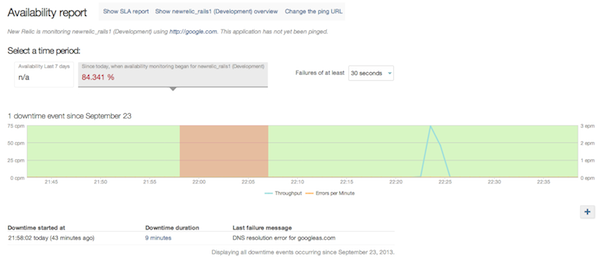
Now that you're monitoring availability, you will have access to a nice report which will visually show you when any downtime has occurred:
In fact, many of your charts (e.g. the application overview) will have this visual indication:
You have to admit that's some pretty nice functionality for so little effort.
You can, of course, disable and re-enable monitoring (via the New Relic REST API) when you're performing deploys, to make sure you don't get spurious downtime events.
Another interesting side-effect of this is that if you're deploying your pet project to Heroku on a single dyno, you can use this ping functionality to prevent your dyno from sleeping, which can make your site annoyingly slow if you don't have a lot of traffic.
Custom Error Recording
If unexpected errors occur in your application, New Relic will record these for you and give you a nice graph. Our little 'Hello World' app has performed admirably for the moment, so there is nothing for us to see on that front. But, we can purposely break our app and see what New Relic gives us.
Let's modify our HelloController to raise an error randomly approximately 50% of the time:
class HelloController < ApplicationController
  def index
    if rand(2) == 0
      raise 'Random error'
    end
  end
end
We will now make a few hundred calls to our app and see what happens:
ab -n 300 -c 10 http://127.0.0.1:3000/
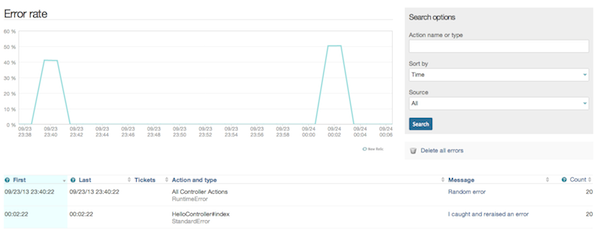
Our New Relic error graph now looks much more interesting:
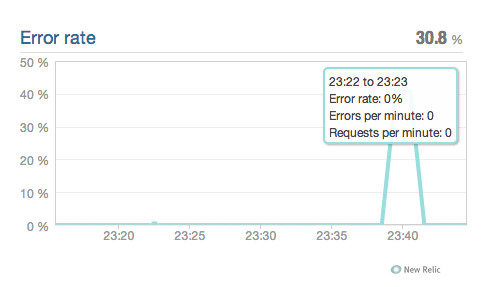
And we can drill down to get some specifics:
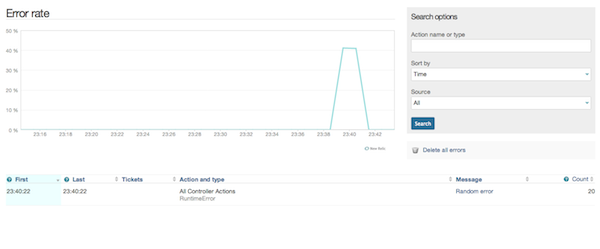
As you can see we can sort our errors and filter them as well as look at errors from web requests and background tasks separately. This is some incredibly powerful stuff to help you diagnose and fix problems with your application. You can of course also see the stack trace for each error:
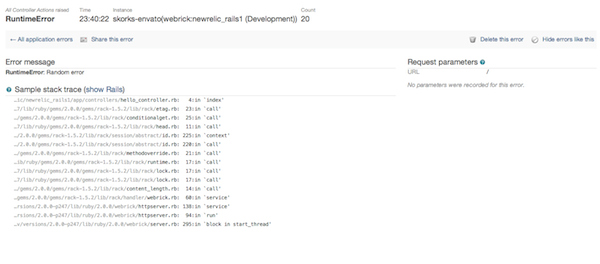
There are services specifically dedicated to capturing errors from your application, some of the most well known ones are Airbrake and Bugsnag. These are paid services used by many application, but the functionality that New Relic provides just about makes these services redundant. In fact if we could send custom errors to New Relic (rather than letting it capture errors that we hadn't rescued) we could make a compelling case for not using a separate error collection service (and save some money and get rid of an extra gem in the process).
While New Relic doesn't document any way of doing this, we can always go to the source to see if what we want to do is hard. It looks to me like it should be pretty trivial for us to send custom errors to New Relic, so let's give it a try. We'll modify our controller action again to rescue all errors and send a custom error to New Relic:
class HelloController < ApplicationController
  def index
    if rand(2) == 0
      raise 'Random error'
    end
  rescue
    New Relic::Agent.notice_error(StandardError.new("I caught and reraised an error"))
  end
end
After we make a few more calls and wait for the data to come through we see the following:
It worked, our custom error is coming through! New Relic can definitely act as our error collection service. We are of course using a private interface here which is not very nice, but we can put the notice_error call behind a facade which will make things a bit easier for us if the interface changes.
An even better approach might be to not treat custom errors like regular errors at all, but instead create a custom metric to track and then build a custom dashboard to visualise. This way we're no using any undocumented functionality and would still get all the benefits - brilliant!
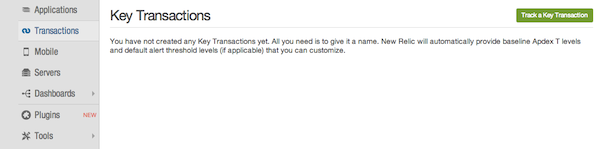
Key Transaction Tracking
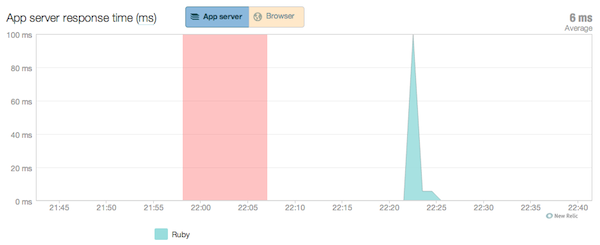
New Relic will normally track your transactions for you:
You will be able to see where your application is spending most of its time (e.g. in the controller, model, database etc.). However, New Relic will not capture a detailed trace unless the transaction takes longer than Appdex * 4 seconds. Normally this is OK, but sometime you have transactions that are much more important to your application or to your business. Perhaps these transactions are extremely high volume or deal with important events like payments. Suffice to say you need to make sure this type of transaction always performs extremely well.
The thing is though, when a transaction is this important it has probably received quite a lot of love from you already and may be performing fairly well. Let's say you have a transaction with an extremely high throughput (occurs many times per minute). If this transaction is performing optimally everything is fine, but if the performance were to degrade slightly, due to the volume of the traffic it may have a disproportionally detrimental effect on your application. What you want is something like:
- a separate Apdex T value just for this transaction
- the ability to receive alerts when the performance of this transaction degrades
- a detailed trace every time this transaction performs even slightly non-optimally
This is exactly what key Key Transactions give you!
Before we set up a key transaction for our 'Hello World' app, we need to create a more interesting transaction which will usually perform well, but will sometimes perform somewhat badly. We will build the ability to look at car makes and models and get a particular car make to slow the transaction down. Firstly the route:
New RelicRails1::Application.routes.draw do
  get 'random_car', to: 'cars#show_random'

  root 'hello#index'
end
We want to be able to get a random car, this will map to the CarsController:
class CarsController < ApplicationController
  def show_random
    @car = Car.offset(rand(Car.count)).first
    if @car.make == 'Ford'
      sleep(2)
    end
  end
end
We get a random car from the database and if the car make is 'Ford' we will have a slow transaction on our hands. Of course we need a Car model:
class Car < ActiveRecord::Base
end
We'll need to configure our database to use MySql in development (I did this, but you can stick with sqlite):
base: &BASE
  adapter: mysql2
  encoding: utf8
  host: "localhost"
  username: "root"
  max_connections: 10
  timeout: 5000

development: &DEV
  <<: *BASE
  database: "New Relic_rails1_development"
  sql_log_level: debug
We need a migration to create a cars table:
class Cars < ActiveRecord::Migration
  def change
    create_table :cars, force: true do |t|
      t.string :make
      t.string :model
    end
  end
end
And we need some seed data which we'll put in our db/seeds.rb file:
Car.create(make: 'Ford', model: 'Mondeo')
Car.create(make: 'Honda', model: 'Accord')
Car.create(make: 'Audi', model: 'A4')
Car.create(make: 'Lamborghini', model: 'Murcielago')
Car.create(make: 'Toyota', model: 'Prius')
Lastly we should probably have a view cars/show_random.html.erb:
<h1>Make: <%= @car.make %></h1>
<h2>Model: <%= @car.model %></h2>
You'll also need to add the mysql2 gem to the Gemfile if you've gone with MySql. After this we just need to create and populate the database, restart our server and we're good to go:
bundle
rake db:create && rake db:migrate && rake db:seed
rails s
You'll need to hit the URL, to make sure New Relic recognises that this transaction exists:
curl localhost:3000/random_car
We're now ready to monitor this transaction as a key transaction. Firstly, jump into the transaction tab:
Click the 'Track a Key Transaction', button and pick our newly created transaction:
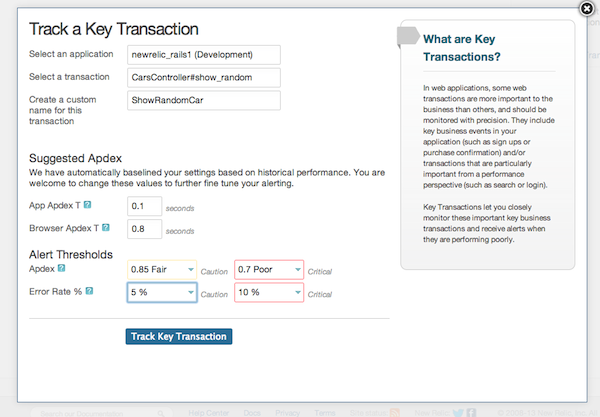
We can give our new key transaction a name, pick the Apdex T that we're happy with as well as set up some alerts. When our transaction takes longer than the Apdex that we've chosen, New Relic will capture a detailed trace which we'll be able to use to figure out where the performance issue is coming from. Let's make a few calls against our new URL and see what data we get:
ab -n 300 -c 20 http://127.0.0.1:3000/random_car
Hmm, it seems some of our transactions are frustrating our users:
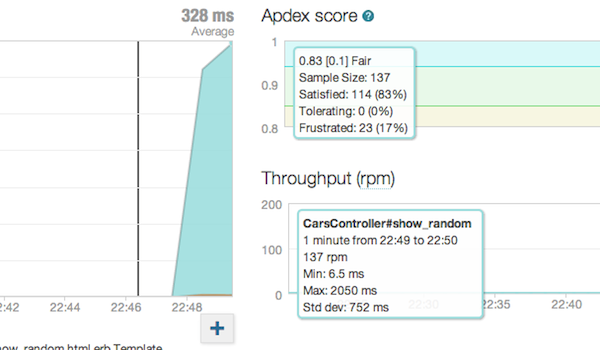
Let's see if New Relic has captured some transaction traces for us:
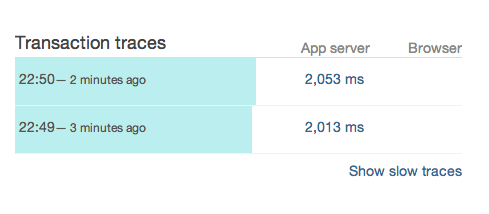
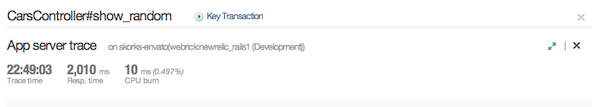
Let's look at one of these traces. It took around 2 seconds to respond, but only 10 milliseconds were using the CPU:
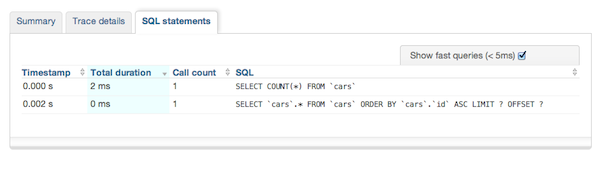
All our SQL statements were fast so database is not the issue:
It looks like most of the time is spent in the controller action:
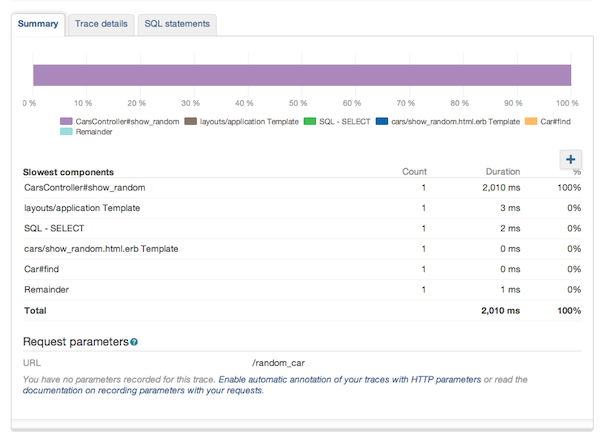
Let's dig into the trace a little bit. It looks like the SQL SELECT was fast, a Car.find was also fast. Then we lose about 2 seconds which is followed by some very fast template rendering:
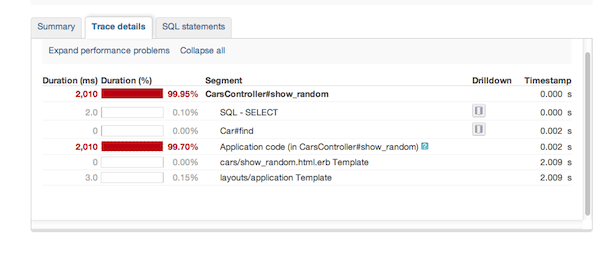
New Relic has kindly highlighted for us where we lost those two seconds. We need to look at our controller code after a Car.find call:
class CarsController < ApplicationController
  def show_random
    @car = Car.offset(rand(Car.count)).first
    if @car.make == 'Ford'
      sleep(2)
    end
  end
end
Hmm, the initial SELECT must be the Car.count call, and the Car.find, must be due to the Car.offset call. Our big delay is right after this though. Ahh look at this, some silly person has put a 2 second delay in our code when the make of the car is 'Ford'. That would explain why our 2 second delay happens only some of the time. I better do a git blame on our repository to find out who put that horrible code in there! On second thoughts, I better not, cause it might say that it was me.
External Service Call Recording
Whenever you make calls to other services from within you app (e.g. an HTTP request to an API like Twitter), New Relic will monitor these as external calls. These days a serious application may integrate with a number of external APIs. Often these external services can significantly degrade the performance of your app, especially if you make these calls in-process. New Relic can show which of your external calls are slowest, which ones you call the most and which respond the slowest on average. You can also look at the performance of each of the external services you use individually. Let's give it a try.
We'll create an external service of our very own, by building a small Sinatra app. Firstly we install the gem:
gem install sinatra
Create a new file for our service:
touch external_service.rb
And put the following code in there:
require 'sinatra'

get '/hello' do
  sleep_time = rand(2000)/1000.0
  sleep(sleep_time)
  "Hello External World #{sleep_time}!"
end
This service will sleep for a random time (between 0 and 2000 milliseconds) and then return a 'Hello' response with the time it slept for. Now all we have to do is start it:
ruby external_service.rb
Back in our Rails app we'll build a new controller to call our external service. We'll use this route:
New RelicRails1::Application.routes.draw do
...
  get 'external_call', to: 'external_calls#external_call'
...
end
Our controller will call our Sinatra service via HTTP:
require 'net/http'

class ExternalCallsController < ApplicationController
  def external_call
    url = URI.parse('http://localhost:4567/hello')
    external_request = Net::HTTP::Get.new(url.to_s)
    external_response = Net::HTTP.start(url.host, url.port) do |http|
      http.request(external_request)
    end
    @result = external_response.body
  end
end
And we need a view to display the results:
<h1><%= @result %></h1>
All we have to do now is make a few calls to our new endpoint:
ab -n 100 -c 10 http://127.0.0.1:3000/external_call
Let's see what New Relic has produced for us.
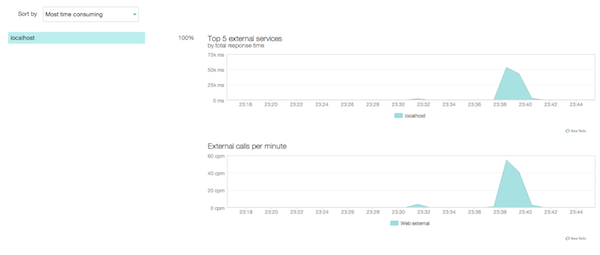
New Relic has indeed picked up our new external call. We've got the total calls per minute we're making to the external endpoint. And the total that was spend responding by the external service. Of course our chart looks a little sparse since we only have one external service, which means we don't have anything to compare against.
We can also get more detailed data about the specific external call as well as where in our app this call is being made from:
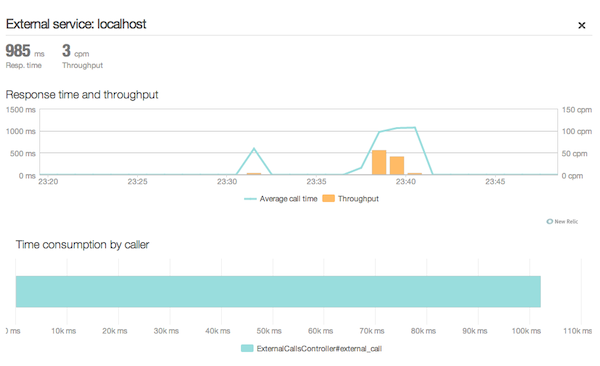
We can see when the calls were made, the throughput and the average response time. This may seem simple, but when you have an app with a lot of external services this feature can give you a very nice overview of how these external services are performing, as well as when and where they are being used. This can allow you to make decisions regarding caching certain external service responses if possible, or even dropping particular external services if their performance is not up to scratch. And you no longer have to argue these things based on gut-feel and home-baked metrics, you'll have hard data to prove your point for you.
Scalability and Capacity Analysis
There is nothing more frustrating for a developer than having your application fall over due to a traffic spike. Everything was running smooth until those extra few hundred users came along and your application exploded. You had a feeling this might happen, but couldn't be sure - the wait and see attitude seemed to be the most pragmatic approach. Well with New Relic capacity and scalability reports, you no longer have to 'wait and see'. You can tell straight away how well your app is scaling, you can do load tests and instantly see if you application can handle the load. You can observe your application response time trends as your user base grows and predict when you'll need to add capacity. All of those are truly wonderful things.
First, let's look at the capacity reports:
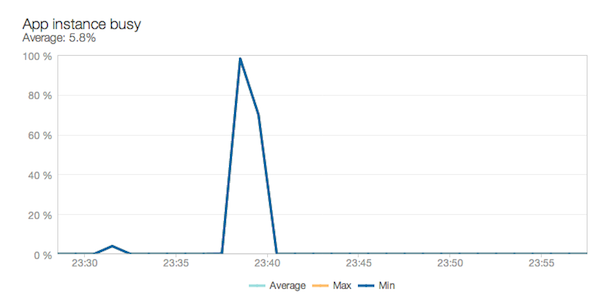
Hmm, this one shows a big spike, but otherwise nothing. Well we're running in development mode, so this is understandable. That spike is for when we did a bunch of requests concurrently just a little while ago. As you can see when we did those concurrent requests, we maxed out our poor lonely Webrick instance. If this was production and that load was constant, our instance would always be 100% busy, which would probably indicate that we need another instance.
The instance analysis report is slightly different:
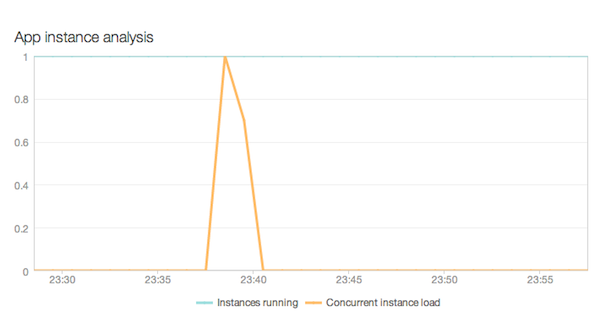
In our case we don't get much out of it, but it normally shows us the number of instances that are running, and the number of instance we actually need to handle the load if all instances were 100% busy. So if we were running 10 instances and the concurrent instance load was 2, we could easily halve (or even more than halve) the number of running instance and not degrade the performance at all. For a small app that runs only a few instances, this is no big deal, but for a large application with dozens and hundreds of instances, this can translate to significant cost savings.
And then there are the scalability reports. The response time report is probably the most interesting/important one:
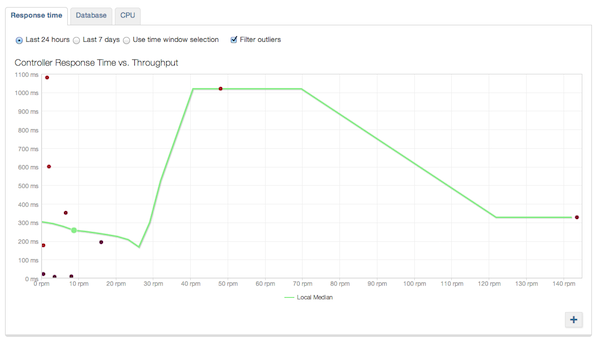
Once again, our graph is very distorted cause it's a development app that we've been playing around with randomly. The idea with this report is that as the throughput for your application increases (more requests per minute), the response time should remain close to constant (i.e. performance does not degrade when there is more traffic). This means you should always be seeing something resembling a flat line here. If your line is sloping upwards significantly, your app is probably struggling to handle the traffic and you may need to look at adding more capacity. Where to add capacity is another question entirely (e.g. database capacity, more servers etc.). The other two scalability reports can help you answer it. There is the database report:
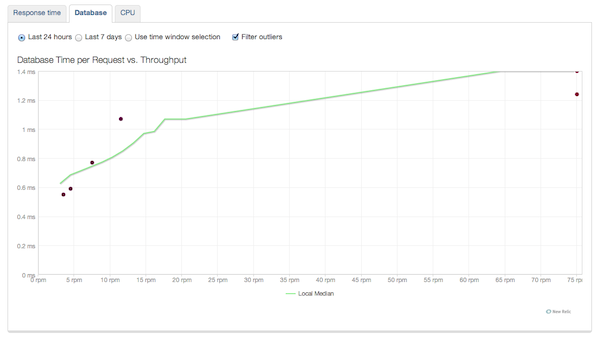
You can't expect your database to not be effected by higher load, so what you should be seeing here is a line that slowly goes up as the throughput of your application increases. It is up to you when the database response time is deemed unacceptable (i.e. is affecting the response of the application too much), but when you do decide that the database responses are too slow, you know it is time to add database capacity. The other report is the CPU:
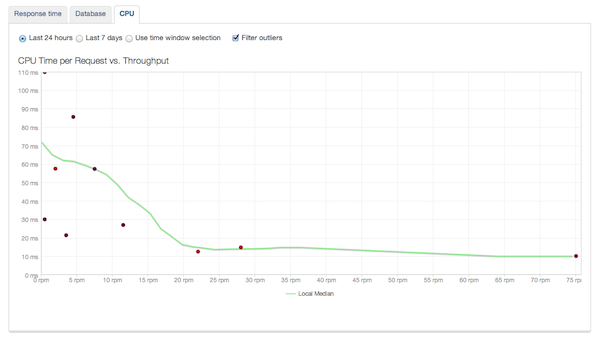
Once again you can't really expect higher throughput to not affect your CPU load, you should be seeing a line that slowly goes up with increased throughput. This, together with the capacity reports we talked about earlier can allow you to decide when to add more Rails processes/servers to ensure your performance remains decent.
Conclusion
If one or all of those features have raised an eyebrow (or two) for you, the good news is that we've only just scratched the surface. Each of those features more than deserves an in-depth article of its own. But, New Relic also has a number of other features that are potentially even more powerful, these include Real User Monitoring, The New Relic Platform, The Thread Profiler, Alert Thresholds and Notification and many others. We will try to cover some or maybe even all of these in later tutorials.
For now, try New Relic out, deploy an agent in your favourite language and see if you can discover an out-of-the-box way of using some of the functionality that New Relic provides. And if you do have some innovative ways to use New Relic, be sure to let everyone know by leaving a comment.

Comments