Do you want to get actionable, real-time insights from the billions of metrics your software is producing? Do you also want to get 75% off a Tuts+ yearly subscription?
If so, you're in luck. Until 31 March, New Relic is offering you the opportunity to deploy for free, and get a 75% discount on a one-year subscription to Tuts+ at the same time.
Deploy New Relic now and get $135 off your Tuts+ subscription!
We're confident about recommending New Relic, because we use their products ourselves here at Envato (our parent company). Watch this video for an example of how we use New Relic Insights:
To find out more about how New Relic works and get started with using it, follow these simple steps. There's a Tuts+ tutorial to help you with each one:
1. The Basics in 30 Minutes
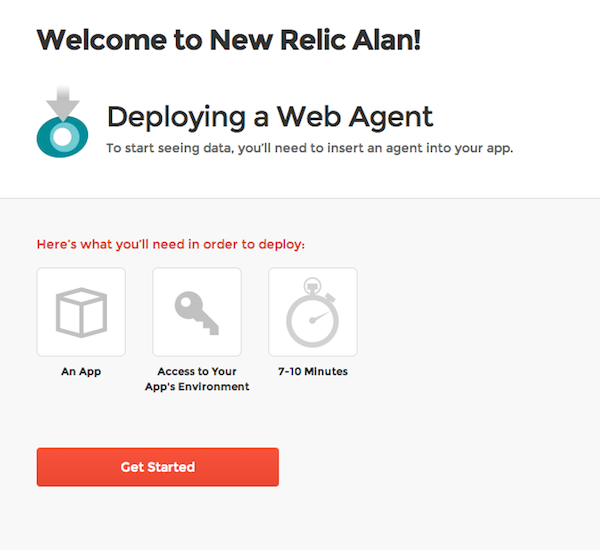
It's simple to deploy New Relic and get started with basic monitoring. In this tutorial, you'll learn how to set up a simple Rails app and hook up New Relic to start monitoring its performance.
2. Learn How to Monitor WordPress Performance
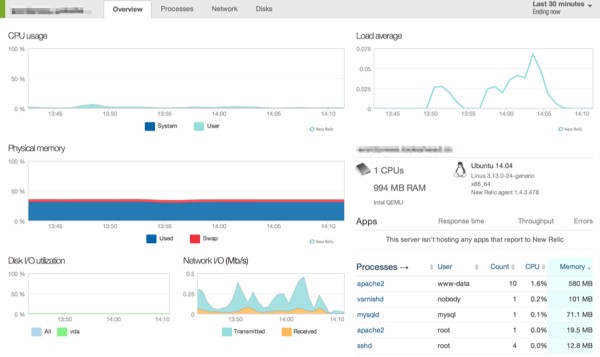
You can use New Relic's free server monitoring to see what's happening within your WordPress installation and your PHP stack. In our tutorial you'll learn how to use New Relic to evaluate WordPress performance in three key ways:
- Monitoring MySQL performance. Poorly written themes or plugins can definitely negatively affect site performance. And, as your site grows, this could get worse.
- Apdex gives you a quantitative measurement of the usability experiences of your site based on response time.
- Monitoring the performance of third party plugins and APIs. WordPress offers a powerful array of plugins and services to add to your blog, but some can kill performance. New Relic can help you identify problem areas.
3. Set Up Front-End Monitoring
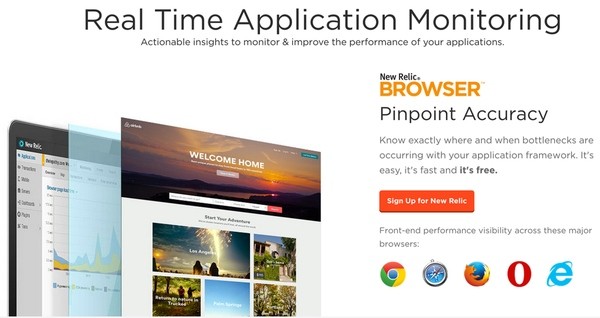
Learn how to use New Relic Browser to monitor full page life cycle data—well beyond the initial page load. For each end user page load, New Relic captures:
- Time spent in the front end (browser)
- Code and events executed in the browser (JavaScript, Ajax, and end-user interactions)
- Time spent in the back end (network and web app)
- Geographic origin
- Browser type and version, and operating system
You can view the data globally across all users and see it sliced and diced by webpage, browser, user session, and location.
4. Go Mobile
If you're interested in mobile development, you'll want to integrate New Relic in an iOS application. Our tutorial will show you how easy it is to set up New Relic, and what it can do for your iOS application in terms of performance and making sure your users get the best possible experience using your product.
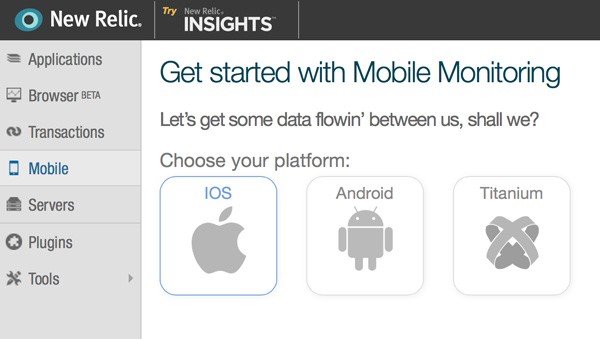
If you're more interested in Android development, you can also have a look at Using New Relic to Monitor Your Android App.
5. Use New Relic to Monitor Your Servers
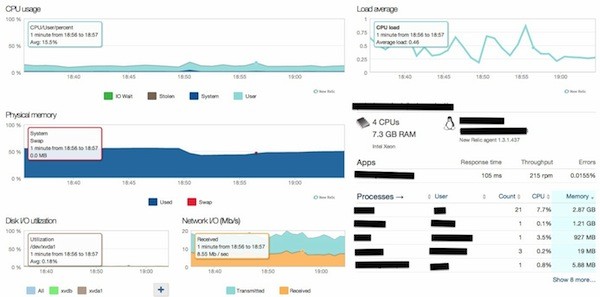
In Using New Relic to Monitor Your Servers, we look at how to use New Relic to monitor your infrastructure (i.e. your production server) and why you'd want to.
We've got even more New Relic tutorials for you in this series. If you're interested in trying it out, deploy for free before 31 March 2015 and get 75% off a Tuts+ yearly subscription.


Comments