The CSV (Comma Separated Values) file format is a popular way of exchanging data between applications.
In this quick tip, we’ll learn how JavaScript can help us visualize the data of a CSV file.
Creating a CSV File
To begin with, let’s create a simple CSV file. To do this, we’ll take advantage of Mockaroo, an online test data generator. Here’s our file:

Converting a CSV File Into an HTML Table
Now that we’ve generated the file, we’re ready to parse it and build an associated HTML table.
As a first step, we’ll use jQuery’s ajax function to retrieve the data from this file:
	  $.ajax({
        url: 'csv_data.csv',
        dataType: 'text',
      }).done(successFunction);
Assuming the AJAX request is successful, the successFunction is executed. This function is responsible for parsing the returned data and transforming them into an HTML table:
	  function successFunction(data) {
        var allRows = data.split(/\r?\n|\r/);
        var table = '<table>';
        for (var singleRow = 0; singleRow < allRows.length; singleRow++) {
          if (singleRow === 0) {
            table += '<thead>';
            table += '<tr>';
          } else {
            table += '<tr>';
          }
          var rowCells = allRows[singleRow].split(',');
          for (var rowCell = 0; rowCell < rowCells.length; rowCell++) {
            if (singleRow === 0) {
              table += '<th>';
              table += rowCells[rowCell];
              table += '</th>';
            } else {
              table += '<td>';
              table += rowCells[rowCell];
              table += '</td>';
            }
          }
          if (singleRow === 0) {
            table += '</tr>';
            table += '</thead>';
            table += '<tbody>';
          } else {
            table += '</tr>';
          }
        }
        table += '</tbody>';
        table += '</table>';
        $('body').append(table);
      }
So, the idea is to convert each of the CSV rows into a table row. With that in mind, let’s briefly explain how the code above works:
- First, we use a regex to split the AJAX response, and thus separate the CSV rows.
- Then, we iterate through the CSV rows and split their data fields.
- Finally, we loop through the data fields and create the corresponding table cells.
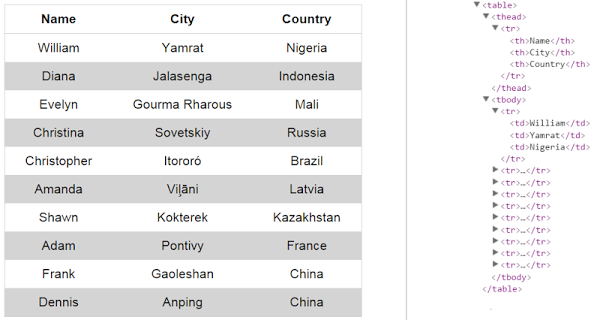
Furthermore, to get a better understanding of this code, consider the following visualization:

At this point, it’s important to clarify why we used the /\r?\n|\r/ regex to split the CSV rows.
As you probably already know, there are different representations of a newline across operating systems. For example, on Windows platforms the characters representing a newline are \r\n. That said, by using the regex above, we’re able to match all those possible representations.
In addition, most text editors allow us to choose the format for a newline. Take, for instance, Notepad++. In this editor, we can specify the desired format for a document by navigating to this path:

To illustrate it, consider our file. Depending on the format we choose, it would look like this:

Adding Styles to the HTML Table
Before we look at the resulting table, let’s add a few basic styles to it:
	  table {
        margin: 0 auto;
        text-align: center;
        border-collapse: collapse;
        border: 1px solid #d4d4d4;
      }

      tr:nth-child(even) {
        background: #d4d4d4;
      }

      th, td {
        padding: 10px 30px;
      }

      th {
        border-bottom: 1px solid #d4d4d4;
      }
Here’s the generated table:

Conclusion
In this short article, we went through the process of converting a CSV file into an HTML table. Of course, we could have used a web-based tool for this conversion, yet I think that it’s always more challenging to achieve this by writing your own code.

Comments