From day to day, a lot of the work of running a software business revolves around asking and answering questions and trying to make the correct decisions based on them.
Some of the questions are technical, such as "What is the most popular web browser among our high-paying customers this week?" Others, such as "What are the most popular features in our application?", guide you as you try to plan where your developer resources make the biggest difference.
Sometimes, no right answer exists, but more often than not, what stands between you and a well-informed decision is simply the lack of quality data.
New Relic Insights is an Advanced Performance Analytics (APA) tool designed to help you answer these (and many more) business-related questions. For this, it combines performance metrics with relevant business and application parameters, making it all available for querying, combining and visualizing in a beautiful way.
In the past, research like this was done through complex queries and scripts using history data, by data specialists. Now, with Insights, you can mine transactions close to real-time, using real data from actual visitors.
In This Tutorial
This tutorial is a practical introduction to using New Relic Insights in a real application environment. The best way to experience and learn Insights is by trying it yourself—and experimenting. So, instead of spending a lot of time on theory, we'll jump right in and explore the tool step by step, learning about it as we go.
We'll start by looking briefly at installing New Relic Insights. Then, we'll dig into the data: how to query it, how to visualize it, and how to instrument your code to pass in some application-specific parameters. Finally, we'll put what we've learned into use and build a customer support dashboard that you can use to quickly identify issues and help your customers in their troubles with your app.
After completing the tutorial, you will feel comfortable exploring data in New Relic Insights and using it to create dashboards for presenting information relevant to the different stakeholders in your organization, from management to engineering.
A basic understanding of software development, PHP and SQL will help you in going through the tutorial. I will use an application of my own as an example, but most of what we'll do will apply to pretty much any web-based business. So, to get the most out of the tutorial, I suggest you pick an application of your own and use it to test the queries and dashboard setups as we go through them.
Getting Started With New Relic Insights
Step 1: Set Up New Relic Insights
If you are already using New Relic's monitoring tools, getting started with Insights is straightforward. The application collects its data from other New Relic products such as APM and Browser, so no further installation is needed. Simply click on the Insights menu item in the New Relic menu bar and start using it to explore your data.
If you are a new user, begin by signing up for a New Relic user account. Insights is not available as a free version, but the 14-day free trial period is great for trying your hand at using it.
After creating your account, you need to install the APM monitoring tool on your server. I have described the steps for installing the tool in detail in an earlier tutorial about New Relic Alerts. Follow the installation instructions from that tutorial, and then, with New Relic collecting information from your application, return to this tutorial and continue to the next step.
Step 2: Run Your First Query
The first thing you see when you start using New Relic Insights is the Query page.
At first, with a query box staring at you at the top of the page, this page can feel a bit intimidating. However, once you know where to begin, you'll be up to speed in no time.
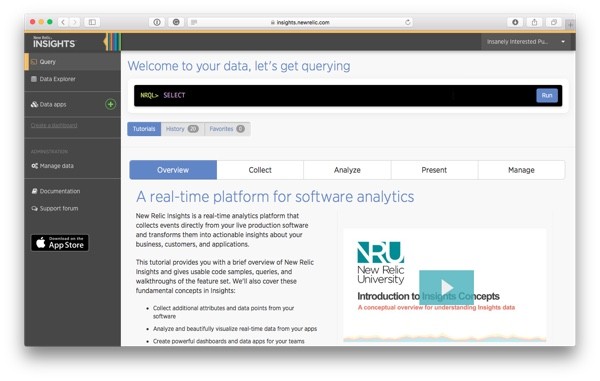
To give you a feel of the data available for you in Insights, let's begin by running your first query.
In the query box at the top of the page, write the following query:
SELECT count(*) FROM PageView SINCE 1 day ago
This query shows you the number of PageView events recorded in the past 24 hours.
As you can see from the query above, NRQL is very similar to SQL, with a few limitations as well as a bunch of New Relic specific functions and keywords. In the rest of this tutorial, you'll see quite a few different queries, but if, at any time, you need to look up the specifics of the query language, you can also take a look at the NRQL Reference.
Click Run to run the query and see its results.
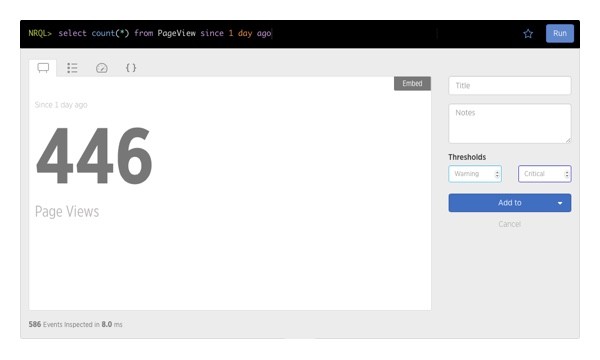
You have now executed your first NRQL query. Next, you'll probably want to get familiar with the data New Relic makes available for your queries.
One way is just to try writing another query. The query box comes with auto-complete, so this is a handy way to poke around and see what kinds of results come out of your queries.
Another option is to explore the raw data.
Step 3: Explore the Data
Exploring data stored in Insights is a good way to find out what data fields are available for your queries and to get an overall understanding of their possible values.
To do this, click on Data Explorer on the left side menu.
In the next screen, you'll get to choose the type of data you want to browse.
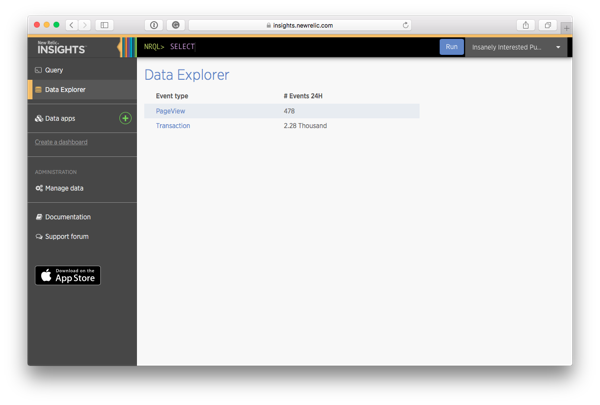
The list only shows the event types that have data available in your account, in this case, Transaction and PageView.
Here's a full list of event types provided by Insights:
- Transaction: Server-side events collected by New Relic APM. In these events, you'll find information about lower-level functionality such as HTTP response codes and database query durations.
- PageView: Page load events collected by New Relic Browser. In this group of events, you'll find information about the visitor's experience on the page, looking at things like the web browser used, the length of the visit, and so on.
- PageAction: A custom group of Browser-related events that you can populate by using the Insights JavaScript API to send events about any actions the user performs on the page (for example clicking a button to add an item in their shopping cart).
- Mobile: Events collected from your mobile applications monitored using New Relic Mobile.
- SyntheticCheck and SyntheticRequest: Availability test events sent in by the Synthetics tool, showing information about your services' availability.
As many of these event types depend on more advanced New Relic features, we won't look into them in this tutorial. Instead, we'll continue with the first two: Transaction and PageView.
Click on PageView.
The PageView Explorer shows you a list of recent PageView events from your application. Each row represents an actual user's single page view. Remember to scroll the page to the right; unless you have a very large screen, you'll find that there are more fields available than fit the screen at once.
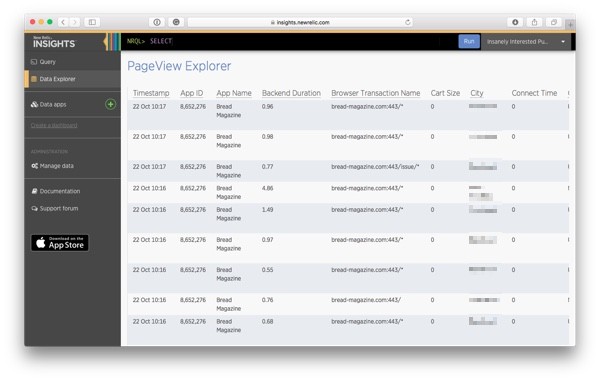
Take a look also at the Transaction data.
Then, equipped with a general understanding of the data available in Insights, let's use the tool to build an effective dashboard for easy access to information that will make your customer support work quicker and easier.
Creating Your First Dashboard
When you receive a bug report or help request from a customer, more often than not, the first thing you need to do is to ask for more information. The browser used, possible error messages and the actions leading to the error are all pieces of the puzzle that users rarely think of including in their emails.
With the help of New Relic Insights, you can use the data from your server to skip past this step and provide a better customer experience while making your work as a developer less frustrating!
In the rest of the tutorial, we'll build a simple customer support dashboard that will let you do just that, without digging into server logs.
Step 1: Create a New Dashboard
A Dashboard in Insights is a collection of widgets—or charts—showing tailored information about your application's performance, your users' actions, or a combination of them. Building them requires some understanding of the underlying technology, but once they are ready, they can be easily used by non-technical people such as managers to explore the product's metrics.
For more complex collections of charts and widgets, you can create a Data App, a collection of Dashboards linked to each other to form an application-like experience.
A customer support dashboard is likely to grow in the future as you add more and more elements to it, so to prepare for it, it's a good idea to start building the dashboard directly inside one.
First, click on Data Apps on the left side menu. As you don't yet have any Data App configured, you'll see the following screen:
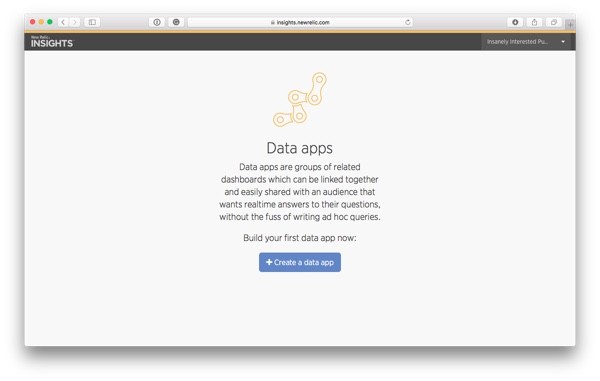
Click on Create a data app to create your Data App.
A popup for entering the App's information opens in the middle of the page:
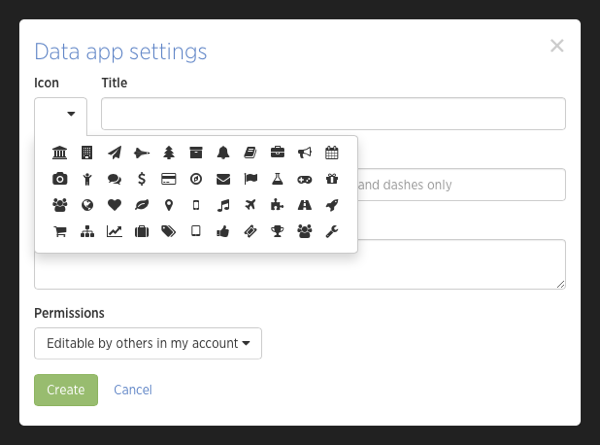
Fill in the information about your new App: Icon, Title (for example "Customer Support"), and Description.
Keep in mind that this is the top level: inside the app, you will be able to create any number of dashboards. You will also be able to edit these settings later, so don't worry about them too much at this point.
Once you've filled the data fields, click on Create.
You have now created an App. Insights also automatically added an empty dashboard to it. Give the dashboard a name (for example, "Overview") by editing the text field on the left that now says Untitled. You can also pick a descriptive icon from the dropdown on its left side if you like.

The dashboard looks empty, so let's add some content to it.
Step 2: Add Your First Dashboard Widget
Filling a new dashboard with useful information about users and their behavior as they interact with your applications begins with writing an NRQL query. Ask yourself what you (or the person using this dashboard) will want to know about the application's performance. Then write a query to collect that information.
Let's start with a breakdown of web browsers used by your visitors.
Type the following query in the query box at the top of the page:
SELECT uniqueCount(session) from PageView FACET userAgentName SINCE 1 week ago
This query:
-
Counts the number of unique sessions.
sessionis the attribute for a user's New Relic session key, which lasts until the user closes the browser window.uniqueCountis an NRQL function that can be used to get the number of unique values recorded for an attribute. -
Groups the sessions by the web browser used. This is done using the
FACETkeyword, which takes only one parameter, the name of the attribute to group the data by (userAgentName). -
Limits the query to data collected in the past week. The
SINCEkeyword defines the beginning of a time range and accepts the date specified in a wide range of different formats, for example,5 minutes ago,6 hours ago, orYESTERDAY.
Click Run to execute the query. The results show up right below the query box:
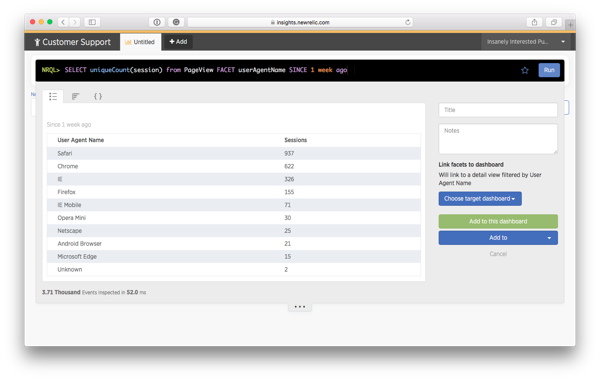
This is still similar to what we saw on the front page when we ran our first query. Now, however, we will store the query on the dashboard to save ourselves the trouble of running the query manually each time we want to know its results.
On the top of the results, you'll find three tabs for picking the presentation for the results.
Click on the second one to display the browser breakdown as a bar chart.
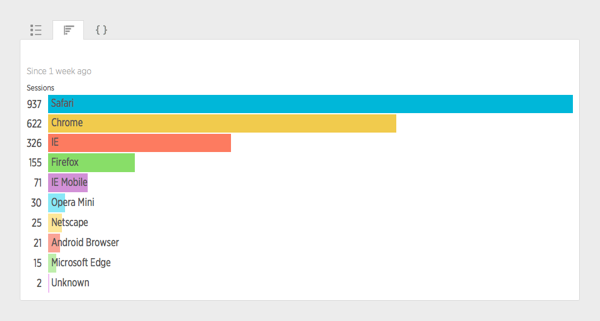
Type a Title for the chart, and a description in the Notes field if you like.
Then click Add to this dashboard.
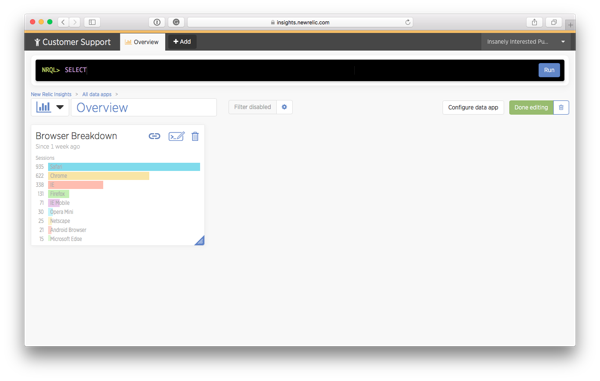
There it is, the first widget on this dashboard.
You can resize the widget by dragging from the blue triangle in the box's bottom right corner, or move it around the canvas by dragging and dropping.
Step 3: Add Some More Dashboard Widgets
We'll soon dig deeper into your application and bring some application-specific data to our Insights dashboard. But before we go there, let's play some more with the data we have, adding a few additional dashboard widgets.
At the top right corner of the Browser Breakdown widget you just added, you'll find three icons.

Click on the middle one to open the widget's query for editing.
In addition to editing a widget's query, this is a good way to go from one query to its natural follow-up. For example, now that you know Safari is the most popular browser among the site's visitors, you might want to take a look at which version of the browser the visitors are using.
To retrieve this information, edit the NRQL query:
SELECT uniqueCount(session) from PageView FACET userAgentVersion WHERE userAgentName = 'Safari' SINCE 1 week ago
In this query, instead of grouping (FACET) the results by the name of the browser (userAgentName), we group them by the browser version (userAgentVersion).
We also added an SQL-like WHERE clause to filter the data to only include events where the user agent is Safari.
Click Run to see the results.
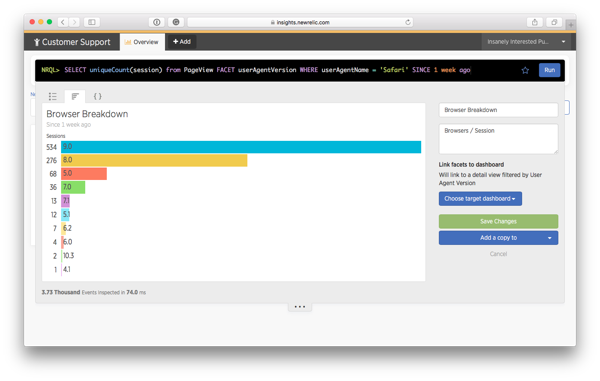
If you were editing the existing widget, you would now click Save Changes to apply the changes you made to the query.
Don't do that this time, however.
Instead, edit the Name and Notes. Then, click Add a copy to. From the drop-down menu that appears, choose Current dashboard to save the results as a new widget on the current dashboard.

As you see from the examples above, building a dashboard is a bit like mining for gold: As you run one query, you'll find something interesting which leads to a new question popping up in your mind. Then, you write a query for it, which again takes you to some new ideas.
All of your queries might not end up in the dashboard, and you might remove some after a while, but they all give you new ideas about how your app is being used.
Here are some more queries to try and play with:
Operating Systems
SELECT uniqueCount(session) FROM PageView SINCE 1 week ago FACET userAgentOS
This query counts the visitors' sessions, grouping them by the operating system used.
Device Type
SELECT uniqueCount(session) FROM PageView SINCE 1 week ago FACET deviceType
This query counts the visitors' sessions, grouping them by the type of device used (Mobile/Desktop).
Visitors' Countries
SELECT uniqueCount(session) FROM PageView FACET countryCode SINCE 1 week ago
This query counts the visitors' sessions, grouping them by the country they are accessing your site from.
Most Popular Pages
SELECT count(*) FROM PageView FACET pageUrl SINCE 1 week ago
This query lists the most popular pages on your site. Notice that this time we use count(*) instead of uniqueCount(session) as even the same visitor visiting the same page again is an interesting nugget of information.
Page Views Per Session
SELECT count(*)/uniqueCount(session) AS 'Page Views Per Session' FROM PageView SINCE 1 week ago FACET deviceType
Exploring the data from my queries, I got thinking about the browsing patterns of mobile and desktop users and if they differ from each other. So, I created this query.
The query calculates the fraction of page views per session, naming it 'Page Views Per Session'. Then, it groups them by device type (deviceType) for the comparison I had in mind.
Recent Errors
SELECT errorMessage, errorType FROM Transaction WHERE errorMessage IS NOT NULL SINCE 1 week ago
This query creates a simple list of error messages and types that have taken place on your server recently. If the query returns an empty list, good for you! If not, you have found something to fix.
HTTP Response Codes
SELECT count(*) FROM Transaction SINCE 1 week ago FACET httpResponseCode
This query counts the transactions, grouping them by HTTP response code.
When you're done with your dashboard, click the Done Editing button on the top right corner of the page.
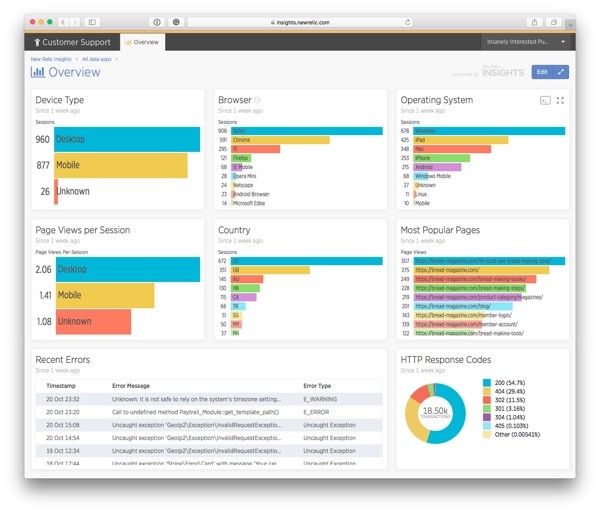
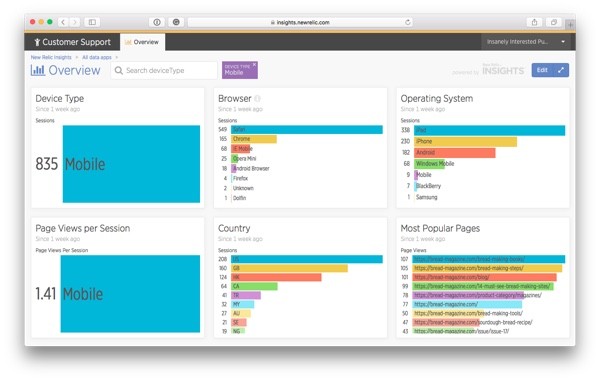
After adding these queries as widgets (and removing the Safari version widget), here's what my dashboard looks like:
Step 4: Add a Filter to Better Analyze the Data
Now, let's say that looking at the Page Views per Session widget, you start to wonder if there are still more differences in how Desktop and Mobile visitors experience your site.
Creating a separate query for each comparison would be a lot of work and would only lead to a cluttered dashboard displaying information you need only occasionally. This is where New Relic Insights' functionality for filtering the dashboard data comes in handy.
Let's give a try.
Click the Edit button on the top right to return to edit mode. Right above the charts, an element that says Filter disabled appears.

Click on the gear icon to configure your filter.
In the menu that shows up:
- Check the Enable filter radio button.
- In the Event types drop-down, select PageView. This is where the device information is stored.
- In the Attributes drop-down, select deviceType as the attribute to be used for filtering the data.
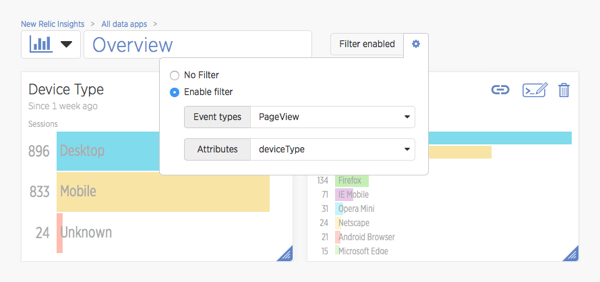
Both the Event types and Attributes drop-downs let you select multiple options. So if, at any point, you want to add more filters to your dashboard, you can do so by simply choosing more attributes.
Now, click on the Done Editing button to browse the data and test the filter.
On the top of the page, you'll now see a search box that says Search deviceType. Click on the box and choose the option Mobile.
Then explore the data to see if you'll notice any differences between mobile and desktop users. For example, in my data, the mobile usage—most of it on Apple devices—explains the high percentage of Safari users: on desktop computers, Google Chrome is much more popular.
Adding Application-Specific Parameters to Your Transaction Data
So far in this tutorial, we've been working with out-of-the box data provided by the Browser and APM tools. With this data, we have built an overview dashboard that gives us useful information about the application as a whole.
However, when it comes to finding data to help you answer a specific user's customer support questions, this isn't quite enough. So, to be able to drill into a given user's data, we'll now continue by making the monitored application pass some application-specific parameters to Insights.
The application used as the example in this tutorial is a WordPress-powered e‑commerce site. However, the instrumentation is very straightforward, and you can apply the idea to pretty much any type of application of your own.
Step 1: Add User Information to Transaction Events
The New Relic PHP Agent API provides a bunch of functions for manipulating the data as it is stored for use in Insights and the other New Relic tools.
Now, we'll focus on one of them, newrelic_add_custom_parameter, which can be used to add a custom parameter to your Transaction events. If you're using some other programming language, check the New Relic documentation for the function to use.
The function takes two parameters: a string key and a value that can be of string or float type.
Now, let's create a function for injecting some data about the user.
Add the code below to your application's code base, in a place where it can be easily called at every request. In a WordPress-based application, this would be inside a plugin.
<?php
/**
 * Sends information about the current user/session to New Relic
 * if New Relic monitoring is enabled
 */
function inject_new_relic_user_information() {
    if ( extension_loaded( 'newrelic' ) ) {
        if ( is_user_logged_in() ) {
            $user = wp_get_current_user();
            newrelic_add_custom_parameter( 'email', $user->user_email );
            newrelic_add_custom_parameter( 'user_id', $user->ID );
            newrelic_add_custom_parameter( 'member_since', $user->user_registered );
        }

        newrelic_add_custom_parameter( 'request_uri', $_SERVER['REQUEST_URI'] );
    }
}
First, on line 7, the function checks that the New Relic extension has been loaded. Then, if the reporting functions are available, it continues by adding a few parameters using the default WordPress user object, WP_User:
-
email: The email address is often the easiest way of identifying a specific user. However, when working with emails, you have to be careful that the information stays secure. -
user_id: If you are not comfortable with using email addresses for identifying your users in Insights, the numeric user ID is another option. Finding out a user's ID before looking up the data is an extra step, though... -
member_since: While not needed for identifying a user, the time when a user registered can be interesting data for future queries about your users' behavior. -
request_uri: By default, the Transaction data doesn't have a parameter for figuring out the page that was accessed. So, I decided to add one to use for querying pages with404errors.
With the function in place, next, you'll need to call it. Make sure to call the function early enough so all of your Transaction events will contain the user information we just added.
In a WordPress plugin, the best way to do this is by hooking the function to an action such as init, that is called early—but only after the user data has been initialized.
Do this by adding the following code right below the function:
add_action( 'init', 'inject_new_relic_user_information' );
Step 2: Pass the Custom Data to New Relic Browser
You have now added a few custom parameters to your Transaction events.
However, as most of our dashboard widgets are based on queries to PageView events, to make them more useful, you also need to make this information available to them. To do this, you'll have to configure the PHP Agent's settings.
First, find the New Relic configuration file, newrelic.ini, on your server. The exact location depends on your PHP installation. On my Amazon Linux server, I found the file at /etc/php-5.5.d/newrelic.ini.
In the configuration file, find the line that looks like this:
;newrelic.browser_monitoring.attributes.enabled = false
Replace it with the following:
newrelic.browser_monitoring.attributes.enabled = true
Then save your changes and restart your web server.
Your Transaction attributes are now automatically included also in the PageView events collected by New Relic Browser. The additional data will only be available in events collected after the changes, so you will have to give New Relic some time to collect some events before moving on.
Step 3: Add a New Customer Support Widget Using the Added Attributes
Now that the Transaction and PageView events include the custom variables with user information, we can create new, even more interesting queries.
As this is a customer support dashboard we're building, let's start with a list of server errors grouped by the email address of the signed-in user.
Type the following query in the query box:
SELECT count(*) AS 'Transactions with errors' FROM Transaction WHERE errorType IS NOT NULL SINCE 1 week ago FACET email
Similar to the overall list of PHP errors we created earlier, the query counts the Transaction events where errorType is set and groups them by the signed-in user's email address (email).
Click Run to test the query (most likely, you'll receive an empty list). Then, give the widget a name and add it to your Overview dashboard.
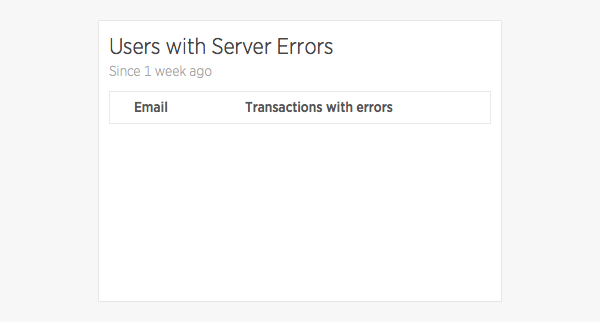
Now, if you like, you can test the widget by breaking your server code for a little while and, as a signed-in user, visiting the page with the error.
The results should look something like this:
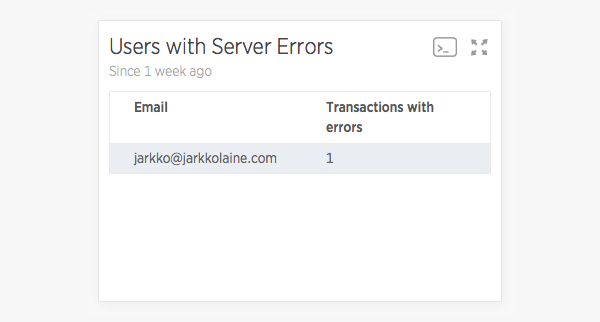
Now, whenever a signed-in customer is faced with a server error, you'll notice it by looking at this list and can then use the email address to find more information.
Step 4: Create a Dashboard for Displaying a Specific User
Now that we know the user's email address, we can use it to filter the dashboard's data in the same way as we did with deviceType earlier in the tutorial.

This is not optimal, however, as the data we want to display for a specific user isn't necessarily the same as that shown on the Overview dashboard.
As I mentioned earlier in the tutorial, a Data App consists of multiple dashboards that can be linked to each other. So, let's create a second dashboard for showing a single customer's data and link the Users With Server Errors widget to it.
First, in edit mode, click on the +Add button at the top of the dashboard window to create a new dashboard.

Name the new dashboard "Signed In User Details". Then click Done editing and return to the Overview dashboard.
Switch to edit mode, then click on the link icon at the top of the Users With Server Errors widget.

A popup for selecting a dashboard opens up. Click Choose target dashboard and then select the Signed In User Details dashboard you just created from the drop-down list.
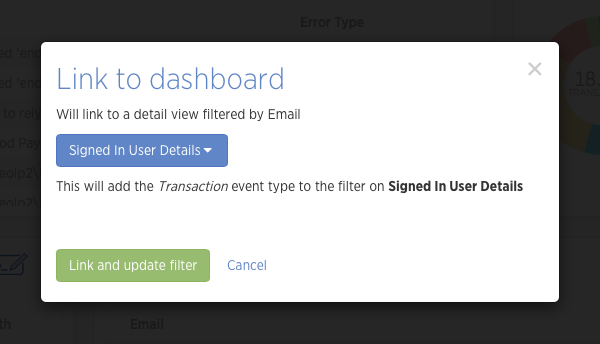
Then click on the Link and update filter button to save your changes.
Click Done editing and return to the Users With Server Errors widget. Notice that the email address is now a link. Clicking on it will take you to the dashboard you just created, automatically filtering it by email.
Step 5: Add Some Widgets to the User Detail Dashboard
You have now created a link from the Overview dashboard's list of users with errors to a new dashboard. This dashboard is still empty, so let's start building it by adding some widgets that will help us learn more about the errors and the user.
Recent Errors
First, add a copy of the Recent Errors widget on the Overview tab.
To do this, still on the Overview tab, switch to edit mode, then scroll down to the widget and click on its Edit button. Scroll back up to the query results, then click on Add a copy to... and select the newly created dashboard in the dropdown.
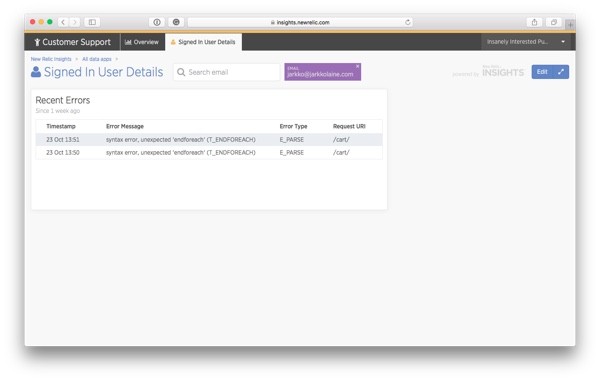
To make the data more useful for bug fixing, edit the query by adding request_uri to it. The final query looks like this:
SELECT errorMessage, errorType, request_uri FROM Transaction WHERE errorMessage IS NOT NULL SINCE 1 week ago
Here's the output on the new dashboard when accessed by clicking on my email:
HTTP Response Codes
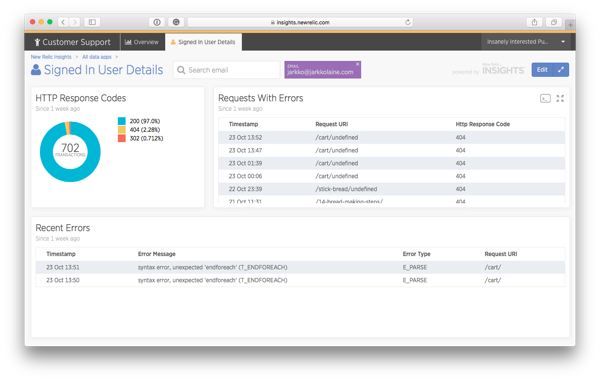
The same way that you copied the list of errors above, also copy the HTTP Response Codes widget to the user-specific dashboard.
Then, to find out more about the requests with errors, add a new widget using the following query:
SELECT request_uri, httpResponseCode from Transaction SINCE 1 week ago WHERE httpResponseCode >= '400'
After moving the widgets around and resizing them, here's what the dashboard now looks like:
Browser and Operating System Information
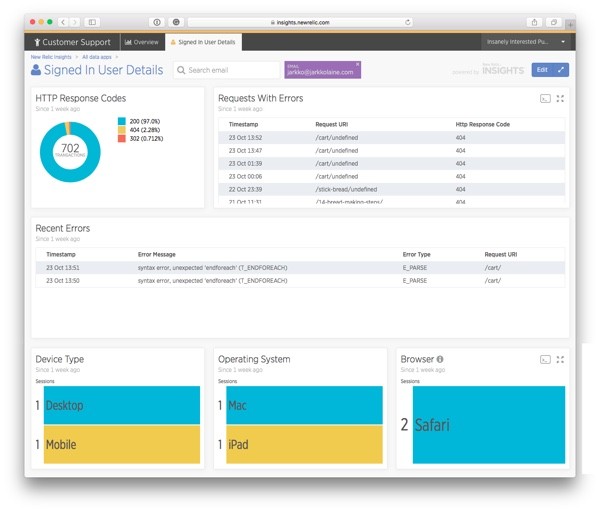
Finally, to complete this first version of the customer support dashboard, let's add some information about the user's web browser, device type, and operating system.
We have already created widgets for all these queries on the Overview dashboard, so all you need to do is to copy them to the new dashboard and design a layout for them.
Something like this, maybe?
Conclusion
You have now used New Relic Insights to build a simple yet powerful customer support dashboard to help you in figuring out what causes the issues your customers face as they use your application.
This is, however, just the beginning.
The possibilities for further improving the dashboard using Insights are almost endless, and the best way to figure them out is by trying yourself.
Here are some ideas to keep you moving:
- If your application uses sessions for visitors, send the session keys to New Relic to find information about non-logged-in users.
- Add more instrumentation and make the dashboard better take your application and business into account.
- Import more events from external services.
- Create more dashboards to dig deeper into some other aspects of your application.
Now, tinker away, using the insights you get from exploring your application's data to better understand your users.


Comments