Introduction
Docker is one of the fastest-growing new technologies at the moment. A solution for deploying software and building scalable web service architectures, it allows you to split your application's architecture into containers with specific roles and responsibilities. Using Docker, you also get to specify the application's dependencies on the operating-system level, bringing us the closest we've ever been to Java's original promise: "Write once, run anywhere".
On the downside, encapsulating your code inside a set of containers can lead to a lack of visibility: the containers become black boxes and leave the developer with little or no visibility into their inner workings.
To fix this, New Relic took up the task and made its server-side monitoring tools (Servers and APM) support Docker. In June 2015, the Docker support became available for all New Relic customers.
In the post announcing the Docker support, Andrew Marshall from New Relic writes:
"You can now drill down from the application (which is really what you care about) to the individual Docker container, and then to the physical server. No more blind spots!"
By monitoring your Docker-based application using New Relic's tool set, you can now analyze the application as a whole and then, when you find issues in your application, look up the containers where the problems occur and fix the issues inside them.
Also, by monitoring the application at the Docker level, you will get valuable information about your setup: are you using your containers wisely, and does the division of resources between containers work as it should?
In This Tutorial
In this tutorial, I will show you how to get started with monitoring a simple Docker-based application using New Relic's tools.
You will learn:
- how to set up New Relic monitoring on a web server running a set of Docker containers to gather information about the overall Docker environment
- how to set up New Relic monitoring for a PHP application running inside one or more Docker containers to monitor the state of the application as well as the individual Docker container
To achieve this, we will create a simple prototype for a hosted WordPress solution: three WordPress sites each running in a Docker container and a MySQL container shared between them.
With the setup in place, we will then enable New Relic monitoring and go through the monitoring tools' views and explore the data you'll find in them.
Requirements
While I hope you will learn something about using Docker by reading this tutorial, it's not meant to be a tutorial about Docker as much as it is about using New Relic's monitoring tools together with your Docker-based applications.
That's why, to get the most out of the tutorial, you should be at least somewhat familiar with Docker. Also, a basic understanding of the Linux command line is expected.
Set Up the Docker Containers
In short, Docker is a tool for packaging your application's components and their dependencies into well-documented, self-contained units that can be deployed quickly and reliably into different environments—be it a development machine or a cluster of production servers.
These building blocks are called containers—a concept close to a virtual machine, but not quite. Whereas a virtual machine runs its own operating system, containers all run on the same host operating system but each have their own dependencies and libraries. Containers can also be linked to each other to allow them to share, for example, their resources.
To learn more about Docker, the best place to start is the tool's online documentation. It is well written and will guide you by the hand.
Then, once you feel comfortable about trying Docker in action, let's get started with our setup!
What Will We Build?
Before we get started with implementing our Docker and New Relic setup, here's an image showing an overview of the basic architecture that we're going to build in this tutorial:
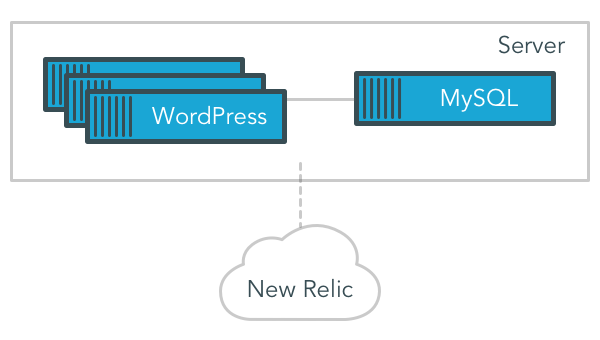
As I mentioned in the introduction, this is a simplified hosted WordPress service: In three containers (an arbitrary number), we'll run a WordPress installation in each. The WordPress containers are all linked to a container running MySQL. All of this will run on one server—which in the example will be hosted on Amazon Web Services, but can be any server capable of running Docker and New Relic's monitoring tools.
The server and the containers running inside it will be monitored by New Relic's APM (Application Performance Monitoring) and Servers tools.
I designed this setup mostly for demonstration purposes, but it is actually modeled after something I'm building in my own project: just by adding an admin tool, a proper DNS configuration, and an Nginx reverse proxy—all of these running in their own Docker containers—the setup can be built into a fully functional hosted WordPress service. This, however, is outside the scope of this tutorial, so let's get back to running some WordPress containers.
Step 1: Start a New EC2 Machine
I like to use Amazon Web Services when I need a web server for experiments like this: the servers are cheap to start, and you only pay for the time you use them (just remember to stop them when you're done!).
However, there's nothing Amazon-specific about using Docker with New Relic, so if you prefer some other virtual server provider or have a server of your own on which you can install Docker and the New Relic monitoring tools, these are all good options.
In that case, you can skip this step and move straight to installing Docker on the server machine (Step 2).
In my earlier tutorial, Get Started With Monitoring Your Web Application Using New Relic Alerts, I included detailed, step-by-step instructions for starting a machine in the Amazon cloud. Follow those instructions, in the tutorial's Step 1, but don't install PHP or start Apache just yet as this time, because Apache and PHP will go inside the Docker containers.
If you're already familiar with AWS and just want a quick reminder of which options to choose when starting the machine, this short list will guide you through the process:
- Sign in to the AWS console, creating an account if you don't have one yet.
- In the main menu, choose EC2. You'll notice that Amazon has recently launched a new service for running Docker containers in the cloud (EC2 Container Service), but this time, we'll want to manage Docker ourselves.
- Select Launch Instance to launch a new machine. Go with the Quick Start option and pick the default, 64-bit Amazon Linux server. For testing, a t2.micro machine size is just fine.
- On the security group page, open the HTTP port and make SSH available only from your IP by selecting the My IP option.
- Click Review and Launch to start the server. When you're asked to create a key pair, create one (name it for example
docker_test) and download it.
After a minute or so, you'll notice that your machine is up.
Right click on its name and choose the Connect option. Copy the machine's IP address from the popup and use it to connect to the machine using SSH (place the IP address where it says INSERT_IP_HERE in the commands below):
cp ~/Downloads/docker_test.pem.txt ~/.ssh/docker_test.pem
chmod 400 ~/.ssh/docker_test.pem
ssh -i ~/.ssh/docker_test.pem ec2-user@INSERT_IP_HERE
Step 2: Install Docker on the Server
Now that you have started a server and you are connected to it over SSH, it's time to install the Docker engine.
The instructions in this step are for the Amazon Linux server we created in Step 1. If you are using a different operating system, see the Docker documentation for installation instructions specific to your environment.
Start by installing the docker package:
sudo yum update
sudo yum -y install docker
The -y option makes yum automatically answer yes to any questions about the installation. It makes things quicker, but if you want to play safe, feel free to leave it out.
Once the Docker package has been installed, start it as a service:
sudo service docker start
Now, you'll find Docker running for the rest of this server's runtime (or until you stop it yourself).
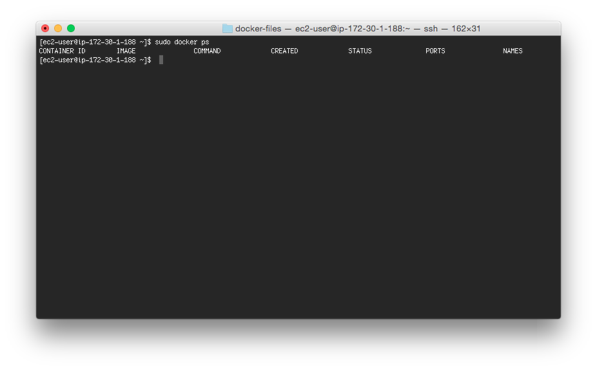
To test the installation, you can use the docker ps command which lists the running Docker containers:
sudo docker ps
At this time, the list is still empty, as we haven't yet started any containers:
Finally, add the default user to the docker group so you can control Docker without having to prefix all your Docker commands with sudo. It's just four extra letters, but makes a big difference when you have to write it often!
sudo usermod -a -G docker ec2-user
To apply the change to your connection, close the ssh connection and connect again.
Now, you're all set to start some Docker containers.
Step 3: Start the Docker Containers
If you search for WordPress and Docker (or MySQL and Docker), you'll notice that there are many different Docker images to choose from. In your own application, it's a good idea to go through the most popular ones and see which works best for you—or if you should actually write one from scratch.
In this tutorial, I decided to go with official images: the MySQL image provided by MySQL, and Docker's official WordPress image.
First, start a container using the MySQL image, mysql/mysql-server:5.5.
docker run --name db -e MYSQL_ROOT_PASSWORD="mypass" -d mysql/mysql-server:5.5
The command downloads the package and its dependencies and then starts your MySQL container, naming it db. The name is important as we'll use it to link our WordPress containers to the database.
If you like, use docker ps to check that the new container is running. For some more information about the startup, you may check the container's log file with docker logs db. You should see something like this as the last few lines of the output:
MySQL init process done. Ready for start up.

150925  9:03:41 [Note] mysqld (mysqld 5.5.45) starting as process 1 ...
Next, start a WordPress container using Docker's WordPress image, wordpress:latest (using the latest tag, you'll always get the most up-to-date Apache-based version).
docker run --name wordpress-1 --link db:mysql -e WORDPRESS_DB_NAME="wordpress_1" -d -p 80:80 wordpress:latest
In the command above, you'll notice that we link the container to the MySQL image above (--link db:mysql) and pass the name of the database to use as an environment variable (-e WORDPRESS_DB_NAME="wordpress_1"). This container listens to the standard HTTP port 80.
The root user's database password is shared automatically when we link the db container.
Once the image has been loaded and the container is running, visit the machine's URL to check that the container is working as it should. When working on AWS, use the Public IP from Step 1.
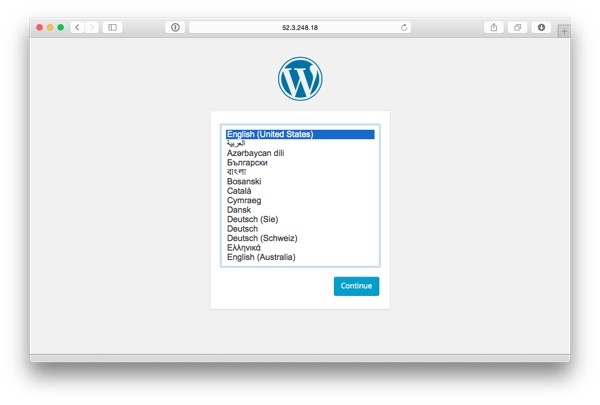
Finish the WordPress installation if you like—it only takes a minute or two.
You have now started the first of the three WordPress containers. Before we add the rest, let's set up New Relic monitoring for the current setup.
Install New Relic Server Monitoring With Docker Support
New Relic's Docker support is divided into two parts:
- In the Servers part, you'll find overall information about Docker: things like how many containers of different types are running, or how much of the resources they are using on each of your servers.
- In the APM part, you can access the Docker containers as parts of your web applications, monitoring them together as well as individually on the application level.
Let's begin with the Servers part.
Step 1: Install the New Relic Server Monitor
As New Relic runs as an online service, to use the New Relic monitoring tools, you'll first need an active New Relic account. You can start with a 14-day free trial or use the free version—all of the functionality presented in this tutorial is available in the free version.
If you don't have a New Relic account yet, start by signing up.
Once signed up, select Servers from the top menu to access the server monitoring tool.

If you are already using New Relic Servers, you'll see a list of your servers monitored with New Relic. Click on the Add more button for setup instructions.
If you just signed up, you'll be sent straight to the Get started with New Relic Servers page.
On this page, you'll find instructions specific to the different environments. Pick the one that matches your server. For the Amazon Linux setup used in this tutorial, we'll go with the Red Hat or CentOS option.
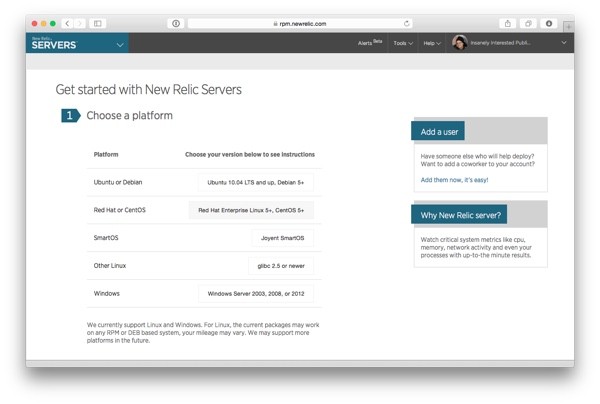
Scroll down, and finish the installation according to the instructions matching your server environment.
In the case of Amazon Linux, start by adding the New Relic yum repository. Notice that this needs to be done as root, so we'll use sudo.
sudo rpm -Uvh http://download.newrelic.com/pub/newrelic/el5/i386/newrelic-repo-5-3.noarch.rpm
Next, with the yum repository added, use it to install the Server Monitor package:
sudo yum install -y newrelic-sysmond
Again, the -y parameter makes yum answer yes to every prompt. If you want to be more careful, feel free to go without it and accept the prompts manually.
To complete the installation, configure the monitoring agent and set your license key. You'll find a version of the command with your license key in place on the Get started with New Relic Servers page. Remember to prefix the command with sudo.
sudo nrsysmond-config --set license_key=[KEY HERE]
Before starting the monitoring daemon, we'll divert a bit from the setup instructions on the New Relic Servers page and make a few additional configurations for Docker monitoring.
Step 2: Apply Docker Specific Configuration
First, to allow New Relic to collect data about your Docker setup, add the newrelic user to the Docker group on your server:
sudo usermod -a -G docker newrelic
Then, restart Docker.
Notice that to do the restart gracefully and to make sure nothing breaks in your containers, it's a good idea to stop all running containers first.
docker stop wordpress-1 db
sudo service docker restart
Once the restart is complete, we're all set and you can start the server monitoring daemon.
sudo /etc/init.d/newrelic-sysmond start
The setup for the New Relic server daemon is now complete. Start the Docker containers again, and you'll soon see information about your server in the tool's dashboard.
docker start db wordpress-1
Let's take a look at what you can find there.
What You'll Find Inside New Relic Servers
Inside New Relic, click on the Servers menu item to reload the list of servers. If all went well, you should now see your server listed:
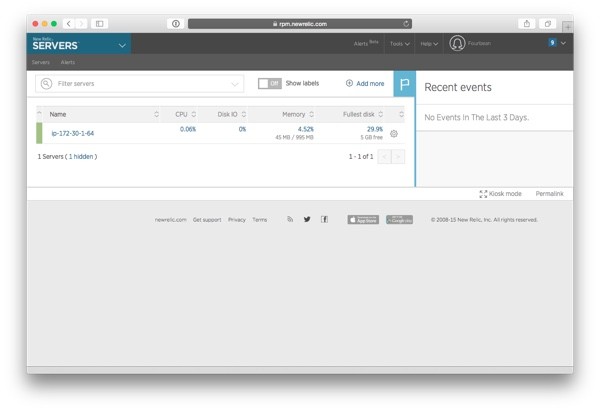
Click on the machine's name to see more information about it. If no data is shown yet, give the tool some time and try again.
The first thing you'll see is the overview page.
Overview
On the overview page, everything looks pretty much the same as it would on a New Relic Servers overview page when monitoring a regular server without Docker.
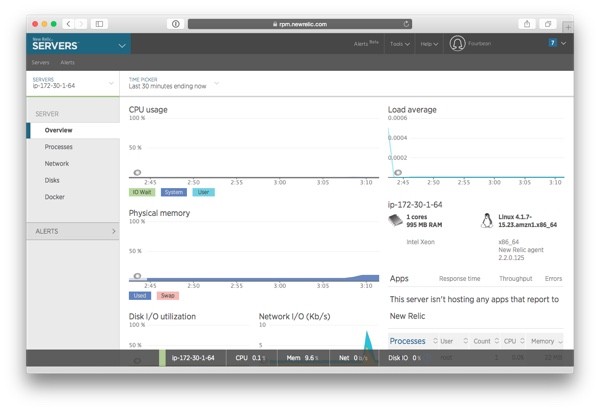
There is the CPU usage, the server's load average, the amount of physical memory used, some information about Disk I/O and network usage. As we just started the server and there are no users visiting the site, most of these figures are still low.
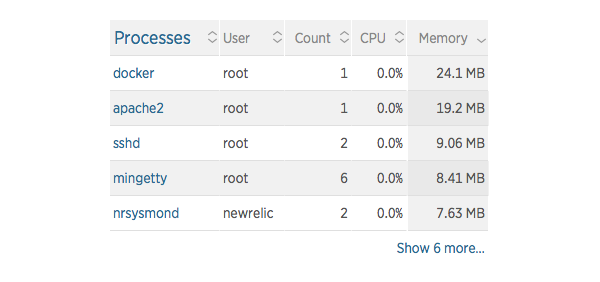
If you look at the list of processes on the bottom right, you'll notice that Docker is indeed running on this server:
The Docker Images View
The overall view is important when thinking about the server's health as a whole, but now, what we are really interested in is what we can learn about the Docker setup. For this, the more interesting part of Servers is the Docker menu.
Click on the Docker menu item on the left.
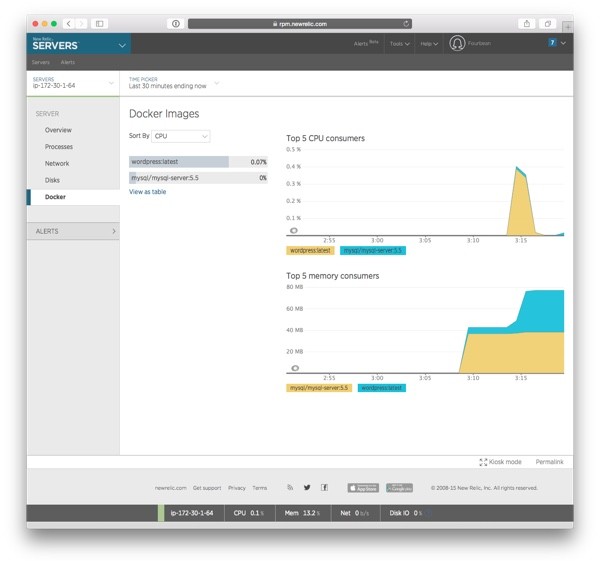
The Docker screen shows the percentage of the server resources your Docker containers are using, grouped by their images.
In this case, for example, you'll see the two images, wordpress:latest and mysql/mysql-server:5.5, that we used to start our two containers in the previous steps. There isn't much activity on the server, but we can see that WordPress is using more of the CPU, and both use about the same amount of memory.
You can use the drop-down on the top left corner to sort the list by either CPU or Memory.
Later, as your application matures, the findings from this page will tell you more about your setup and what you should do with it.
For example, if you notice that MySQL is using a lot of the system's memory and processing power, it might be a good time to consider moving it to its own dedicated server. Or maybe you'll notice that there are more WordPress containers running on the server than what really fits and decide to split them into two...
A Closer Look at One Docker Image
If you want to learn more about a specific image, click on its name on the list on the left. This will open a view that shows information about just the containers using this image.

The screen shows you the CPU and memory usage from containers using this image and the number of containers over time.
To see how adding more containers affects the view, add a couple more WordPress containers. We'll use the same docker run command from earlier, with a few small changes:
- The new containers will be named
wordpress-2andwordpress-3respectively. - The new containers will use databases
wordpress_2andwordpress_3. - The new containers will listen to different ports,
8000and8001instead of80.
Here are the two run commands with the changes from the list above in place:
docker run --name wordpress-2 --link db:mysql -e WORDPRESS_DB_NAME="wordpress_2" -d -p 8000:80 wordpress:latest
docker run --name wordpress-3 --link db:mysql -e WORDPRESS_DB_NAME="wordpress_3" -d -p 8001:80 wordpress:latest
On Amazon, to make the new WordPress sites accessible, you'll still need to edit your EC2 instance's Security Group settings to allow incoming traffic from ports 8000 and 8001. Use the Custom TCP Rule option and select Anywhere as traffic source.
Now, visit the two new WordPress sites, clicking on some of their menu items.
Then come back to New Relic Servers to see how the data on the Docker page changed.
The first, and most visible change is the number of containers running. Instead of one, there are now three:

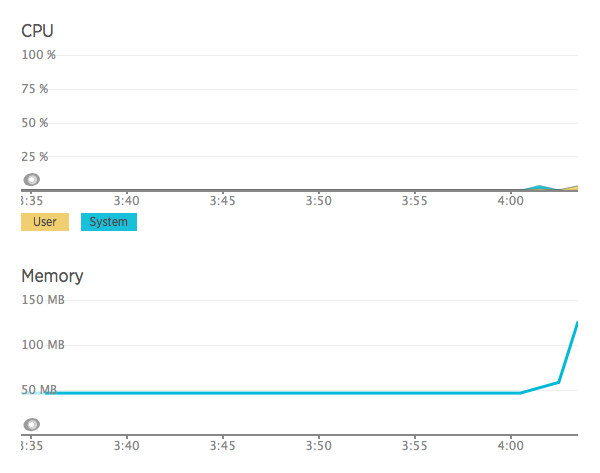
CPU and memory usage is still low—although the use of memory shows growth:
Adding Support for New Relic APM in Your Docker Containers
So far, we have looked at the Docker containers from the outside, through their resource usage, and how they look when explored from the server running them.
But even though this Servers view to Docker does provide useful overall information about your server and what's running inside it, the true power of New Relic lies in its application-first approach: by monitoring the application level, you can gain more detailed information about what is happening on your server and what to do about it.
Normally, when running the PHP code directly on your web server, you'd simply install the APM monitoring agent. For an example of this, you can look at the right there on the server on which you're running the application (as we did in the New Relic Alerts tutorial I mentioned earlier).
Now, things are a bit different: We have split the architecture into separate pieces—"micro services"—each running in their own containers, and so the host server itself isn't running Apache or PHP. That's why, if you were to install the APM agent directly on the host server, you wouldn't see any activity whatsoever.
The monitoring needs to go inside the containers.
Step 1: Create Your Own Version of the WordPress Image
One of the great things about Docker is the way it lets you build upon existing images, using them as a base and making them your own without having to change the original image or write a new one from scratch.
We will modify the WordPress image we used earlier in the tutorial by enabling New Relic monitoring inside it.
You can download the source file for the Docker image from the linked GitHub repository, or you can create it yourself by following the instructions in this tutorial. When working with this example, it's probably easiest to do it right there on your server.
Start by creating a directory for the new image definition, for example in ec2-user's home directory.
mkdir wordpress-newrelic
Then, in that directory, add a new text file, naming it Dockerfile. This is the file that will contain the definition of what goes into your Docker image.
Inside the file, add the following code. We'll go through the contents line by line right after the snippet.
FROM wordpress:4.3.1-apache

# Add custom script for running New Relic daemon
ADD run.sh /run.sh
RUN chmod +x /run.sh

# Modify the default entrypoint to call our new run script at its end
RUN sed -i "s/exec \"\$@\"/exec \"\/run.sh\"/" /entrypoint.sh

# Add a simple phpinfo() page for testing
ADD test.php /var/www/html/test.php

# Install New Relic daemon
RUN apt-get update && \
    apt-get -yq install wget && \
    wget -O - https://download.newrelic.com/548C16BF.gpg | apt-key add - && \
    echo "deb http://apt.newrelic.com/debian/ newrelic non-free" > /etc/apt/sources.list.d/newrelic.list

RUN apt-get update && \
    apt-get -yq install newrelic-php5

# Setup environment variables for initializing New Relic
ENV NR_INSTALL_SILENT 1
ENV NR_INSTALL_KEY **ChangeMe**
ENV NR_APP_NAME "Default App Name"
Now, let's go through the file and see what it does.
Line 1: The file starts by specifying the Docker image that our image should be built on. I picked a specific version of the wordpress image so that if we build this image again after a while, it will not have changed in between. 4.3.1-apache is the latest version at the time of writing.
Lines 3–5: Include a script for initializing the New Relic monitor. The script will be run at container startup so that we can use it to define the application's name and license key separately for every container.
We'll look at the contents of this file in the next step.
Lines 7–8: If you look closely at the code defining the base WordPress image, you'll notice that the script, apache-entrypoint.sh, defined to run as its ENTRYPOINT ends with a line that executes the command passed in the CMD option (by default, this is apache2-foreground).
The line looks like this:
exec "$@"
As I didn't want to replace the original "entrypoint" script but needed to have it finish by calling the new run.sh script we just mentioned above, I decided to edit the ENTRYPOINT file at compile time: the sed command (on line 8) replaces the exec line from above with an exec command that executes run.sh instead.
Lines 10–11: This is probably not something you'll want in a production setup. However, for testing it's very handy to include a simple PHP file that we can use to check if New Relic was set up correctly.
Make sure to also create a file named test.php with the following content:
<?php phpinfo(); ?>
Lines 13–20: This is the part where we install the New Relic monitoring package into the image.
If you look at the installation instructions on New Relic's Get Started with New Relic page (the first page you'll see when you choose the APM option after signing in), you'll notice that the commands on these lines are closely following the installation instructions for the Debian environment. This is because the default WordPress image is based on an image that uses Debian.
First, the script installs wget and uses it to download the New Relic key and add it to APT.
Next, the script adds the New Relic repository to APT.
And then, finally, on lines 19 and 20, it installs the newrelic-php5 package from that repository.
Lines 22–25: The New Relic installation instructions on the Get started with New Relic page continue with finalizing the installation and putting the license key in place.
As the license key and application name are quite container-specific information, we can't include this final step in the image. Its place is only at startup, in our run.sh script.
To prepare for this, the script defines three environment variables:
-
NR_INSTALL_SILENT: This variable, if present (and set to any value) will cause the New Relic installation script to skip all user prompts and use defaults instead. -
NR_INSTALL_KEY: This one specifies the license key. As we don't want to hard-code a license key in the image definition, it's set to**ChangeMe**for now. This variable is also read automatically by the install script. -
NR_APP_NAME: This is a variable I added myself, which will be used in therun.shscript to edit the New Relic daemon's configuration to use the container's actual application name instead of the default ("PHP Application").
Step 2: Create the Custom Startup Script
With the Dockerfile ready, we still need to implement the startup script, run.sh, mentioned above. The script will finish the New Relic setup and only then start the server, now with New Relic monitoring in place.
Create the file and add the following code into it:
#!/bin/bash
set -e

echo "Enabling APM metrics for ${NR_APP_NAME}"
newrelic-install install

# Update the application name
sed -i "s/newrelic.appname = \"PHP Application\"/newrelic.appname = \"${NR_APP_NAME}\"/" /usr/local/etc/php/conf.d/newrelic.ini

exec "apache2-foreground"
Now, let's go through the code line by line.
Line 1: Specify that the script should be run with the bash interpreter.
Line 2: Specify that the script should exit if an error occurs.
Lines 4–5: Run the New Relic installation script. Notice that we don't need to pass in any parameters as the configuration is done using environment variables. NR_INSTALL_SILENT was already specified in the Dockerfile and NR_INSTALL_KEY should be passed in with the docker run command.
Lines 7–8: As the installation script doesn't have an environment variable for specifying the name of the application, we'll have to edit the configuration manually—or actually, programmatically—in this script.
In the configuration file, the application name is specified as:
newrelic.appname = "PHP Application"
The sed command on line 8 looks for this string and replaces it with a version that includes the name defined in NR_APP_NAME.
Line 10: Finally, to complete the startup, call apache2-foreground to run Apache in the foreground and keep the container running. As you remember from earlier, this was originally done at the end of the entrypoint script.
Now, all the pieces for augmenting the WordPress image with New Relic monitoring are in place. We can now build the image and give it a try.
Step 3: Compile and Run the New Image
In the directory where you placed the files created during the past two steps, enter the command:
docker build -t tutsplus/wordpress-newrelic:4.3.1-apache .
This creates a new image, named tutsplus/wordpress-newrelic with the tag 4.3.1-apache, and adds it to your local Docker image repository.
Once the build completes, it's time to see if everything is working properly.
First, stop and remove your existing WordPress containers:
docker stop wordpress-1 wordpress-2 wordpress-3
docker rm wordpress-1 wordpress-2 wordpress-3
Then, run new ones, starting with just one and adding more once you've checked that everything is running smoothly.
docker run --name wordpress-1 --link db:mysql -e NR_INSTALL_KEY="YOUR KEY HERE" -e NR_APP_NAME="wordpress-cloud" -e WORDPRESS_DB_NAME="wordpress_1" -d -p 80:80 tutsplus/wordpress-newrelic:4.3.1-apache
The command is mostly the same as what we saw earlier when starting the default WordPress image, with the following changes:
-e NR_INSTALL_KEY="YOUR KEY HERE": This is where you specify the New Relic license key that should be used in the install script. You can find yours by going to APM's Get started with New Relic page and choosing the PHP option.
On this page, right before the installation instructions, there's a red button that says Reveal License Key. Click on it and then replace YOUR KEY HERE with the key shown.

-e NR_APP_NAME="wordpress-cloud": This part of the command sets the environment variable used for specifying the application's name. This name is used to group the data inside APM.
The "correct" value for a container's name depends on your setup and how you want to monitor it. If all of your containers are running pieces of the same application, it will make sense to use the same name for them and collect them all in the same view in the monitoring tool. On the other hand, if the containers are clearly separate, distinct names are the way to go. In this example, I decided to use the same name, wordpress-cloud, for all three containers.
Check the New Relic documentation for a more detailed discussion on naming your applications.
tutsplus/wordpress-newrelic:4.3.1-apache: At the end of the command, you'll notice that we now use the newly created image instead of wordpress:latest.
Once you've run the command and your server has started, visit the WordPress test page to verify that the server is running and New Relic is included. You may also want to check the value of newrelic.appname.
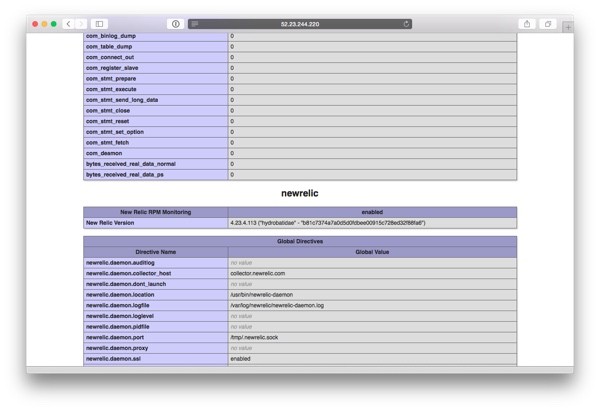
Then, you can again go to the main page to find WordPress running OK. You now have a Docker container running WordPress and reporting its state to New Relic APM.
Add the remaining two containers, wordpress-2 and wordpress-3, and then let's take a look at the data we'll find in APM.
What You'll Find Inside New Relic APM
Now that you have set up the monitoring for each of your Docker containers, let's take a look at the information we can find about them in APM.
As we added all three WordPress containers with the same name, when you now open the APM page, you'll find just that one application, wordpress-cloud. When you place your mouse pointer on top of the application's name, you'll see a popup saying "Php application running on 3 hosts (3 instances)."
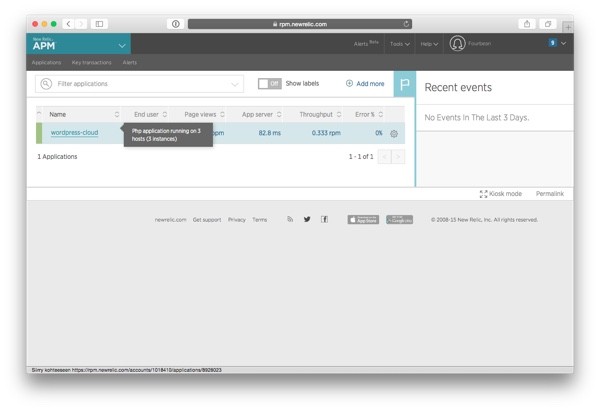
Click on the name to access the analytics data for this application and its containers.
Overview
The first view you'll see in APM is Overview. This page shows a summary of the performance of all of the containers in this application: how long requests made to the application take on average, the application's Apdex score, its throughput, and a list of the application's slowest transactions .
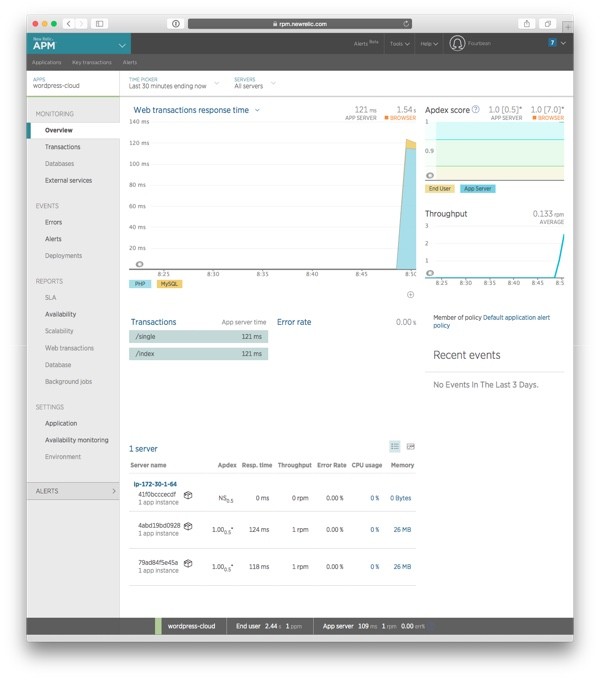
At the bottom of the screen, you'll find a summary of the structure of the application: what servers it's running on, and the containers in use inside them.
In a more complex, real-life application, you might see multiple servers as well as multiple containers. Now, you'll find our three WordPress containers. As we didn't install New Relic to the database image, we can't see it on this list.
Filtering Data by Container
Similar to the overview page, by default, the rest of the screens in APM will show you a summary of the entire application's performance in the various metrics presented in them.
However, if you want to drill down to a specific container, you can at any time use the drop-down menu at the top of the screen to choose the one you are interested in:
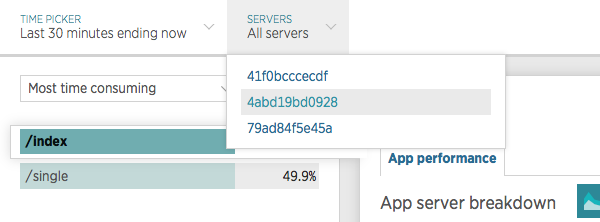
If you are not sure what the different server codes on this list mean, you can use the docker ps command to find the mapping between these Docker IDs and your containers.
Finding and Fixing PHP Errors in Docker Containers
APM is not only useful for tracking the performance of your web-based application. It is also a great help in noticing when something goes wrong in your application and locating the issues.
To test this in a Docker-based environment, I created a simple WordPress plugin, intentionally placing a couple of errors in the code, and installed it on one of the containers. Then, after browsing the site for a while, this is what I saw on the Errors page in APM:
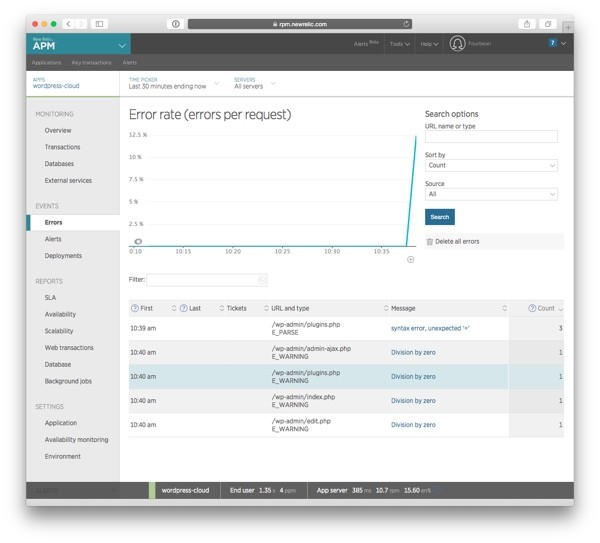
Looking at the picture, you'll quickly see that the error rate in your application is on the rise.
Below the graph, you'll find a list showing the recent errors: a syntax error that has occurred three times and a division by zero, taking place at various places in the code. Both need to be addressed, but for now, let's look at the first one.
Clicking on the error message will bring you to a page that shows more information about the error:
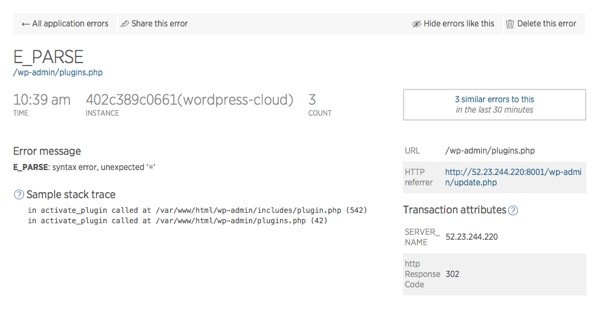
Looking at this screen, you'll see that the error is occurring on one of the Docker containers, 402c389c0661, which just happens to be the ID of wordpress-3, the container on which I installed the broken plugin.
Now that we have found the container on which the error happens, we can use the stack trace to fix the problem and update a working version of the plugin to the affected container. Issue solved.
Conclusion
You have now implemented a simple Docker-based web server setup and enabled New Relic monitoring on it. You have also seen how you can use the monitoring tools to gain better visibility into the Docker-based application.
However, we have only scratched the surface of what you can do with the New Relic monitoring tools, so if you are not yet a New Relic user, take a look at the Docker Monitoring page at New Relic, and get started.


Comments