Introducing Raygun
Nobody writes bugs into their software on purpose, but have you ever considered just how many problems exist in your software applications that you aren’t even aware of?
Have you ever received support requests and been unable to replicate a problem, or do you spend hours looking through log files to find the root causes of issues? We’ve all been there, dealing with unexpected issues that occur in our codebase.
The picture is not always clear as to what the route cause of the problem was, and your team might be spending hours hunting through logs to work it out.
Raygun offers solutions this problem, with a real-time window into how your application is performing for your customers, helping you pinpoint the improvement that needs to be made in seconds. Plus, Raygun offers workflow functionalities to collaborate with your fellow developers all the way through to deploying the fix.

The Raygun platform offers essential software development tools that help keep a watchful eye on your web and mobile apps when issues arise. Offering both Error and Crash Reporting software, which helps detect, diagnose and destroy any exceptions your users encounter, and a Real User Monitoring tool that monitors each user session for things like slow loading assets, scripts and requests that could be slowing down your application’s performance, Raygun covers all bases.
Today we’ll be taking a deeper look into how you can set up real-time error and crash reporting for your applications with Raygun, regardless of which programming language and platform you use.
If you've ever clicked "Don't Send" on an operating system crash reporting dialog then you know that few users actively report bugs—most simply walk away in frustration.
In fact, a survey by Compuware reported that only 16% of users try a crashing app more than twice. It's vital to know if your software is crashing for your users. Raygun makes this easy.
With just a few short lines of code, you can integrate Raygun into your development environment in minutes. Raygun supports all major programming languages and platforms, so simply select the language you want to get started with. You'll instantly begin receiving reports of errors and crashes and will be able to study diagnostic information and stack traces on the Raygun dashboard.
For this tutorial, I'll show you examples of tracking JavaScript apps such as Ghost and PHP-based WordPress, but Raygun works everywhere: front end, back end, web, and mobile.
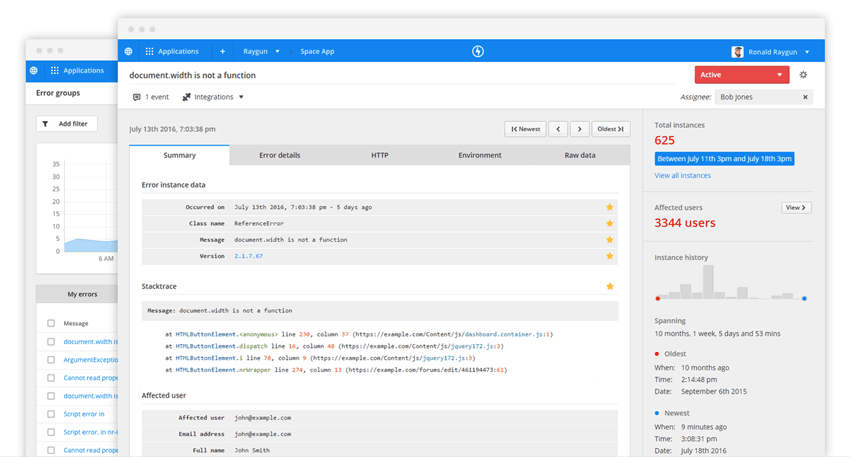
By pinpointing problems for you and telling you exactly where to look, Raygun helps you build healthier, more reliable software to delight your users and keep them coming back.
More importantly, Raygun is built for teams and supports integrations for workplace software such as team chat, e.g. Slack and Hipchat, project management tools, e.g. JIRA and Sprintly, and issue trackers, e.g. GitHub and Bitbucket. Raygun gives your team peace of mind that your software is performing as you want it to—flawlessly.
How cool are real-time Slack notifications for your entire team whenever your customers are encountering bugs, issues, and crashes!
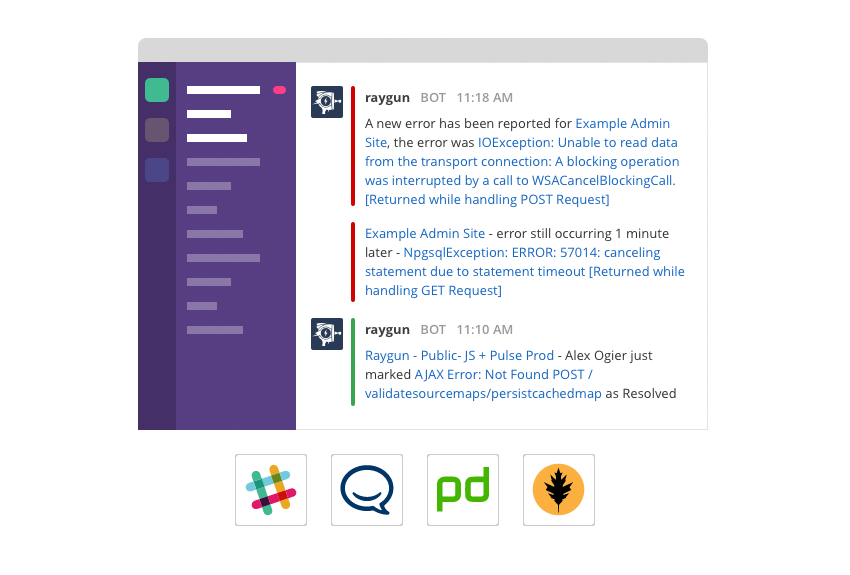
In this tutorial, I'll walk you through setting up your application with Raygun step by step.
If you have any requests for future tutorials or questions and comments on today's, please post them below. You can also reach me on Twitter @lookaheadio or email me directly.
Getting Started
One of the most powerful features of Raygun is that it works with all the major programming languages and platforms, and it's amazingly easy to integrate. Just copy and paste the code into your application and Raygun will start monitoring for errors. In the case of WordPress, they provide a pre-built plugin.
Integrating Raygun With Your Application
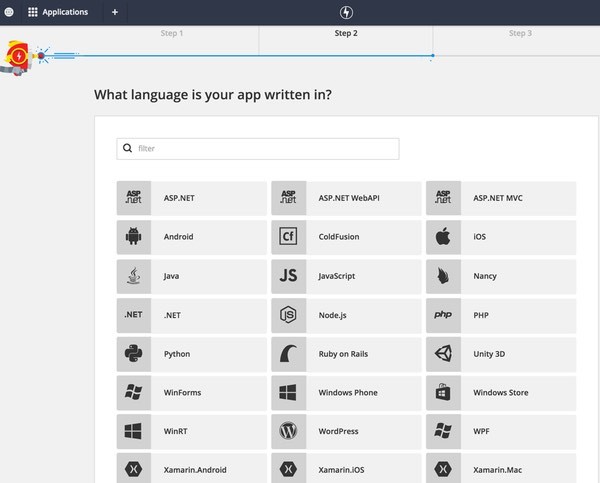
After signing up, you'll be presented with a short Raygun integration wizard. It starts with selecting your language of choice. Here's the initial dashboard that you'll see:
Here's an example of integrating for use with any JavaScript code or platform.
Using Raygun With JavaScript
Once you select JavaScript, you'll be shown your Application API Key (the key is the same for all platforms you choose and is application specific). For each environment or language you want to monitor, you should create a separate application to organise errors into different buckets.
Raygun is easy to use regardless of which JavaScript package management system you prefer:
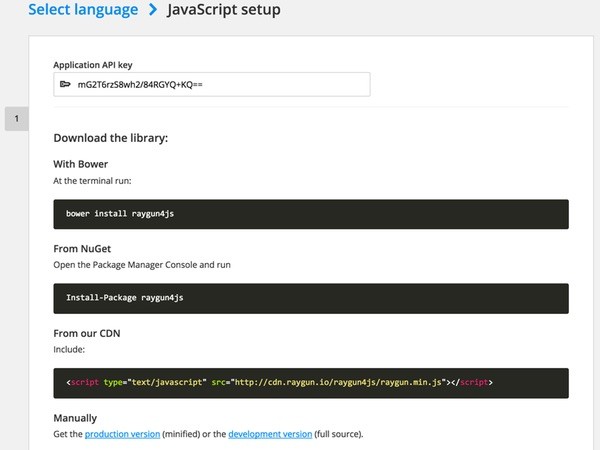
For example, with Bower, run:
bower install raygun4js
From NuGet, open the console and run:
Install-Package raygun4js
But you can also just load the library from Raygun's CDN within your application:
<script type="text/javascript" src="http://cdn.raygun.io/raygun4js/raygun.min.js"></script>
You can also download the minified production version or full development source and integrate your own way.
To begin catching exceptions in your application, call Raygun.init with your API key and then call attach:
<script src="dist/raygun.min.js"></script>
<script>
  Raygun.init('your-api-key-goes-here').attach();
</script>
If you'd like to set up a quick JavaScript-based application to try Raygun out, you might want to try my Envato Tuts+ tutorial walk-through of the open-source Ghost blogging platform.
For this tutorial, I'm going to use Raygun with a WordPress blog—both PHP and JavaScript errors can be caught in this manner.
Debugging With WordPress
To install Raygun for WordPress, you need the Raygun WordPress plugin:
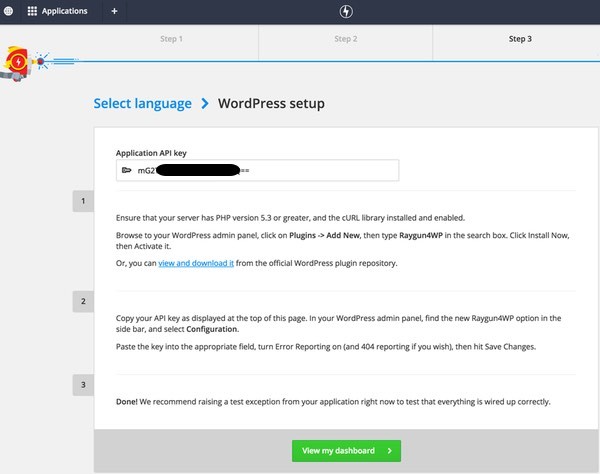
Once you've installed the plugin, you load the configuration menu from the WordPress dashboard and provide your API key:
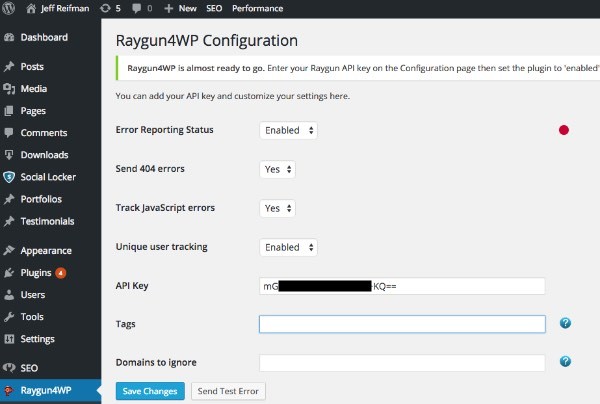
Within a minute, you'll start seeing errors collected in your Raygun dashboard. If not, click the Send Test Error button to trigger one.
The Raygun Dashboard
Initially, you'll see an empty dashboard:
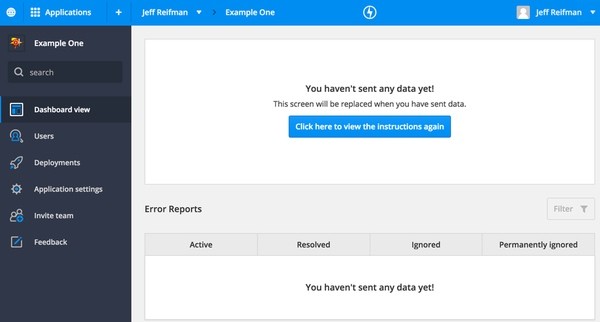
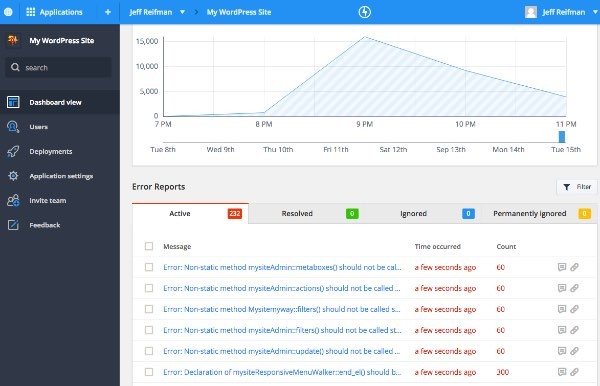
But once you've chosen your language and integrated your application, you'll see a dashboard like this—oh, theme developers—in which Raygun helped me discover a plethora of WordPress theme code that hadn't been kept up to date with the latest versions of PHP.
Tracking Errors Across Code Deployments
When you integrate Raygun with your deployment tools, it can track errors according to specific versions of released software. This can help you identify and repair bad deployments quickly and easily:
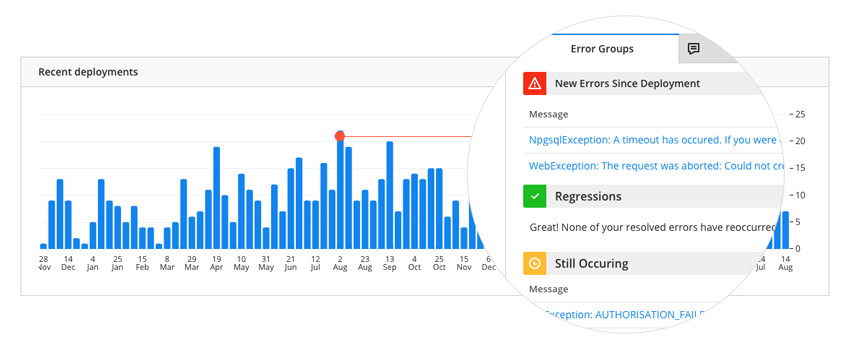
You can read about how to integrate your deployment scripts with Raygun tagging in the documentation. Raygun provides guides for working with: Octopus Deploy, Bash, Powershell, Capistrano, Rake, Grunt, Atlassian Bamboo and FAKE - F# Make.
Managing Raygun Error Statuses
Raygun currently lets you assign error groups to one of five statuses. These are:
- Active
- Resolved
- Resolved In Version x.xx
- Ignored
- Permanently Ignored
When an error is first received, it is assigned to Active and is visible in the first tab. You can then take action to change it to another status.
For example, as soon as I activated Raygun with WordPress and discovered a plethora of theme-related PHP compatibility issues, my email queue began to fill—but this was easily resolved by asking Raygun to only notify me of new reports.
You can also filter and manage issues by status through the interface quite easily. For example, it would be easy to delete all the errors resolved in WordPress version 4.3.
Raygun Error Detailed Views
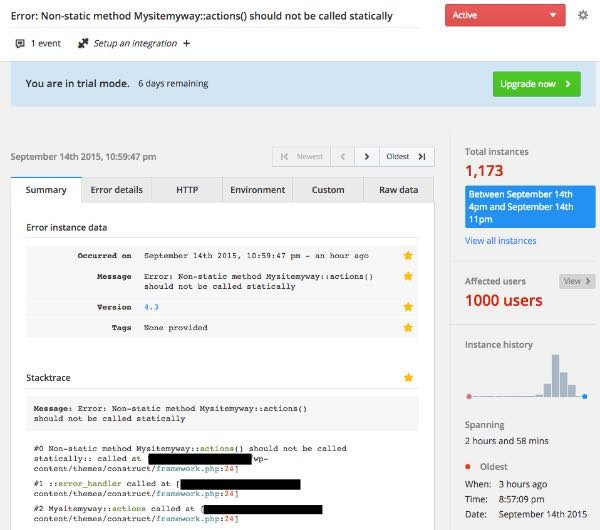
When you click on errors, Raygun shows you their detail view with stack trace and a summary of which users and browsers or devices are being affected:
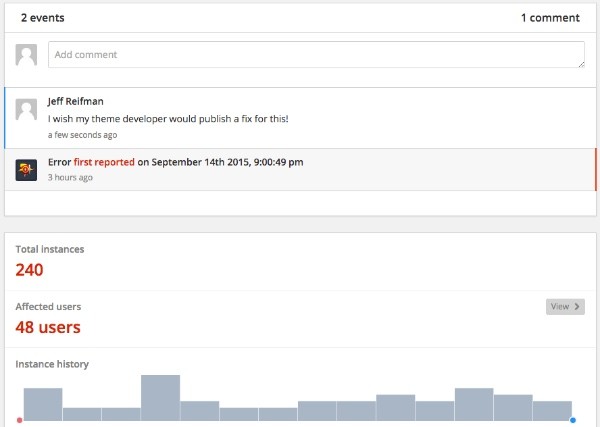
In detail view, Raygun also allows you and your team to comment and discuss specific issues:
Raygun User Tracking
If you implement user tracking with your Raygun integration, you can see exactly which of your authenticated users have run into specific errors and how often:
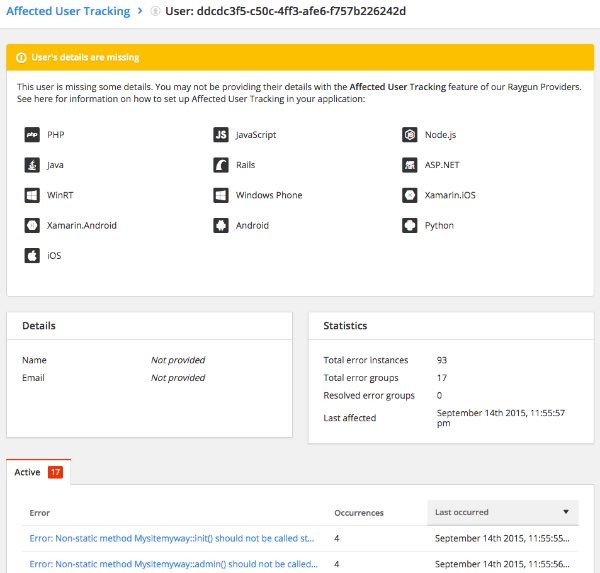
Raygun offers easy documentation for linking error reports to the current signed-in user. Here's an example for JavaScript:
By default, Raygun4JS assigns a unique anonymous ID for the current user. This is stored as a cookie. If the current user changes, to reset it and assign a new ID you can call:
Raygun.resetAnonymousUser();
To disable anonymous user tracking, call Raygun.init('apikey', { disableAnonymousUserTracking: true });.
You can provide additional information about the currently logged in user to Raygun by calling: Raygun.setUser('unique_user_identifier');.
This method takes additional parameters that are used when reporting over the affected users. The full method signature is:
setUser: function (user, isAnonymous, email, fullName, firstName, uuid)
Managing Your Team
Raygun is built around tracking issues across development teams. Through the settings area, it's easy to add applications that you're tracking and invite team members to participate:
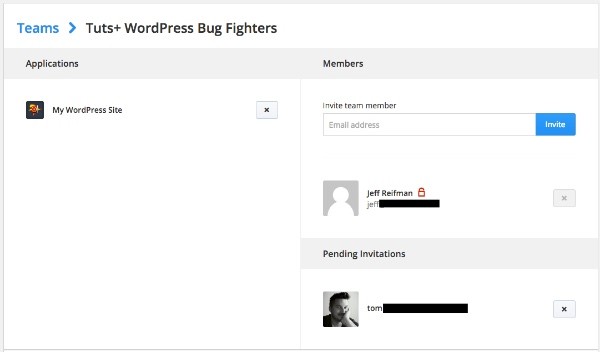
As mentioned above, Raygun easily integrates with other team-based tools such as chat (Slack, Hipchat, etc.), project management (JIRA, Sprintly, etc.) and issue trackers (GitHub, Bitbucket, etc.).
Helpful Customer Support
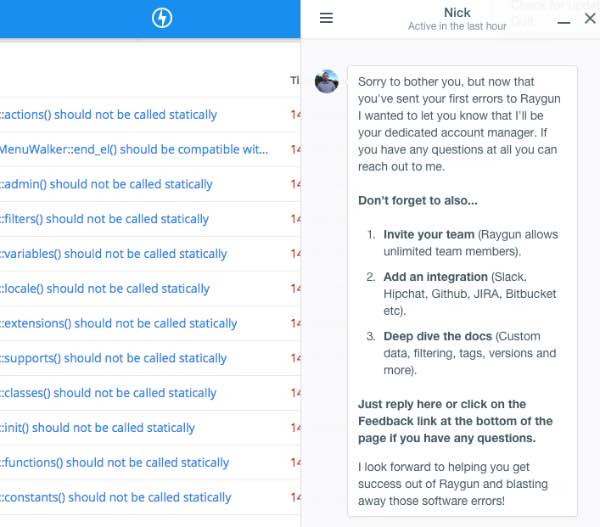
Raygun support is excellent. In addition to the web-based documentation and email welcome guides, there's helpful support personnel (like Nick) ready to guide you deeper into the service—Nick's tips and availability just popped up as I was reviewing the service:
The Raygun API
If you'd like to tailor or customize event triggers, you can post errors via the Raygun API however you'd like from your application. This can be helpful for developers wishing to integrate monitoring or specialized reporting across their services or to make the development process easier.
Raygun Pulse Real User Monitoring
Lastly, even though we talked through the setup of Raygun’s Crash Reporting software here, adding Pulse - Real User Monitoring is just as easy when adding the Raygun code snippet.
Pulse provides you with all the session data from ‘real’ users when they are interacting with your applications. This is far more powerful than traditional synthetic testing, as data is taken directly from the user’s browser, letting you see how a user’s unique device, browser, OS, location or connection speed affected the application’s performance. Problematic scripts, requests and assets can be identified as the route cause and optimizations made to improve the overall performance of your application.
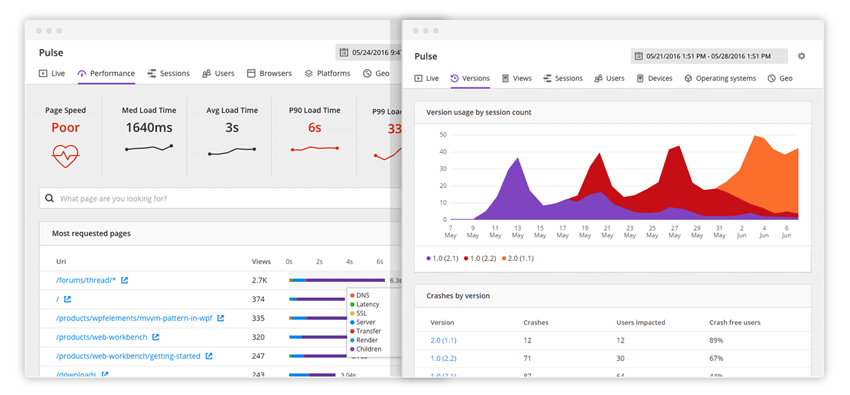
Couple Pulse with Crash Reporting data and you have all the tools available to ensure your customers are receiving a great user experience.
In Summary
I hope you've found Raygun easy to use and helpful to your development requirements. To recap, here are some of the major benefits of the service:
- Raygun provides a complete overview of problems across your entire development stack. Intelligent grouping of errors lets you see the highest priority issues rather than flooding you with notifications for every error.
- Raygun supports all major programming languages and platforms. Every developer can use it. Developer time is expensive, so stop wasting time trying to hunt down bugs. Fix issues faster and build more features instead!
- Raygun is built for teams. You can invite unlimited team members to your account—no restrictions. Raygun helps you create a team workflow for fixing bugs and provides custom notifications and a daily digest of error events for all of your team.
- For large corporate entities, Raygun Enterprise can provide cloud support or the ability to securely self-host a version of the service for your needs.
When you give Raygun a try, please let us know your questions and comments below. You can also reach me on Twitter @lookaheadio or email me directly. Or, if Raygun saves you a ton of time right away, you can browse my Envato Tuts+ instructor page to read the other tutorials I've written.


Comments