Introduction
Let's start with an extreme example. After three years on the market, according to analytics site Think Gaming's estimates, the tower defense hit game Clash of Clans is still the top grossing mobile game today, bringing in an astonishing $1.5 million a day—or a bit over $1,000 every minute. At the heart of the game is a cluster of web servers that take care of everything from user accounts to game events and processing payments.
Imagine if one day the team pushed a new build that broke the payment processing.
Every minute the bug went unnoticed would mean a loss of a thousand dollars!
Now, imagine this bug appeared during the night when there was no one at work...
Your numbers are probably smaller, but the basic concept remains the same: If you make your living from running a web application, any issue with the service, be it a bug in the code or a problem with the server setup, means lost sales.
Even worse: if the bug occurs in a piece of code that you don't test every day, such as the communication between your shopping cart and an external payment provider, it may be days before one of your customers emails you to let you know about the issue!
This is where server monitoring comes to play. While running a good set of tests before every update certainly helps, you can never anticipate everything. You need eyes inside the server; monitoring tools that let you see the key metrics describing your server's health, from server bugs to slow loading times and calls to external services taking longer than they should.
But even monitoring isn't enough when you have a lot on your plate and forget to check your stats—or when problems arise during the night when you are sound asleep.
That's what we'll talk about in this tutorial.
In This Tutorial
While there are various options for both software analytics and alerts tools, New Relic offers one of the most complete solutions for analyzing your servers.
New Relic recently started an open beta for a new product called New Relic Alerts—a layer on top of their set of monitoring tools that you can use to keep yourself and your team updated on any events in your application requiring your attention.
In this tutorial, we'll use New Relic Alerts to create a set of alerts for monitoring a simple PHP application running on an Amazon EC2 instance. While doing this, we'll also talk about the general principles and best practices of defining software alerts to help you create the best possible alerting setup for your business needs.
Set Up New Relic on Your Server
Before you can start using New Relic Alerts, you'll need a New Relic account that has been set up to monitor a web service.
That's why, before we start configuring and testing alerts, I will quickly guide you through the steps of setting up monitoring on a newly created Amazon EC2 instance. For a more detailed look at using the monitoring tools in your own application, I suggest our free course, Monitoring Performance With New Relic.
Previous tutorials by Jeff Reifman and Alan Skorkin will also help you get up to speed. For more information about Amazon EC2, take a look at this tutorial about Installing WordPress in the Amazon Cloud.
If you are already using New Relic on your server, you can skip past this section and continue from the next one, Get Started with New Relic Alerts.
Step 1: Create a New Amazon EC2 Instance
Choosing a server for your application is a question outside the scope of this tutorial. However, for experiments like this, I'm a big fan of AWS: using EC2, I can start and stop servers as I need them, only being charged for the time I use them.
To create a test instance on Amazon EC2, first sign in to your Amazon Web Services admin Console (if you don't have an account yet, you will need to create one before continuing). Then, in the main menu, choose EC2 (Virtual Servers in the Cloud).
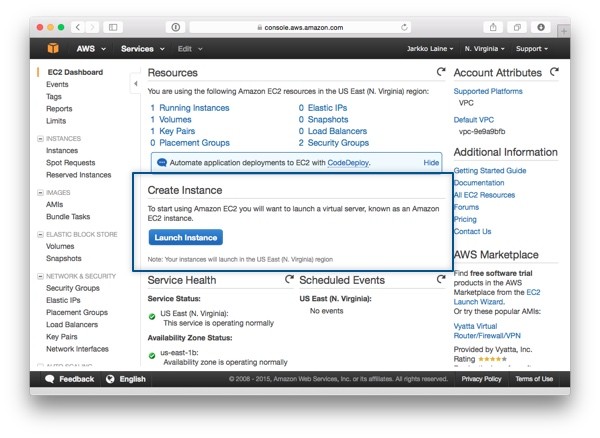
On the EC2 Dashboard, click on the button labeled Launch Instance to start the process of creating a new server:
Next, you'll be asked to choose the Amazon Machine Image (AMI) for the virtual server you are about to start. For this tutorial, the default quick start option, Amazon Linux AMI 2015.03, is just what we need.
Click Select to pick that one.

After choosing the AMI, you'll be asked to Choose an Instance Type—basically the size of the machine. As we'll use the machine for experiments and learning, the smallest one, t2.micro, is a good one to go with:
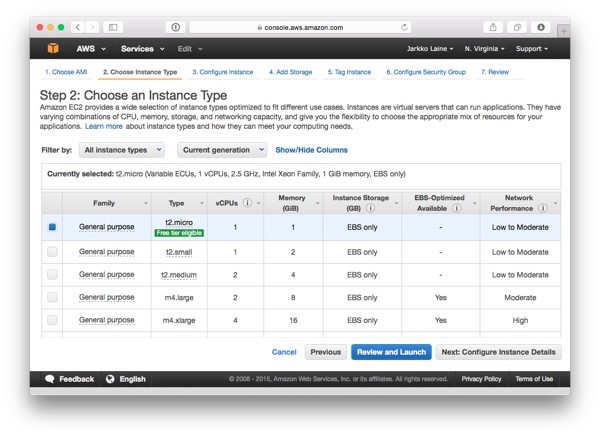
Make sure you have checked the checkbox in front of the correct instance type. Then click Review and Launch to skip straight to the last step in the launch wizard.
On that page, you'll see a notification about improving your security groups.
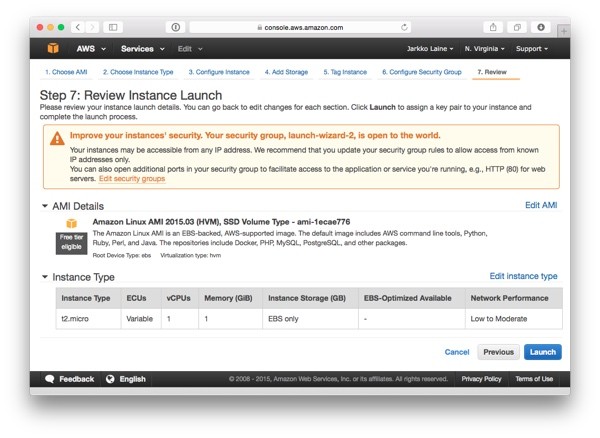
Click on Edit security groups to go back to the security group configuration step. There, make the following changes to your security groups:
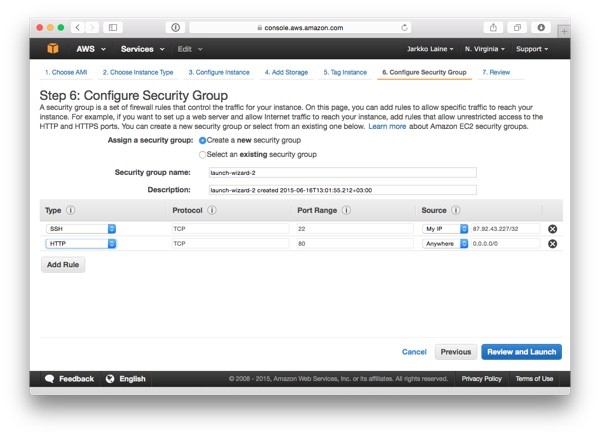
- Edit the existing SSH rule to limit SSH access to just your IP address (select My IP in the Source drop-down).
- Add a new rule to open the HTTP port to everyone (select Anywhere in the Source drop-down).
Here's how the security group settings should look with your changes in place:
After making the changes, click on Review and Launch to get back to the Review Instance Launch page and launch the server.
As the last step, Amazon will ask you to create a new key pair (or to pick an existing one) for connecting to the new server over SSH. Give the key pair a name, download it by clicking on Download Key Pair, and then click on Launch Instances.
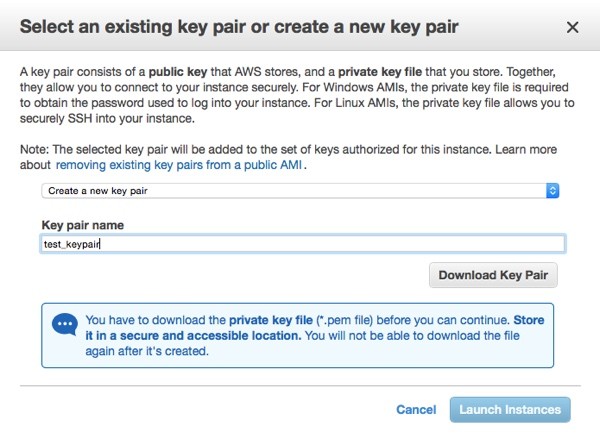
On your computer, move the downloaded key pair file, e.g. test_keypair.pem, from the downloads directory to a better location, and change its access properties so that no one but you can open the file.
Here's an example of how to do this on Mac OS X:
mv ~/Downloads/test_keypair.pem ~/.ssh
chmod 400 ~/.ssh/test_keypair.pem
Now, to connect to the server, check the new instance's IP address from the Amazon EC2 dashboard and connect to it using the key pair file (replace the IP address with one matching your server):
ssh -i ~/.ssh/fourbean_test.pem [email protected]
If your server is up and running, you should now be logged in.
Install PHP using the following command. Accept the suggested packages.
sudo yum install php
Then start Apache:
sudo /etc/init.d/httpd start
You have now created a simple Apache and PHP server setup on Amazon EC2. Next, let's start monitoring it using New Relic APM.
Step 2: Enable New Relic APM on Your Server
First, if you don't yet have a New Relic account, start by creating one.
On the signup page, fill in all of the fields, and then click on Sign Up for New Relic.
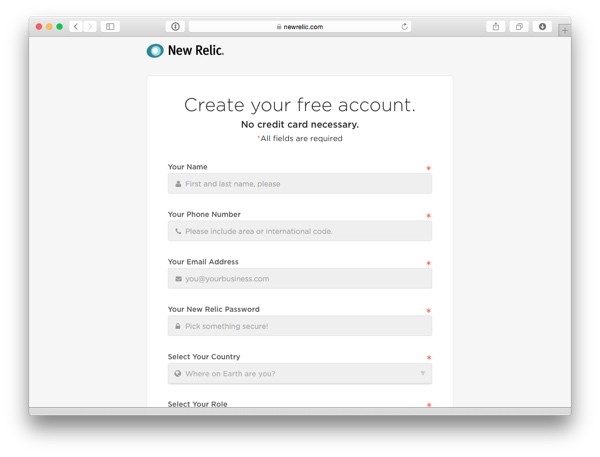
Next, let's set up New Relic's web application monitoring tool, APM.
On the welcome screen, click on the New Relic APM item:
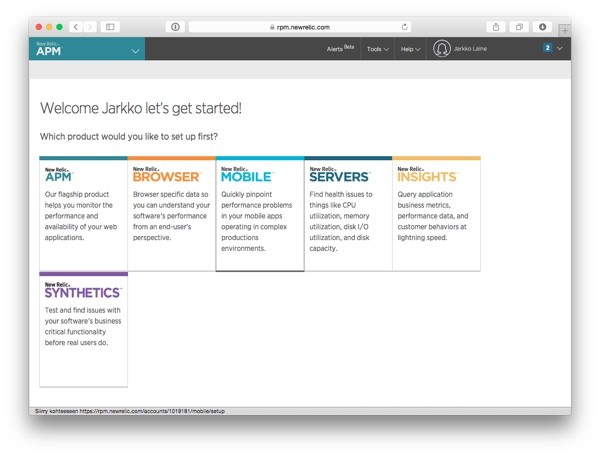
After selecting APM, you'll see a page with instructions for enabling the monitoring in different environments.
If you are setting up New Relic on a server other than the Amazon EC2 based one we created in the previous step, this Get Started with New Relic page is where you're the most likely to find the instructions specific to your environment.
Also, while the installation commands used below are valid at the time of writing, it's a good idea to double-check this page for the most up-to-date instructions.
Now, click on the PHP logo to reveal installation instructions for the PHP Agent.
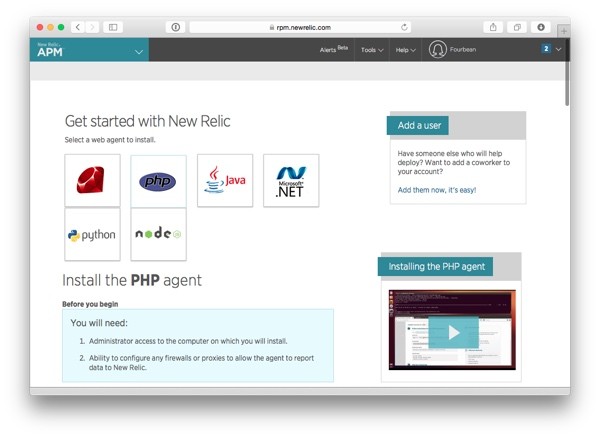
To install the PHP agent, first use SSH to connect to the EC2 instance we created above.
Then, in your SSH window, type the following command to add the New Relic repository (for the EC2 instance defined above, we use the 64-bit version):
sudo rpm -Uvh http://yum.newrelic.com/pub/newrelic/el5/x86_64/newrelic-repo-5-3.noarch.rpm
Then, to install the PHP agent:
sudo yum install newrelic-php5
sudo newrelic-install install
At the end of the installation, the script will ask you to enter your New Relic license key:
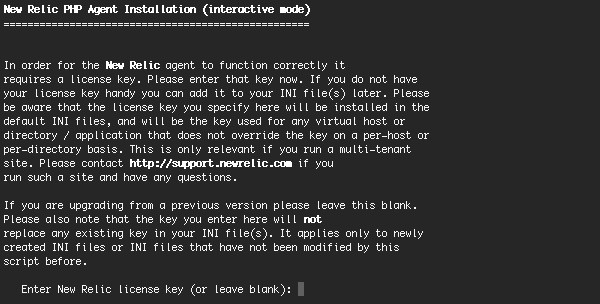
To get your license key, go back to the Get Started with New Relic page and click on Reveal license key.

Copy the key and paste it in the shell prompt to complete the installation.
To apply the changes, restart the web server, and then wait for a few minutes so that New Relic will start receiving data from your server.
/etc/init.d/httpd restart
Once New Relic APM is receiving data from your server, instead of the setup screen shown above, you'll see the APM Dashboard with your PHP Application listed on it:
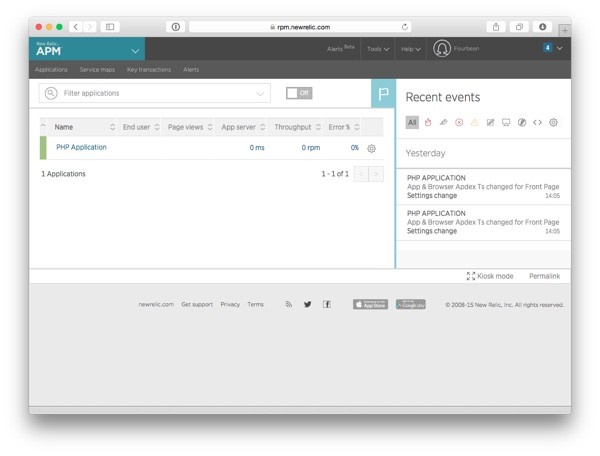
Once this happens, you are ready to start using New Relic Alerts.
Get Started With New Relic Alerts
Now that you have set up your server and have New Relic APM keeping an eye on it, it's time to move to the actual topic of this tutorial: alerts.
Step 1: Enable New Relic Alerts
The first thing to do is to enable Alerts on your New Relic account.
Click on the AlertsBeta link on the top right corner of the New Relic window. Alerts is still a beta feature, so before getting started, you'll be presented with a screen describing its features as well as a list of things that are still being developed.
While most features are already in place, New Relic says Alerts will maintain its beta status until they have added "server not reporting" alerts, API support, and a method for migrating existing alerts to the new system.
During the beta, it is still possible to use the new system side by side with legacy alerts, so even if you are an existing New Relic user, there is no harm in giving Alerts a try.
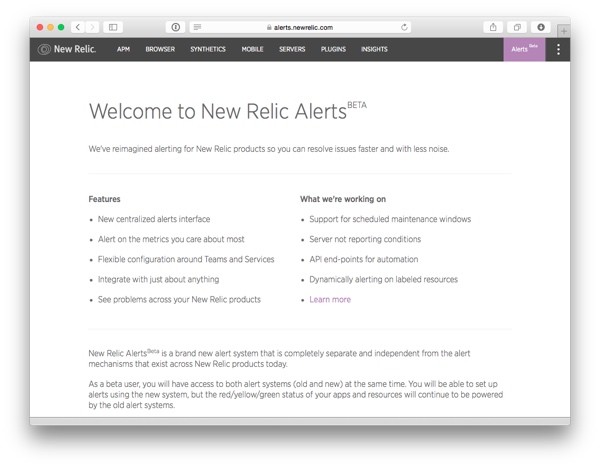
To start using New Relic Alerts, scroll down to the bottom of the page, tick the checkbox that says "I agree to accept the terms and conditions of the New Relic AlertsBeta" and click on the Try it out button.

Step 2: Create Your First Alert Policy
After enabling Alerts, the first thing you'll see is a page for creating an alert policy.
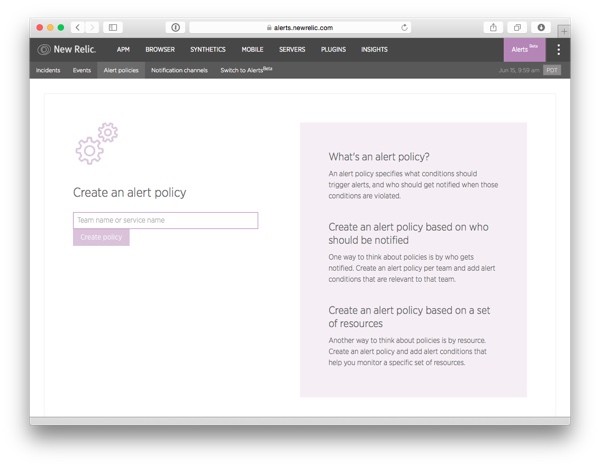
In New Relic Alerts, all alerts are grouped into alert policies that each have their own sets of notification channels. This means that when an alert condition is violated, an alert is sent to all users and communication channels specified in the policy.
That's why the best way to think about alert policies is through the notifications.
Ask yourself two questions:
- Who needs to receive notifications from this set of alerts?
- How should they receive the notifications?
As an example, critical server issues that require immediate attention regardless of the time of day need to be sent to a different group of people and using a different notification channel (the phone buzzing to wake you up) than less severe performance issues that can be solved during the day (an email notification to tell you to start optimizing the code).
But don't get stuck at this step for too long. If you can't think of a perfect way of organizing your alerts yet, that's OK: you can always come back to it and change your alert policies later as you get more familiar with the concept.
In this tutorial, we'll start by creating a simple, all-encompassing alert policy that we'll just call "Application".
Type the name in the text box that says Team name or service name and click on Create policy.
Step 3: Get to Know the Alerts Dashboard
You are now ready to start creating alerts for your application. But before we go there, let's take a quick look at the Alerts dashboard:
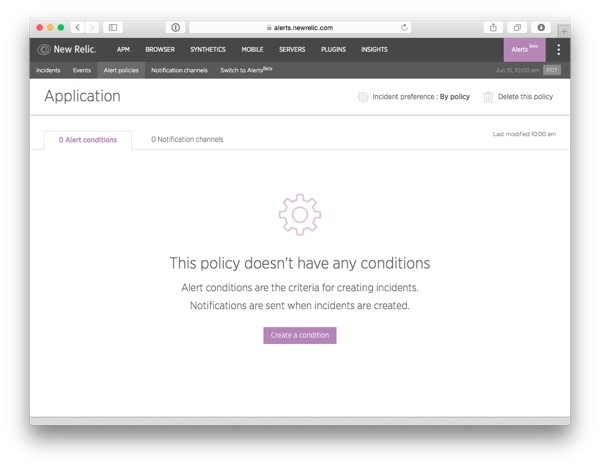
Starting from the left, the options are:
- Incidents: A list of alert violations divided into two tabs. Open Incidents are alerts that have not yet been resolved and require your attention right now. All Incidents is a historical list you can use to look up past alert condition violations and to see what was done to fix them.
- Events: A list of all events from the Alerts system, divided into two tabs. Violations shows all alert condition violations. Events also lists the notifications sent to different notification channels and changes in incident statuses.
- Alert policies: This is the heart of the Alerts system, the set of rules that govern how and when alerts are sent.
- Notification channels: This is where you configure the notification channels used in alert policies to notify you and your team about incidents in your application.
The menu item that comes after these four, Switch to AlertsBeta, confused me at first. Because of its name, I got the impression that I hadn't yet enabled the new Alerts. That wasn't the case, however. Instead, this is an option you can use to go all-in and fully integrate the new Alerts system to your New Relic experience, leaving the legacy alerts behind.
If you click on the menu item, you'll see the following page:
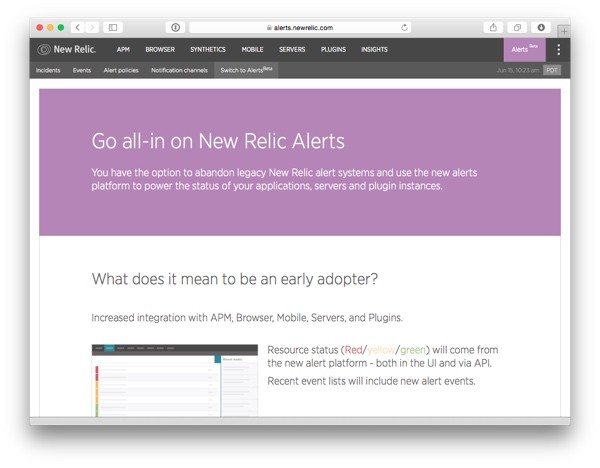
This page gives you an overview of the changes that will take place if you switch completely to the new Alerts functionality. Most importantly, this means a deeper integration to Alerts in the other New Relic products.
If you are already a New Relic user and your current application relies on the legacy alerts system, you might want to think twice before moving on. Also, to follow through the rest of this tutorial, you don't need to go this far—as I mentioned earlier, it's perfectly OK to use the two systems side by side.
But if you're adventurous and like to use the bleeding edge versions of your software, you can very well accept the fact that there is no going back and switch your account to use only the new Alerts functionality by clicking on the Become an early adopter button at the bottom of this screen.
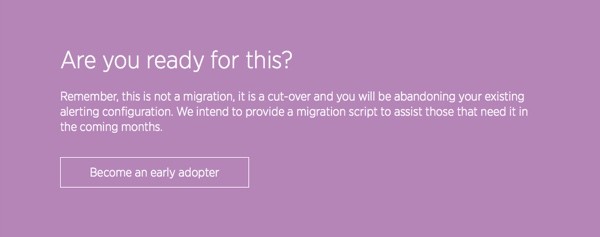
The choice is yours. And whichever way you decide to go, you are now ready to create your first alert.
Create Your First Alert
Now that you have enabled New Relic Alerts and have an overall understanding about the tool, it's time to get to work and create your first alert: an alert that sends a notification using email and Slack if the error rate in your PHP application exceeds 5% at least once in 5 minutes.
I chose this alert because it is an important one, but also because it is easy to test: once the alert condition has been defined, we can break the server and cause the alert to fire without much extra work.
But first, let's talk a little about what makes a good software alert.
Step 1. Decide the Issues You Want to Receive Alerts About
In Aesop's classic fable, The Boy Who Cried Wolf, a bored shepherd boy again and again cries out false alarms about a wolf attacking his flock. In the end, when a wolf finally does appear, the villagers think it's just another false alarm and no one come to his rescue.
Likewise, if you have a software alert that notifies you every day—or even worse, many times a day—about something that you don't need to act on right at that moment, you get used to ignoring the error. Then, when important errors finally arise, they are lost in the noise and you miss them.
This is why you should always start planning your alerts by asking yourself: "How important is this alert?" and "How will I (or my team) react to this alert?"
Your answer, then, will guide what you do next:
- If the alert is something that needs to be addressed immediately, add it to an alert policy that wakes you (or your team) up at any time of the day.
- If the alert is something urgent that can be solved in one day or less, include it in an alert policy that notifies you through a less intrusive notification channel such as email.
- If the alert doesn't require attention in a day or two, it's probably best not to create an alert at all. The issue will be noticed during a casual look at the monitoring tools and can then be marked as a task in your project management tool for later consideration.
Also, make sure that you send the alerts to people who have the means to do something about them. A manager's inbox filling with alerts about bugs in the code is nothing but a distraction.
Another thing to consider is the alert threshold, or questions like:
- How soon should an alert be sent?
- What's an acceptable error percentage?
- How low can a server's disk space go before we need to do something about it?
This is not an easy task, and it will probably take some tinkering before you get your set of alerts defined just right. You want to send the error message early enough that you don't miss important errors, but not so soon that you get too many false alerts.
The best way to go about this is through experimentation: changing alert conditions is quick, as it doesn't involve changing configuration files and server restarts, so keep trying out different values until you are happy with the results. Also, as your application evolves, you'll probably want to change your alerts as well, for example loosening alert thresholds when you know a new update will negatively affect your loading times for a while.
Step 2: Select the Product and Target to Monitor
As I explained earlier, every alert condition in New Relic Alerts belongs to an alert policy. So, to add a new alert condition, first navigate to the Alert policies tab and select the policy you just created, "Application".
As you haven't yet created any alert conditions, you'll see the following placeholder in the middle of the page:
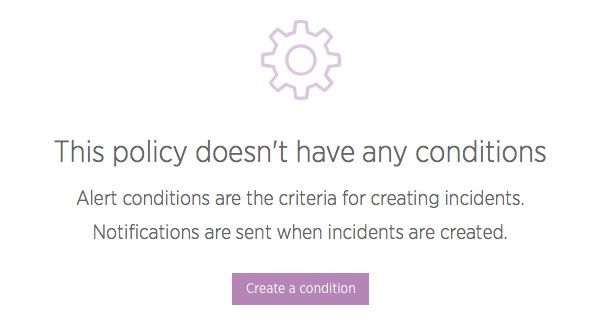
Click on Create a condition to start defining your first alert condition. After you have created this first condition, you'll see a list of alert conditions instead of the big button—at that point, adding a new condition is initiated using a smaller New alert policy button on the top right corner of the list.
Clicking on the button initiates a three-step New condition wizard:
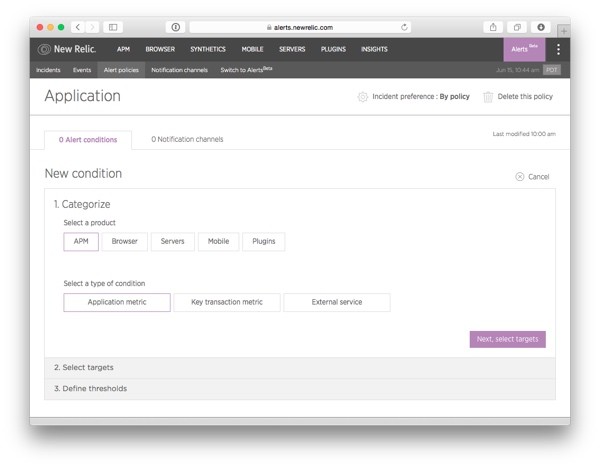
In the wizard, you'll be first asked to select a New Relic product. This is the product that you'll use as the source of metrics for the alert condition you are creating, and that therefore will also define the options available for you in the next two steps in the wizard.
PHP errors are monitored using APM, so let's pick that one.
On the same wizard step, you still have a second choice: selecting the type of condition you want to create. The options in this selection change as you switch between products. For APM you have the following three options:
- Application metric: This option gives you access to the default application metrics measured by APM (Apdex, Error percentage, Response time, and Throughput) as well as any custom metrics you have defined in the monitoring tool.
- Key transaction metric: As a paid feature in APM, you can mark some of the transactions in your application as "key transactions"—transactions that have special importance for your business or your product. If you select this option, you will create the alert condition in the same way as you would using the Application metric option, except that instead of monitoring the entire application (or multiple applications), the alert will only fire if the condition is met within a key transaction you select.
- External service: This option lets you create alert conditions based on API or other calls made to external services.
As error percentage is an application metric and we haven't specified any key transactions, select Application metric and click on Next, select targets to move to the second step in the wizard.
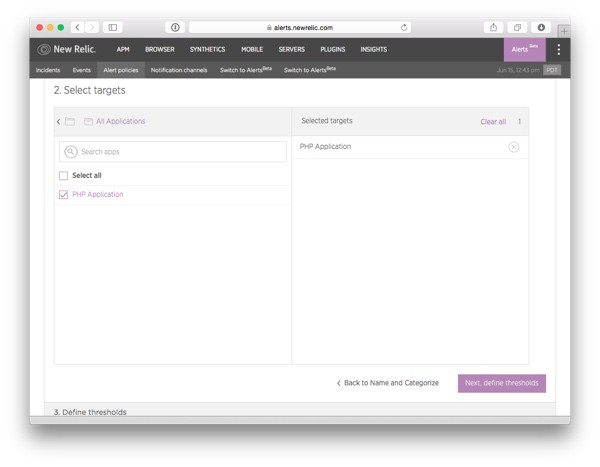
On this second screen, you will select the APM monitored applications that the alert condition should notify you about.
First, click on All Applications to reveal the list of applications.
Then, tick the check box in front of our application (in our example, we only have one application, PHP Application) and move to the final step in the wizard by clicking on the Next, define thresholds button.
Step 3: Define the Alert Condition
The third and final step in the New condition wizard is where you define the actual alert condition.
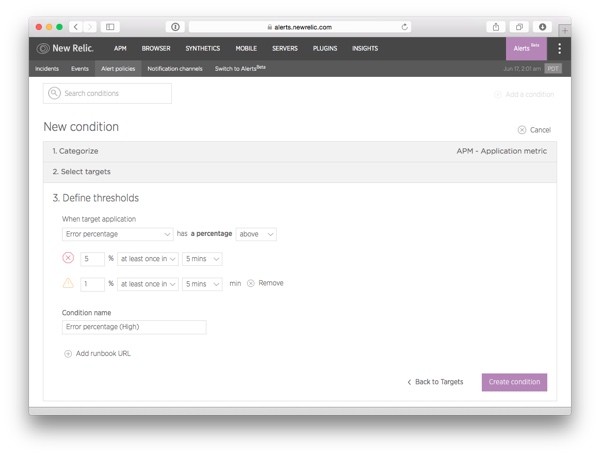
The options you'll see in this step depend on the choices you made in the first two steps. However, in each case, the basic idea is the same: this is the screen on which you'll select a metric and an error (and an optional warning) threshold for it.
To create the high error percentage alert condition I described above:
- Select Error percentage as the application metric to monitor.
- Then, pick a suitable comparison operator. In this case, above makes the most sense (the other options are below and equal to).
- Define the threshold: what's an error percentage that makes sense for an error report? Make this number too high and you'll miss important errors. Make it too low and you'll drown in alerts. 5% is a good starting point, but in real life you may end up tweaking the threshold up or down depending on your application and your preferences.
- Define the time frame: To catch the most errors, choose "at least once in" "5 mins". This will alert you immediately if the error threshold is exceeded even once during the selected time frame. On the other hand, if you want to give your application a bit more slack, you can choose "for at least" and only receive the notification if the error percentage stays high for the entire duration of the selected time frame.
- If you like, you can also define a warning threshold using a lower error percentage. Warnings will not trigger email alerts but you'll see them in the list of events as well as in the APM view (if you have gone all-in and become an early adopter—see discussion earlier in this tutorial).
- Give the condition a descriptive name or—if you are satisfied with it—use the default name suggested by the tool.
- If you want to provide your team with information about the incident and how to fix it, you can add a "runbook URL": a link to an outside web page, for example a documentation page that explains what this alert means and describes the steps to solve it. To do this, click on Add runbook URL and enter the URL in the text field.
When you're happy with the alert condition, click Create condition to save it. Remember that you can always come back to tweak it later.
Now, the Alert conditions page will look like this, with your new alert added to it:
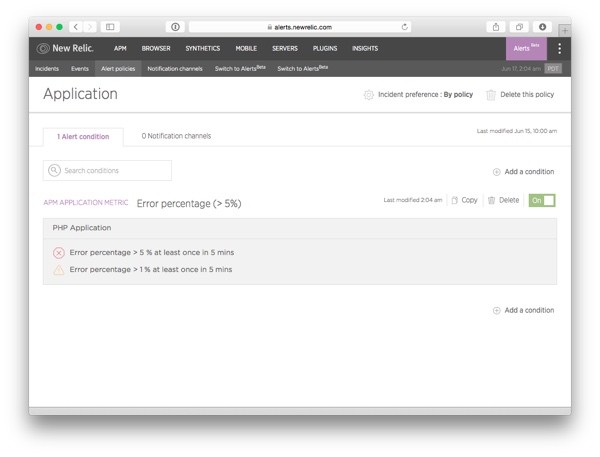
If at any time, you want to modify the alert condition, just click on its rules. Notice also the Copy and Delete buttons on the top right corner of your new alert condition: these come in handy if at some point you want to move the alert to a different alert policy.
Step 4: Set Up Email Notifications for the Alert Policy
You have now created the first alert. But an alert without a notification channel isn't very useful: the violations will be added to the incidents tab, but no one gets notified. To make the alert policy notify you about an incident, we'll need to define a notification channel and link it to this alert policy.
Let's start with the most common one, email.
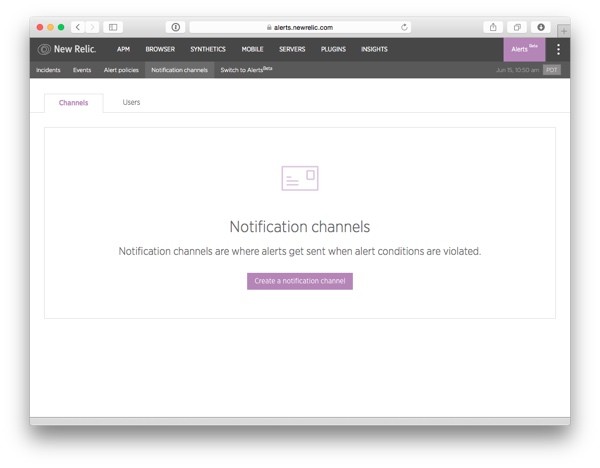
To start creating your first notification channel, click on the Notification channels menu item. Then, click on the big button that says Create a notification channel.
On the next screen, you'll first see a text box that says "Select a channel type". Click on it to reveal a drop-down list with the available notification options:
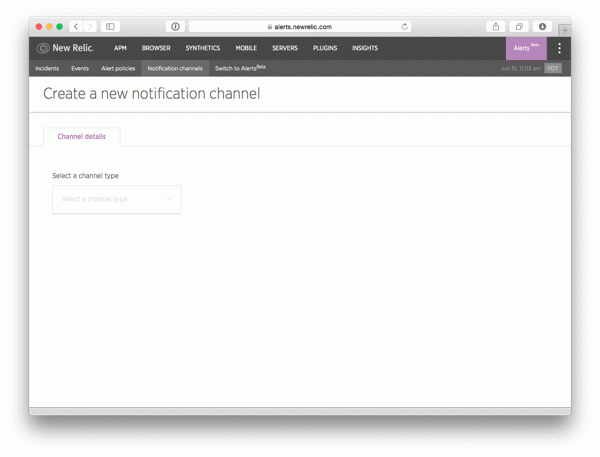
The options available at the moment (according to the documentation, more channels will be added in the future) are:
- E-mail: Sends an email message to the email address specified in the configuration.
- HipChat: Sends a message to the HipChat room specified in the configuration.
- PagerDuty: Sends a notification through the NetOps administration tool PagerDuty. This is an advanced option for the more critical notifications that need to addressed immediately—the alerts can even be configured to call you on the phone!
- VictorOps: Similar to PagerDuty, this option sends a notification through the NetOps tool VictorOps. The functionality in the two tools is quite similar, so the choice depends mostly on what you're already using.
- Webhook: Sends a notification to a URL you define. Use this option if you want to send notifications to a channel that isn't currently supported directly by New Relic Alerts—or if you want to create your own custom solution...
- Campfire: Sends a notification to the Campfire chat room specified in the configuration.
- Slack: Sends a notification to the Slack channel specified in the configuration.
- OpsGenie: Sends a notification using the OpsGenie NetOps alert system. OpsGenie is another tool similar to PagerDuty and VictorOps that can be used to make sure your team notices the alerts as they arise.
In addition to these, New Relic Alerts automatically creates a Users notification channel for every user in your account. This channel can be used to send email and to push notifications to New Relic's iPhone and Android application.
In a real-world situation, you should pick tools that are the best fit with your Alert policy and your team's communication culture: for example, using OpsGenie for the urgent alerts and email for the not so urgent ones. In this tutorial, we'll just add two as an example, starting with email.
When you click on the E-mail option, the rest of the form is automatically updated to show the email notification configuration:
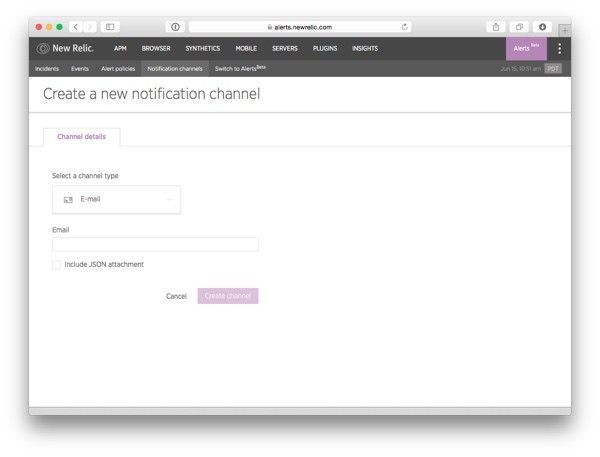
Enter your email address in the Email field and click on Create channel. If you want to send some more data about the incident along with the email message (for example if the email is read programmatically), check the Include JSON attachment check box.
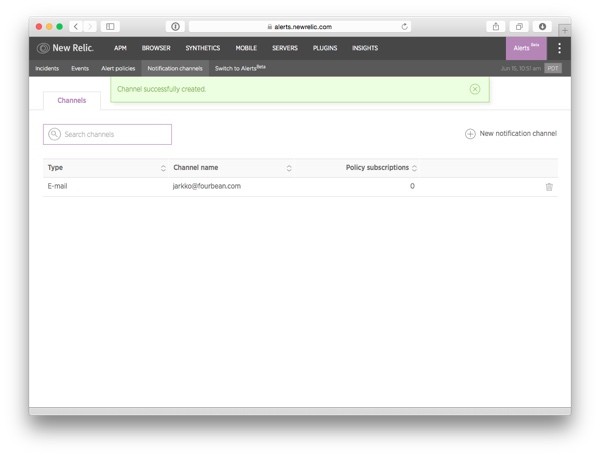
And that's it, an email notification channel has now been created:
To attach this notification channel to the alert policy you created earlier, return to the Alert policies page and select the "Application" alert policy.
Then, click to view the Notification channels tab. As there are no notification channels defined for this alert policy yet, the tab will look like this:
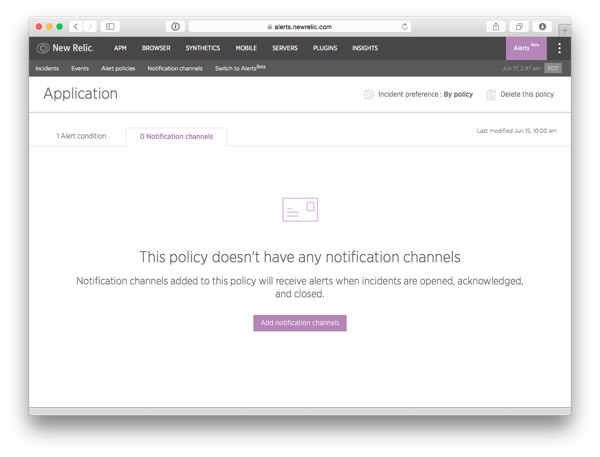
Click on Add notification channels to open a pop-up window for selecting the notification channels to be used in this alert policy.
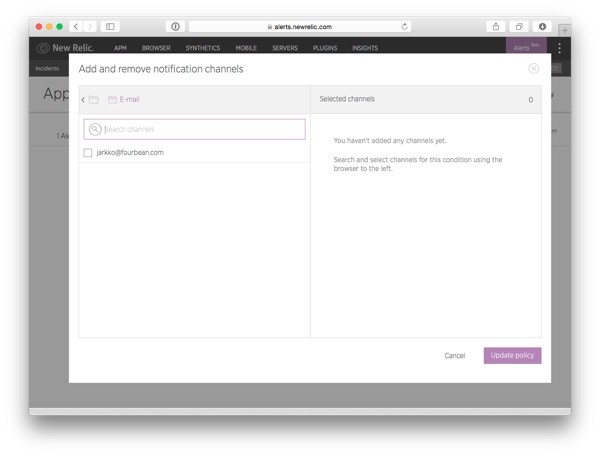
Use the notification channel browser to locate the E-mail channels and check the checkbox in front of your email address.
Then click Update policy to save the changes.
Step 5: Set Up Slack Notifications for the Alert Policy
Next, let's make the notifications appear on a Slack channel. If you don't use Slack, you can skip this step and move on to the next step, in which we'll start testing the alert.
First, in your Slack chat window, click on the down arrow next to your user name to open the menu. Then, select the option Configure Integrations:
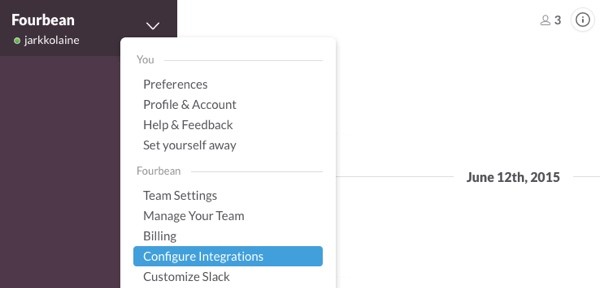
This will open a new browser tab showing Slack's Integrations page.
Use the search bar on the top right corner of the list of services to look up the New Relic integration type.
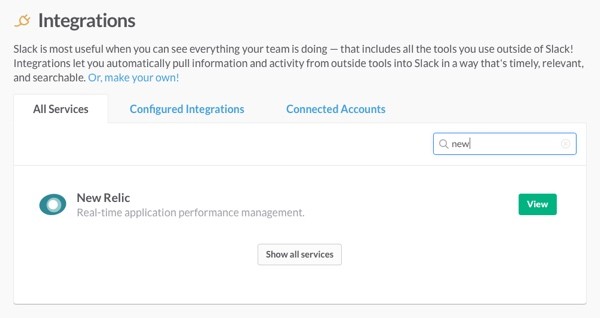
Scroll down to the Incoming WebHooks option and click Add.
Click on View. Then, on the next page, choose or create a channel you want to post the notifications to. This can be an existing, project specific channel—or maybe you'd like to create a specific channel for server alerts.
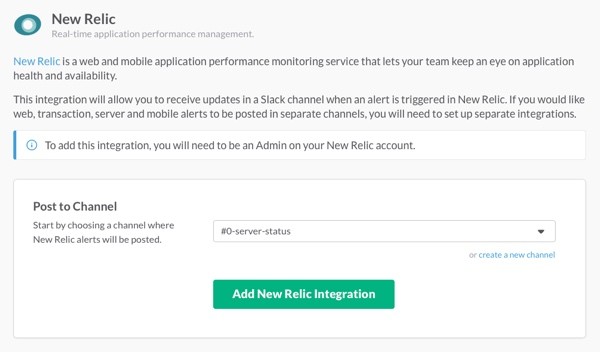
After selecting a channel, continue by clicking "Add New Relic Integration".
On the next page, expand the instructions for the first item on the list, "New Relic Alerts [Beta]". Then, copy the Webhook URL shown in the section labeled Step 2. This is a unique, generated URL and should only be used for this one integration. If you have any reason to suspect that the URL has leaked to someone who shouldn't have it, you can (and should) generate a new one.

Return to the New Relic Alerts Notification channels page and create a new notification channel selecting Slack as the Channel type. In this new channel's options, insert the URL you just copied into the text field labeled URL:
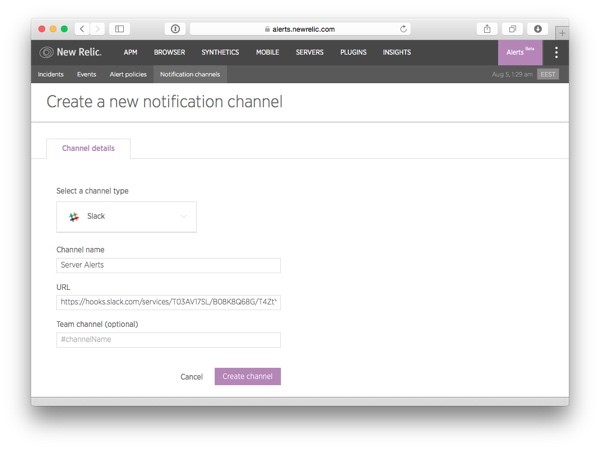
If you like, you can use the Team channel field to define the name of the Slack channel you want the notifications to be posted to. If you do this, make sure you remember to include the hash sign in front of the name—otherwise, instead of receiving an alert on your Slack channel, you'll just see an error in the Events log.
Click on Create channel to save the definition. Then, follow the steps of linking the new notification channel to your alert policy that we used when linking the email.
Step 6: Test the Alert by Making Your Code Fail
Before I leave you to work on your real-world alerts and setting up your production server, let's put our new alert to the test and see what happens when an alert condition is violated.
As we created a test server specifically for this tutorial's needs, we can safely break the code. If you are testing the alerts on an existing server of yours, you probably only want to do this in a testing or staging environment.
To create a PHP error in the server setup we created earlier, first use SSH to connect to your server. Then, jump to your web server's root directory:
cd /var/www/html
In this directory, create a PHP file, for example error.php, and write some faulty code to make the script break when you try to load it in your browser:
<?php
// Just some code that will fail
syntax_error.

echo "Hello, world";
Now, open the URL in your web browser, and refresh it a few times during the five minute time frame we defined for the alert condition. (You'll find your server's URL in the Amazon EC2 dashboard.)
After about five minutes, you should receive a notification both in your email inbox and the Slack channel you defined above.
Here's how the error will look in your email:
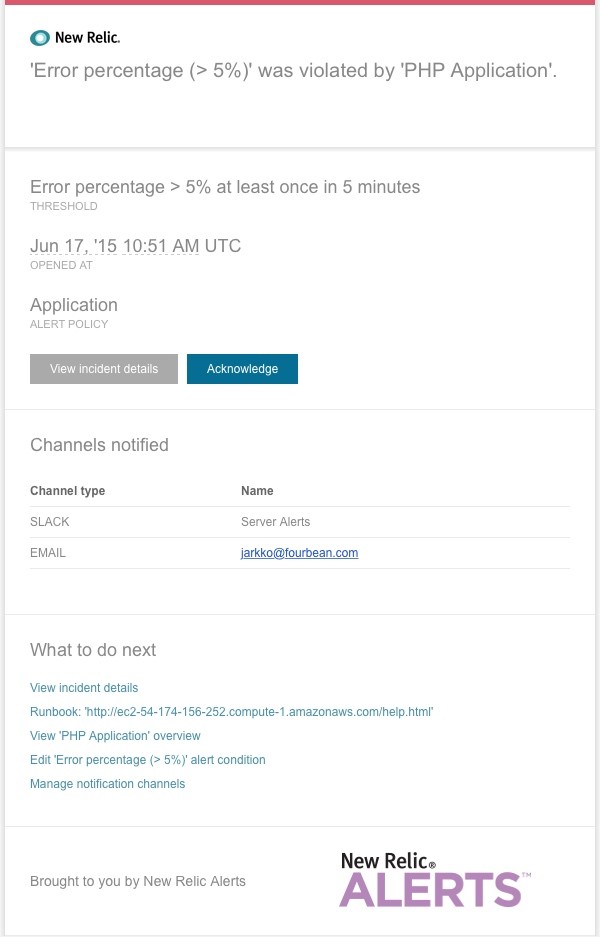
And the same notification in Slack:

When you click on the View incident details link in the email or the incident number in Slack, you will be redirected to the corresponding New Relic Alerts page with a lot more information about the issue that caused the notification:
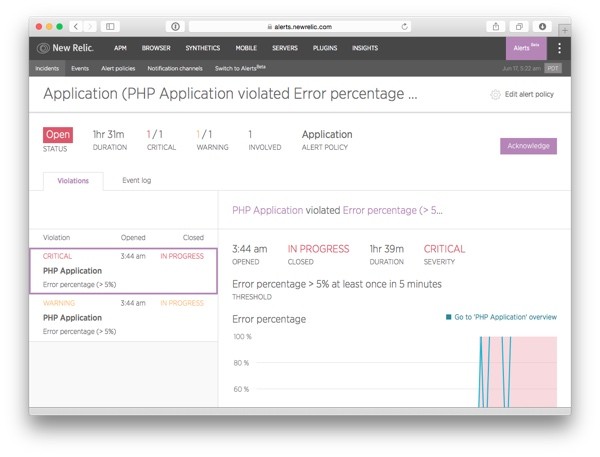
If you are ready to start working on the alert, click on the Acknowledge button on the right. After you have clicked on the button, it is replaced by the following piece of state information:

You (and your team, as configured in the notification channels) will also receive a notification about the acknowledgement via email and Slack. This acknowledgement means that you take ownership in fixing the issue, and the status cannot be changed: once you have acknowledged an alert, no one else can acknowledge it again.
When you scroll down to the bottom of the alert page, you'll see the following buttons that you can use to get more information about solving the issue (Open runbook), Edit alert condition (if you believe this is a false alert) or Manually close violation (once you have fixed the issue).

For a lot more information about the issue, you can also visit APM's Errors page:
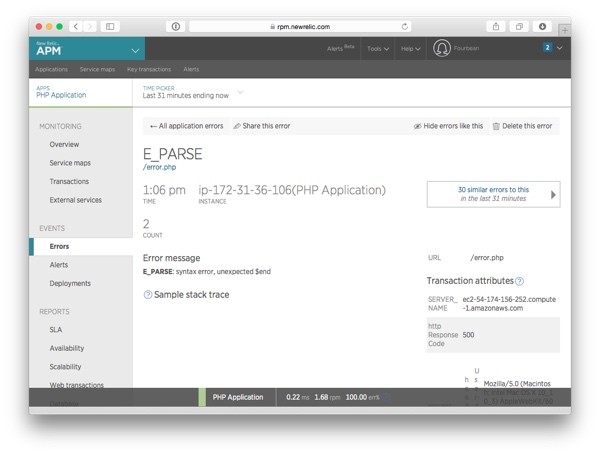
Use the information from APM to fix the problem (this time, it's easy).
Then load the page a few times again and wait for another notification telling you that the issue is no longer active, or go back to the Incidents page and click on Manually close violation to close the alert immediately.
As New Relic Alerts is driven by data, if no more data comes from your server after the alert was sent, the incident stays open forever. So, if you are wondering about why your alert is not getting closed automatically even after you fixed the bug on this test server, it's because no one is using the site—and therefore there's nothing to be worried about.
You have now successfully created your first alert condition and used it to fix a bug in your server, and you are ready to start creating your real-world alert policies to keep your web application safe.
Other Metrics for Your Alerts
While the error notification we just created is a highly useful one, it's still only one of many alerts you can create using New Relic Alerts.
To help you as you proceed with developing your own set alerts for a real web application, here are the rest of the options applicable to web applications, along with some ideas for issues in your application you might want to monitor using them.
1. Alert Conditions Based on APM Metrics
APM (short for Application Performance Monitoring) is New Relic's flagship product: an application monitoring tool that goes down to the code level, measuring things like errors and how long your application takes at various points in execution.
In addition to the high error percentage alert condition we created above, the following APM metrics can be used for creating alerts.
- Apdex: Apdex (Application Performance Index) is a standard method defined for measuring and comparing the performance of software applications. The metric measures end user satisfaction and goes from 0 to 1, where 1 means that every user is satisfied and 0 means that no one is. A good number to start from is 0.7, which is the default alert threshold in the legacy New Relic alerts.
- Response Time and Throughput: Response time tells you how long requests made to your application take on average. Throughput is a related metric that describes how many requests were successfully processed by your service during a given time frame. While both metrics are incorporated in the Apdex calculation, adding alerts for them will make your alerts more specific and thus easier to analyze and direct to the right people.
- Custom Metric: If you are recording your own custom metrics in APM, you can use them to create your own application-specific alert conditions.
- External Service: Using the external service condition type, you can create alerts based on the response time and throughput from an HTTP call to an external service. For example, on my own site, monitoring the external service requests helped me identify an API call to Tumblr as a major reason for slow loading times.
If you select Key transaction metrics (paid feature in APM) as your Type of condition, you'll have access to all the same metrics described in the list above, but they'll be used for tracking just the selected transactions and not the entire application.
This way, you can have alerts about errors in important transactions (such as payment processing) sent with higher priority (SMS instead of email, for example) than errors in less critical transactions.
2. Alerts Based on Browser Metrics
Browser is a New Relic monitoring product designed to give you a view of how real users experience your web application: monitoring for the things that happen inside the browser. For a more detailed explanation of the tool and instructions on enabling it on your New Relic account, check out this tutorial.
Whereas APM-based alerts notify you about things that go wrong inside the application server, Browser alerts can be important in pinpointing errors that cause the user experience to break.
- End User Apdex: The key metric in Browser based alerts, End User Apdex measures the percentage of users who are satisfied by the application's performance, taking into account also the performance of the application as it runs in the browser.
- Page Load Time: A group of metrics for measuring the time spent at different parts of page loading: total page load time, page rendering, web application, network, DOM processing, and request queueing can all be used to get more detailed alerts about specific bottlenecks in the end user experience.
- Page Views with JavaScript Errors: The number of JavaScript errors in your application can be a sign of bad programming that should be addressed quickly. Using this metric, you can create an alert similar to the error percentage alert we created in this tutorial—only this time, measuring JavaScript errors instead of errors in the application PHP code.
- AJAX Response Time and Throughput: If your application uses AJAX calls for important end-user-facing actions, it's important to find problems in them early on. For this, you can use the metrics measuring how long AJAX requests take to process and how many AJAX requests are successfully served in a given time frame.
- Custom Metric: Just like in APM alerts, you can also use custom metrics in your Browser alerts.
3. Alerts Based on the Servers Metrics
Servers is New Relic's product for measuring what happens physically on your server. Instead of looking at the application metrics as we did with APM and Browser, now we're talking about things like disk space usage and CPU load—the kinds of metrics you want your NetOps team (or just you, if you're a small operation) to always stay on top of. See this tutorial for more information about New Relic Servers.
These metrics are all important sources for—usually urgent—alerts:
- CPU %: If your application uses a lot of the CPU resources, it could be a sign that you need to either optimize the application or move it to a more powerful server. In both cases, it's good to know when you reach the limits of what the machine can handle.
- Disk IO%: In New Relic Servers, the disk IO% metric tells you how much of the time your disks are in use, 0% meaning no disk operations at all and 100% that the disk is in use all the time.
- Memory %: Especially when working on a data-heavy application, memory is one of the first resources you'll need to worry about. Make sure you get a notification early enough, before the machine runs out of free memory.
- Fullest Disk %: When your server runs out of hard drive space, you can be sure your application will not perform as it should. Again, it's better to handle a disk space issue before it affects your users: around 90% full or so.
- Load Average: Load average tells you how well the server's CPU is coping with the work it is charged with. A value of 0 means a totally idle computer, and every running or waiting process adds to the number. The alert threshold depends on how many cores your server has: on a single-core system, a load average of 1 means that the CPU is used at full capacity (with two cores, the number is 2, and so on). Higher values mean that there are some processes waiting in line.
What's Next?
We have now looked at how alerts can help you monitor your web application and give you peace of mind, discussed the basics of designing good alerts, and gone through the steps of using New Relic Alerts to set up alerts for your web application.
If you like to tinker, Alerts gives you a wide range possibilities to tweak and fine tune your alerts until they are just right: add some custom metrics to your code, use data from New Relic plugins, and send alerts to all kinds of different notification channels—or if you are a mobile developer, take a look at mobile alerts. We have only scratched the surface.
Alerts is currently in beta, which means that new features are still being implemented as we speak. So, to stay updated on the new developments, keep an eye on the New Relic Alerts documentation and join the discussion on the tool's discussion forums.
But first, go ahead and create some alerts!


Comments