
This tutorial continues where we left off in Using New Relic to Monitor WordPress Performance. Here, I'll give you a conceptual overview of WordPress performance and guide you through using New Relic to examine your own site's performance.
If you arrived here from the Optimizing WordPress with Varnish and W3 Total Cache tutorial, you already have a pretty well optimized WordPress foundation. If not, you may want to go back and review that article.
Using New Relic With WordPress
WordPress is a powerful open source blogging system which can support both small individual blogs and larger sites for major media organizations. But actually running WordPress well, and scaling it successfully and affordably, requires a great deal of sophistication.
New Relic's performance monitoring services provide an excellent way to ensure your WordPress configuration keeps running smoothly and efficiently.
Note: New Relic cautions that its services are best used to optimize WordPress on dedicated servers, not virtual or shared servers, such as those offered by many cloud-based providers. If you're running WordPress on a shared host, New Relic may not be as useful for you as for sites running on dedicated servers.
If you'd like to learn more about New Relic before diving in to this performance guide, Tuts+ has a wide variety of articles on their services.
What Makes WordPress Fast or Slow?
In 2013, Frederick Townes, the creator of the free W3 Total Cache WordPress plugin, wrote a blog post for New Relic describing the aspects of performance we need to consider: WordPress Performance Optimization with New Relic. It's an excellent summary which I'll review.
Townes highlights the core areas that we need to focus on:
1. Disk Performance. A non-shared local disk will always give the most consistent and reliable performance. For example, using a host which offers SSD drives or high speed hard drives is ideal.
2. The MySQL Query Cache. The query cache preserves the results for common database queries and can return the results immediately without having to perform them repeatedly. Townes recommends running MySQLTuner to assist with optimally tuning your database configuration.
3. Use of Queries by Your WordPress Themes and Plugins. Out of the box, WordPress is configured to run well, but as we add third-party plugins and themes, we can run into a variety of bad code which can lead to performance issues.
4. File Size of Your WordPress Themes and Plugins. Reducing the file size and number of files (and therefore HTTP transactions) has a dramatic impact on users' experience with your site. Unfortunately, not all Cascading Style Sheets (CSS) or JavaScript (JS) can be easily consolidated and minimized.
5. Optimizing PHP, which is relatively slow. Faster versions of PHP such as HHVM may be suitable for WordPress in the future, but I've read that it's not yet stable for this task. In the meantime, Townes offers a list of suggestions: reduce the memory footprint of your scripts, use autoload, use memorization, avoid loops, reduce execution time, minimize the number of files opened to reduce calls to disk and memory usage, and use include and require rather than include_once and require_once.
6. Using Opcode Caching such as APC, an open source caching framework for PHP code. Says Townes: "APC keeps the interpreted (executable) version of your code in memory so that requests for it do not have to be re-interpreted."
"WordPress’ object cache is where a lot of magic happens. There are various groups of objects that are generated by WordPress when it processes page requests. These groups serve numerous purposes, and depending on how you use WordPress, a very significant performance increase is realized by persistently storing the objects using memcached or APC backend stores for example."
Townes' W3 Total Cache implements this at the page caching level, allowing for scenarios where portions of a given page can still be generated by PHP while larger portions of the page that are unchanged are cached and not regenerated.
"W3TC will allow you to choose a data store other than MySQL like memcached, which is designed for high-speed access from multiple application servers. So rather than every page request that already needs to fetch respective information about the visitor or other dynamic elements, MySQL is now able to focus (and be tuned for) only the dynamic parts of your templates."
Says Townes, "Fragment caching will reduce your execution time by orders of magnitude."
7. Using Page Caching. The most beneficial technique for scaling a typical website is the caching of pages. Rather than hitting your entire stack with every page request—WordPress, Theme, Plugins, HTML, and MySQL—we just retrieve static HTML from the web cache, often from memory. Traffic scaling on an uncached WordPress site can take it down in seconds, whereas traffic scaling on pre-written HTML files from an in-memory cache is massively scalable.
Says Townes: "Reverse proxies often provide caching that sits between the web application and the public Internet. Its goal is to lighten the load on the web servers behind them. Reverse proxies are optimized for returning content generated by the underlying application. Varnish, Nginx or even Apache can be configured to provide reverse proxy functionality."
I most frequently use Varnish with Apache and W3 Total Cache in combination to scale WordPress. If you're interested in these configurations, check out: Optimizing WordPress with Varnish and W3 Total Cache (Tuts+).
8. Content Delivery Networks (CDNs) are cloud-based caching services for frequently used files and media. Townes says: "With a CDN, it doesn’t matter where your site is hosted. If you have visitors in other parts of the world, the CDN caches that content close to them and shaves seconds in aggregate off of the total page load time for your site."
Now that we know some of the key concepts of what goes into making WordPress run well, let's look at how New Relic can help us.
Using New Relic to Monitor WordPress
New Relic is a performance monitoring service which runs with a variety of server and language technologies, including PHP, making it great for optimizing WordPress.
New Relic provides performance monitoring of the full stack—what end users experience—but also provides detailed server monitoring. Says Townes, "New Relic makes it trivial to disseminate the goings on in your environment."
When you run New Relic on your server, you can get detailed performance monitoring graphs and statistics about your server and PHP, including: response time, Apdex score (the ratio of satisfactory response times to unsatisfactory response times), throughput (requests per minute), web transactions e.g. third-party API requests, error rate, recent events, and server information.

Going further, New Relic Browser monitors full-page lifecycle data—well beyond the initial page load. For each end user page load, New Relic Browser captures:
- time spent in the front end (browser)
- code and events executed in the browser (JavaScript, Ajax, and end-user interactions)
- time spent in the back end (network and web app)
- geographic origin
- browser type and version, and operating system
You can view the data globally across all users and see it sliced and diced by webpage, browser, user session, and location.
I covered New Relic Browser more fully in Front End Monitoring with New Relic Browser (Tuts+).
New Relic Synthetics allows you to set up regular tests of your site from around the world to notify you immediately of problems when they arise. I'll be covering Synthetics in an upcoming tutorial, so visit my Tuts+ instructor page to see when it releases.
Using New Relic With W3 Total Cache

I explained the signup and installation process for the W3 Total Cache New Relic service integration in this tutorial: Using New Relic to Monitor WordPress Performance (Tuts+).
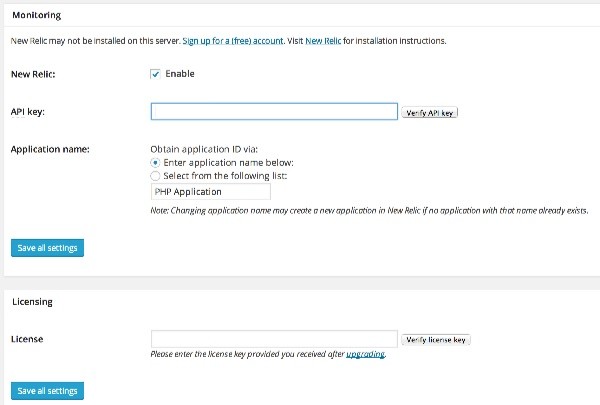
From your WordPress Administration Console, click Performance > Monitoring. Click to sign up for a free account. Copy the details for your API and license key into the W3 Total Cache settings panel below:
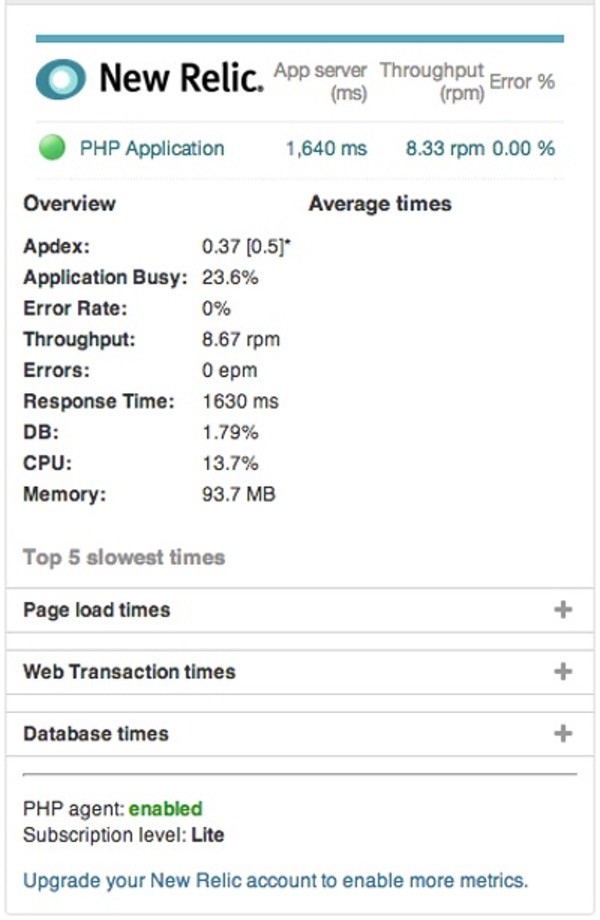
Enabling New Relic on your server provides for monitoring from the W3TC dashboard, as shown below:
For more detail, you can visit the New Relic website and log in to your account.
Monitoring Your WordPress Performance
Assessing Server Performance
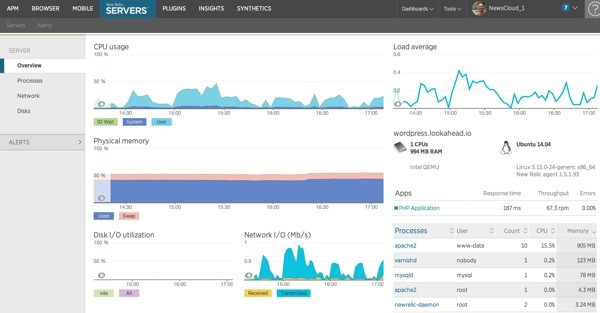
At a high level, the New Relic Server monitoring gives you an overview of CPU usage, memory usage, and disk and network I/O, as well as information about your hardware and most active processes. This can give you a birds-eye view of what's happening with your configuration and alert you to any significant problems:
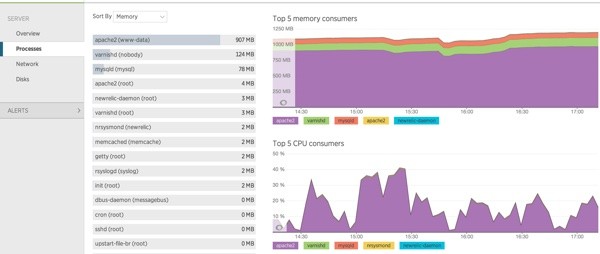
The Process tab shows you the memory and CPU utilization of each process:
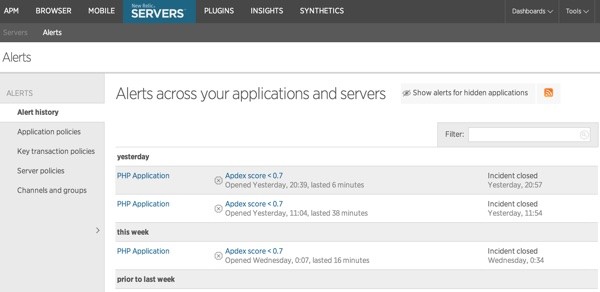
You can also see a history of alerts, indicating red flags with your site's performance:
Evaluating WordPress Performance
New Relic is useful for evaluating WordPress performance in three key ways:
1. Apdex. New Relic uses Apdex scoring to help you evaluate how well your Wordpress application is performing for your end users, according to an industry-standard measurement. This helps you provide better data for troubleshooting, and gain a clearer understanding of what percentage of your users are frustrated or satisfied. Apdex scoring also provides more specific context than a general “the site is slow” complaint that may not even get to you until hours after the incident. Apdex also gives you a more objective way to measure how well your performance improvements are being felt by your actual users.
2. MySQL Performance. Wordpress plugins and themes may be abusing your mySQL database. You can pinpoint which ones are causing problems by looking at the slow SQL in New Relic. For example, you may see that selects on wp_terms, which are used for categories and tags, may be eating up 20% of your total database time. Or, you might notice slow INSERT statements that may be improved with a well-placed index or a refined query.
3. Monitoring the Performance of Third Party Plugins and APIs. Using social media plugins, monitoring plugins, and other cool widgets is very easy in WordPress, but it may not be immediately obvious how those third-party dependencies are affecting your blog or marketing site. New Relic enables you to see external service calls “rolled up” for a more holistic view, and you can also monitor the response times from those third parties in each of the web transactions New Relic captures.
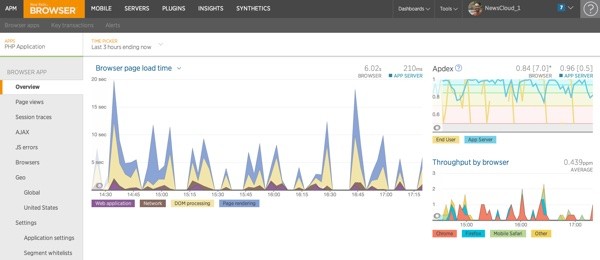
We can use New Relic's Browser to study WordPress performance in more detail. You want to especially look for code from our Themes and Plugins that may be negatively affecting performance.
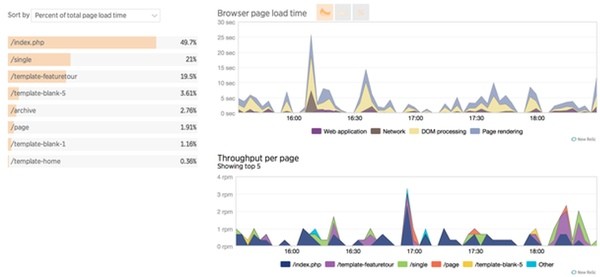
The dashboard gives you an overview of page load time broken down by Apdex and throughput:
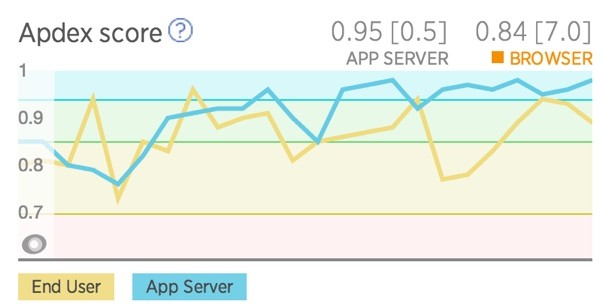
Here's a zoomed in view of my Apdex score over the past 24 hours:
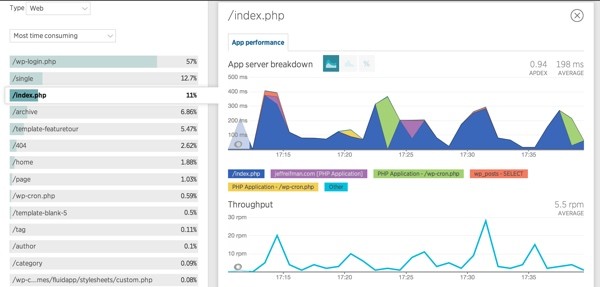
You can also view performance by page view:
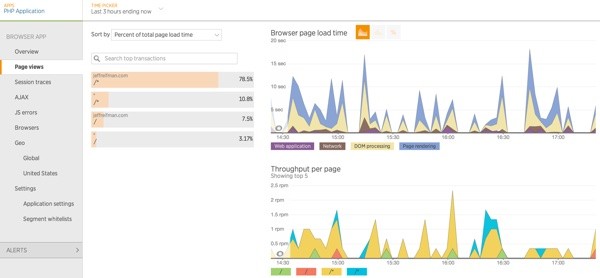
When you drill down, you can see performance of the individual files being loaded by your site. You'll want to look for any theme or plugin files that are taking a suspicious amount of time:
MySQL Analysis
New Relic server monitoring can also track the performance of your MySQL queries:
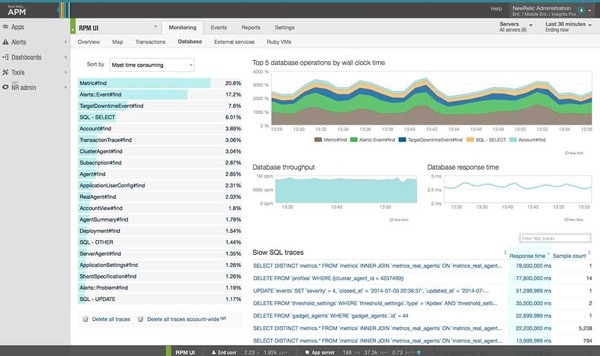
You can drill down for additional detail:
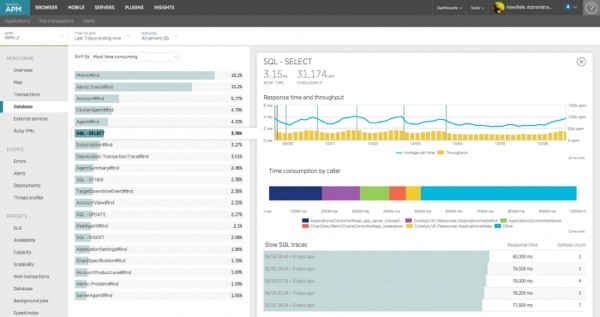
And diagnose the slowest queries:
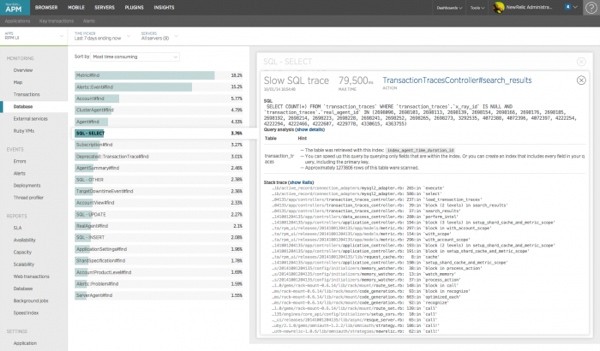
This can be especially useful to identify slow queries created by bad plugin code.
Session Traces
Session traces give you visibility into the entire lifecycle of a web page, including user interactions, asset loading, iframes, time spent waiting for Ajax calls, errors, and more—tracking the real experience of a real user from start to finish.
Not only do traces identify problems, but they can also show you what the user did before and after the error occurred.
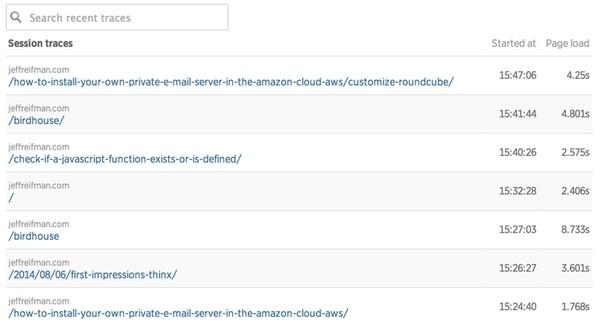
Here's a detailed drill down into your sessions. This can help with assessing the performance of code within themes as well as plugins:
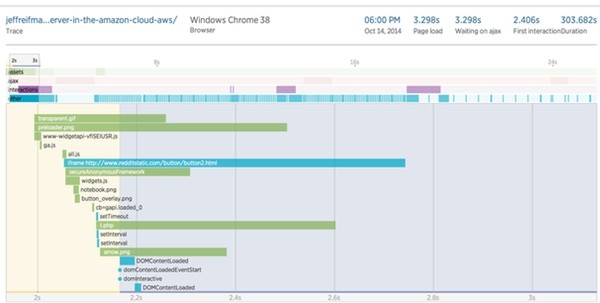
Session traces help you understand:
- how users experience your page load, including time to DOM load, time waiting for Ajax requests to complete, and the user's interactions with the page
- the sequence of JavaScript and browser events, which take longer than others, and when each event occurs
- where bottlenecks occur, and what may be causing them
- why one page load may be slower than others, by providing the context for individual events during a session
You can see exactly what was occurring in a particular user's browser at any particular moment. Session traces give you detailed and intuitive visualization of all events in the user's session and can help pinpoint problem areas and easily identify solutions. Read more about using session traces.
Ajax and JavaScript
The Ajax page allows you to see what's happening with any interactive calls that you have on the page, helping identify problems with your users' experience when you have time-consuming or failing calls:
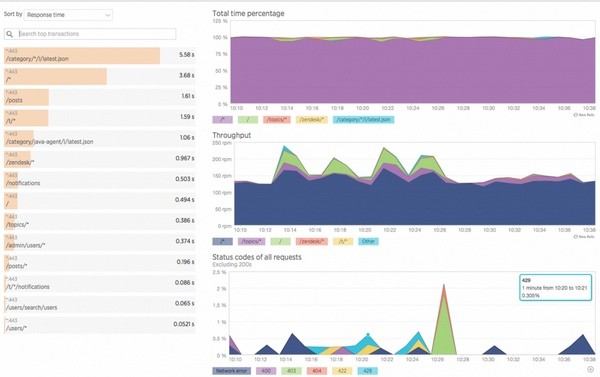
Note that New Relic Browser does not automatically record Ajax data. You need to turn it on per app in the New Relic settings area. Read more about the Ajax dashboard.
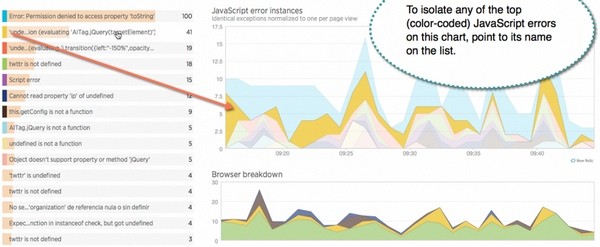
The Browser JavaScript errors dashboard lets you quickly see what errors are happening in your live production JavaScript over time, on which browsers. You can investigate errors based on the number of times each one occurred and the number of unique page loads that encountered that error.
This allows you to identify the errors that are impacting real users' experiences on your site; it's an especially powerful way to learn of JavaScript errors that aren't appearing in your own testing—or on browsers that you might have excluded from your testbed.
Looking Ahead
Self-hosting WordPress requires a high degree of technical skill. If you're not up for it, managed hosts are a better alternative. Many of these use New Relic internally to optimize their own sites, e.g. Page.ly.
Diving deeper into New Relic requires an investment of time, but the results are well worth it. With this tool, you can see inside your WordPress stack to quickly pick out problem areas that need addressing.
If you do self-host, New Relic's services can be incredibly powerful ways to see into your own hosting environment and your WordPress stack, themes and plugins—and tame the performance beast.
In your rollout process (and your development process if you're building your own themes and plugins), you'll definitely want to drill down into your site with New Relic.
While you can use New Relic Lite forever, once your two week trial expires, you'll likely want to upgrade to the Pro plan ($149/month) to keep the same levels of service. New Relic Browser, Synthetics and Insight have their own pricing structures—learn more at the New Relic website.
If you have any questions or corrections, please post them in the comments. If you'd like to keep up on my future Tuts+ tutorials and other series, please visit my instructor page or follow @reifman.


Comments