In 2013, I posted a few tutorials on DevTools: Markup and Style, Networking and the Console and JavaScript and Performance, covering the basic features of the various DevTools panels. Since then, a lot has changed, so let's take a look.
Tl;dr
DevTools has grown quite a bit since it was last covered on Tuts+, here are some of the features you'll want to be aware of:
Screencasting: view and interact with web pages on your Android device via DevTools on the desktop.
Workspaces: use the Sources panel as a code editor. Edit code in your project and have that persist to disk.
Source Map debugging: writing LESS/Sass or even CoffeeScript? Output Source Maps during compilation to have DevTools understand the mapping.
*Flame Chart: *view an interactive visualization of JavaScript processing over time.
Mobile Emulation: emulate certain device characteristics (for example, screen dimensions, user agents) and apply them to your page to see how it responds.
Canvas debugging: step through the commands HTML5 canvas receives and see how the canvas changes with each instruction.
What's New?
A lot has gone into the DevTools to improve development and debugging workflows. From source map debugging to remote debugging, there's hopefully at least one thing in this post you'll be able to take away and begin using. If you'd like to try some of these features, go ahead and give Chrome Canary a try.
Screencasting
What Does It Do?
With Screencasting, you gain the ability to interact with a web page opened in Chrome for Android, from your desktop machine. Clicks, swipes, scrolling and more is all made possible using a mouse.
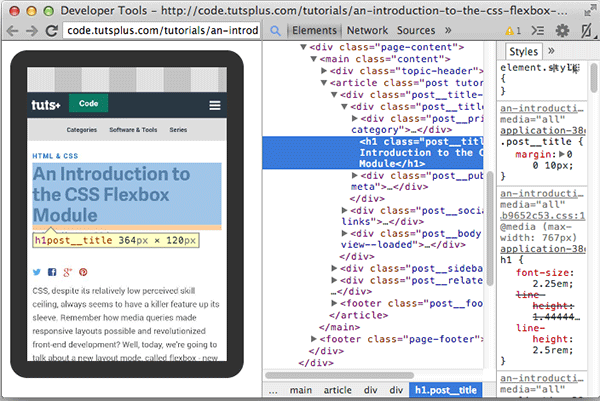
Open the Inspect Devices page by clicking the hotdog icon in Chrome (top right corner) and going to Tools > Inspect Devices (Alternatively, enter chrome://inspect/#devices in the address bar). Make sure you can see your device in the list. Your device will need to have USB debugging enabled if not already. Once your device has shown up, enter a URL you wish to remotely debug in the "Open tab with url" input box and select open. At this point, you should see this page loading up in Chrome for Android. Hit ‘Inspect' back on the chrome://inspect page and notice a small Screen icon in the top right corner of the DevTools. Clicking this enables Screencasting.
The screencast you see within DevTools is updated in real-time. If you scroll the page (via DevTools or on the device) its counterpart will also scroll. Notice in the screenshot below, that the Inspect Element feature behaves just as you would expect, in that features such as typing and gestures enable you to move significant parts of your device testing workflow over to the DevTools.
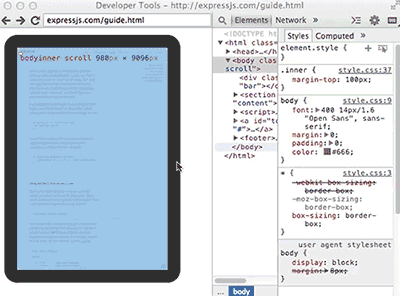
Check out the official documentation on Screencasting your device's screen.
Workspaces
What Does It Do?
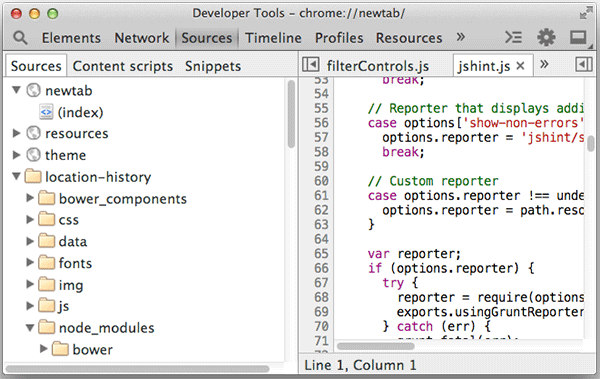
The general idea is, you have the Sources panel display the contents of your project source files as they exist on your file system. Each file is editable with save-to-disk abilities. Edit not only the files like a text editor but synchronize changes to them whether you edit styles in the Elements panel, externally in another editor, or in the DevTools.
To prepare Workspaces:
You first add a folder to your workspace. Right-click in the Sources pane and select ‘Add folder to Workspace'.
Grant file system permissions as requested by Chrome.
After you've granted file system permissions, you can go ahead and edit your code within DevTools and save it just like you would in a code editor. The real benefit comes from editing code which is shared by the web page you're viewing. If you're serving up a page at http://localhost:3000/ go ahead and add the corresponding project as a Workspace folder in DevTools. At this point, you'll want to teach DevTools about the mapping between the Network resource and its corresponding file system resource.
Right-click on a file within a network resourced folder in the Sources panel (make sure it has an obvious mapping to a file on your file system).
Select Map to File System Resource..
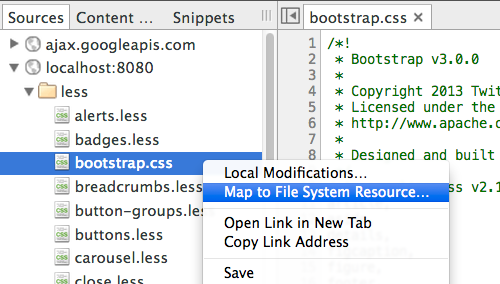
Once DevTools has been instructed of the mapping, your project source files will display instead of the network resource files.
A few small but useful features worth noting are:
Most files come with syntax highlighting.
Use Cmd+P to quickly open a file, if you see undesirable results (like files within
node_modules), right click on the containing folder and select ‘Exclude Folder'.Create new files from the Context menu > ‘New File'.
If you update a file elsewhere, DevTools will attempt to automatically reload from it whenever it regains focus.
See the DevTools documentation for Workspaces over at Google for more information.
Source Map Debugging
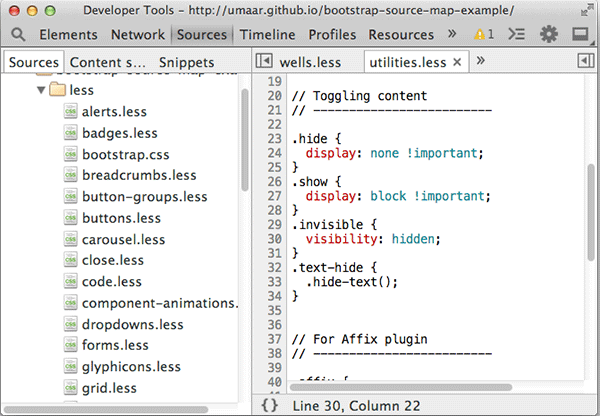
For LESS, Sass, CoffeeScript and a few other tools, their compilation process can produce source map files. DevTools is able to interpret such files and provide to you live-edit abilities. This means you can edit your source files (.less, .scss, .coffee) within the Sources panel. If you have a watch task on your preprocessed files which re-compiles a new CSS/JS file upon change, DevTools will automatically reload from that file on change and update the web page accordingly.
To understand more on these workflows, we have covered DevTools plus source map debugging in the past:
Developing With Sass and Chrome DevTools (June 2013)
Working With LESS and the Chrome DevTools (Jan 2014)
Flame Charts
What Does It Do?
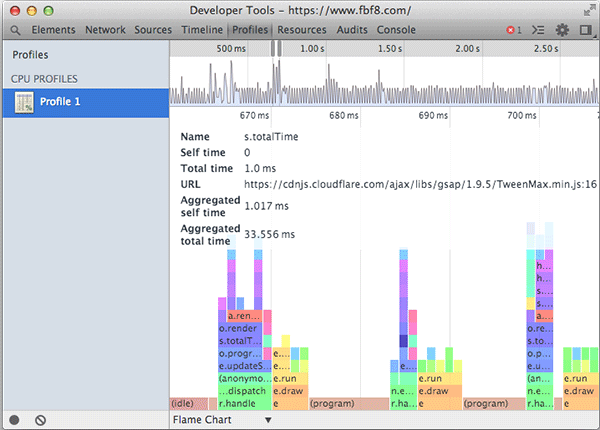
The Flame Chart gives you a visual overview of the JavaScript activity over a certain time.
To create and view a flame chart visualization, collect a JavaScript CPU profile from the Profiles tab and chose the "Chart" view on the Profile result. Spikes in the graph can be zoomed into by dragging and selecting a portion of interest. You can select a range which will result in the flame chart being updated accordingly, then, drag the flames horizontally or vertically to pan around.
Understanding the Flame Chart
The height of all bars in a particular column is not significant, it simply represents each function call which occurred. What is important however is the width of a bar, as the length is related to the time that function took to execute.
Each bar can be hovered over to bring up timing details. A starting point to discover performance bottlenecks would be:
Find a wide bar in the flame chart.
Hover over it to bring up the details section.
Ensure the 'Total time' is at a satisfactory amount.
A bar which has a high execution time can be slowing your web page down, click on it to be taken to the corresponding point in code.
There's a dedicated piece of documentation for the Flame Chart over at Google.
Mobile Emulation
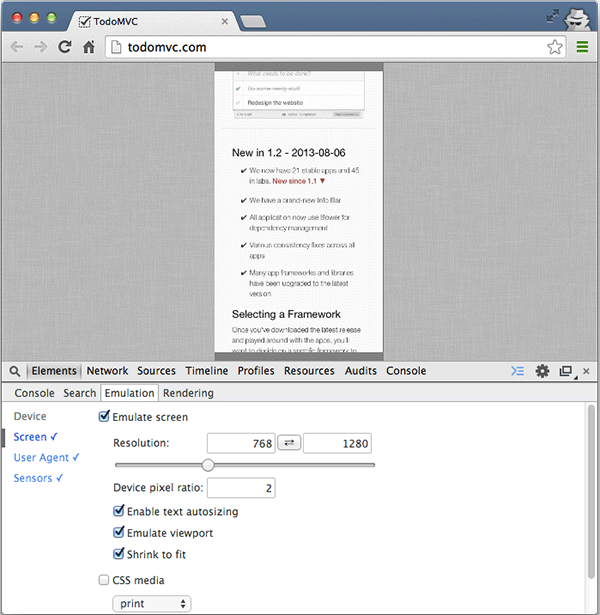
Mobile emulation enables desktop Chrome to imitate certain characteristics of mobile devices. Characteristics can be controlled individually or via a set of fixed presets based on popular devices such as the Nexus 5, Galaxy S4, iPhone, iPad, Kindle and many more.
Right off the bat, you can apply a device preset to see how the inspected web page behaves under mobile conditions.
Open the DevTools drawer by hitting Escape.
Navigate to the Emulation pane.
Select ‘Google Nexus 5'
Press ‘Emulate'
You'll also want to refresh the page to ensure the device settings have been applied correctly. Notice how the visible web page area is now a lot smaller, this corresponds with the aspect ratio of the device preset. What else has changed?
User agent: Typing
navigator.userAgentin the console will output the emulated device user agent, for example:"Mozilla/5.0 (Linux; Android 4.2.1; en-us; Nexus 4 Build/JOP40D) AppleWebKit/535.19 (KHTML, like Gecko) Chrome/18.0.1025.166 Mobile Safari/535.19"Screen resolution: The reported dimensions
screen.widthandscreen.heightnow report the dimensions you'd receive from the device itself. Take note, for the Nexus 5 preset, the width and height is reported as384and640respectively. See A pixel is not a pixel is not a pixel.*devicePixelRatio: *
window.devicePixelRatioreports2which will enable a media query which targetsmin-device-pixel-ratio: 2.Touch Events: "Clicks" you carry out will now translate into the usual touchstart, touchend and other events. Tip: Quickly listen for touch events using
monitorEvents(window, "touchstart");in the Console panel.
Regardless of a device preset, there are some other emulation options available which can be enabled. The Sensors pane in the Emulation panel contains a real-time Accelerometer which can be dragged around.

You can customize the reported latitude and longitude which is also within the Sensors pane, this is useful when the inspected web page makes use of navigator.geolocation methods.
For more information on emulation options available in the DevTools, see the official Mobile emulation documentation.
Canvas Debugging
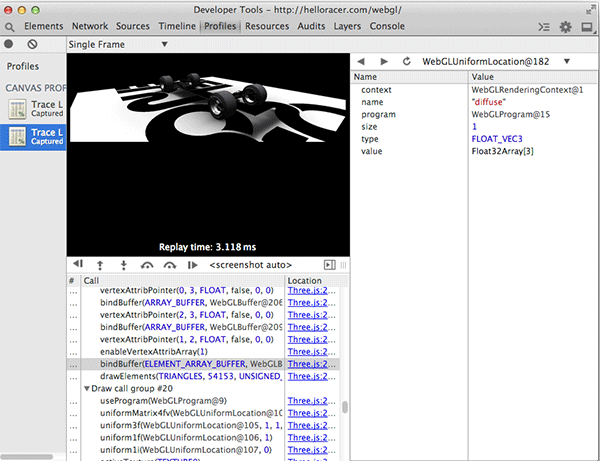
Canvas Inspection in the DevTools is currently an experimental feature. Enable it at DevTools > Settings > Experiments. Canvas Inspection is essentially a profile type, so you'll find it under the Profiles pane where it can be enabled.
What Does the Canvas Profiler Do?
The canvas profiler collects instructions sent to the canvas itself and allows you to step through each one while viewing the current canvas property states and a visual representation of the canvas at a particular point in time.
Once a profile has been recorded, you can explore the top level items (draw call groups) and discover individual draw calls (ctx.drawImagefor example). To the right of each draw call, take notice of the file:linenumber reference, clicking on this navigates you to the Sources Panel with the relevant line of code selected. You can use the toolbar:

... to easily navigate through individual draw calls, or subsequent draw call groups. The drop down allows you to specify what canvas context to inspect the properties of, if there is more than one.
A more detailed guide, see: Canvas Inspection using Chrome DevTools over on HTML5Rocks.
Resources to Catch-Up With
Videos
There's also The Breakpoint Ep. 6: Accelerating Load Time, Run Time, and JS tooling which has a heavy emphasis on performance, it's a year old but still worth a watch.
For those with slow scrolling pages on mobile, checkout: The Breakpoint Ep. 7: Profiling a mobile site with Chrome DevTools with Paul Irish and John McCutchan
A nice in depth breakpoint episode on memory profiling: Ep. 8: Memory Profiling with Chrome DevTools, the episode features Loreena Lee and John McCutchan.
Addy Osmani created a DevTools productivity video: Improving Your 2013 Productivity With The Chrome DevTools.
Paul Irish shows off a bunch of previously experimental features in the DevTools.
Articles
Some DevTools digests were published on HTML5 Rocks, there's the November and December editions with the latest being the Chrome 33 edition.
Remy Sharp shares his Insights into rendering performance with the Timeline panel.
Paul Lewis and Addy Osmani recently wrote an extremely detailed article for Smashing Magazine titled: Gone In 60 Frames Per Second: A Pinterest Paint Performance Case Study which is nice, as it provides practical examples of problematic performance.
Adventures in Jank Busting: Parallax, performance, and the new Flickr Home Page which was posted on the Flickr Engineering blog is another amazingly detailed post on how poor performance was improved dramatically by taking action upon Timeline panel measurements.
Brian Grinstead shares his DevTools Snippets on GitHub along with a blog post.
Miscellaneous
Secrets of the Browser Developer Tools by Andi Smith has a vast array of DevTools tips which should hopefully help make developers more efficient during their development workflow.
DevThemez contains a bunch of custom themes which can be used with the DevTools.
I try to re-tweet/share useful links on my Twitter and Google+ pages in my profile here at Tuts+.
That's all for now, thanks for reading.
Like what you've learned? Learn More About Chrome DevTools!


Comments