In this tutorial, we will explore the core set of debugging tools that new Android app developers need to be aware of in order to create and perfect their apps.
Part 0: Getting Started
This series of Android tutorials is meant to help you build the skills and confidence necessary to build high-quality Android apps. This tutorial is for the Java developer just getting started learning Android app development, who is somewhat familiar with Eclipse, and who has installed the Android SDK and the Android Developer Plugin for Eclipse. Also, you should know how to create a simple Android application (Hello World will suffice) in order to complete this tutorial. If you are not prepared, see the previous tutorials in this series.
Part 1:
Creating Debug Configurations in Eclipse
In the Android Sample Apps tutorial in this series, you learned how to create a Run configuration in Eclipse. Debug configurations are created much the same way, but are used to configure the options for launching and debugging applications.
To create a debug configuration for your application within Eclipse, choose Run, Debug Configurations....
Double-click on Android Application (or right-click and choose New). On the first tab, choose the Browse... button, pick the Android project you want to debug, and then click OK.
Now fill in the Name field. We usually name our Debug Configurations with the project name to avoid confusion, but you can name it whatever you would like.

On the Target tab, check the radio button for "Always prompt to pick device."
Now click the Debug button. You should get the Android Device Chooser dialog. This dialog will display any currently connected Android devices and running emulator instances in the top section, as well as offer the option of launching a new emulator instance via a compatible AVD configuration on-the-fly.
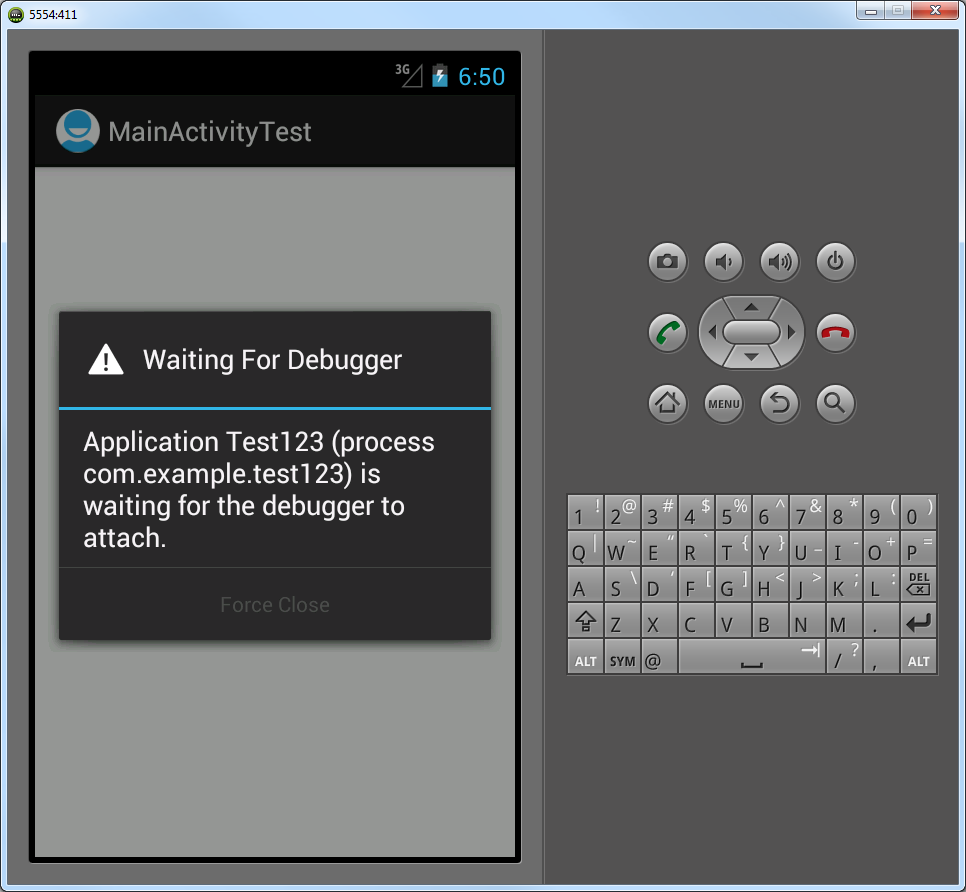
Pick the emulator you already have running and click the OK button. After a moment, your app will launch on the emulator or device, and you will see a dialog that says "Waiting for Debugger" as it attaches.
Part 2:
Exploring the Eclipse Debug Perspective
Once your application is running in the emulator or on a device, you can begin debugging it. Most of the basic debugging features of Eclipse and the ADT plug-in are combined on the Debug perspective for ease-of-use.
The Debug perspective often opens automatically when you start debugging an Android app, but if it doesn't for some reason, you can always switch to it by clicking on the Debug perspective in the top right-hand corner of Eclipse, or by going to Window, Open Perspective, Debug.

The Debug perspective has several panes of information. You can, of course, move them around if you don't like how they are set up.
You've got a panel in the top left-hand corner called Debug, that shows your application, threads. This is where you find the debug toolbar that allows you to attach and detach the debugger and step through the code.
In the right-hand corner, you've got a panel that allows you to inspect variables and manage breakpoints. Breakpoints are locations in your code that you flag where you want your debugger to pause execution so that you can methodically step through your code line-by-line and figure out what's going on.
You've got a panel in the middle of the Debug perspective that displays the code currently being executed.
At the bottom of the Debug perspective, you've got two diagnostic panes: the LogCat pane which displays logging output from the emulator or device, as well as the Console pane that shows higher level console output from DDMS.
Part 3:
Stepping Through Code in Eclipse
Let's work through a quick example of debugging with Eclipse using the application you just launched.
First, we need to get set up since there's nothing wrong with our code and the Debugger hasn't stopped automatically at a problem. Switch to the Java perspective by clicking on the Java button in the top right-hand corner of Eclipse. Double-click on the activity class file associated with your application to open it, then switch back to the Debug perspective and you'll now see that the file is displayed in the middle pane of the Debug perspective. Ok, now we're ready to step through our code.
First, let's set a breakpoint in the code. There are numerous ways to do this. I like to find the line I want to set a breakpoint on, and then right-click on the vertical blue band to the left of the code line and select Toggle Breakpoint from the menu or just click on the band itself to create a breakpoint, toggle it, and then remove it. You can also click on the line you want a breakpoint on and hit Control-Shift-B. A little magnifying glass will appear next to the line of code when the breakpoint is set. A good place to set your first breakpoint would be in the onCreate() method of your Activity.

Once you have set your breakpoint, relaunch the application in debug mode using the Debug configuration. You can do this from within Eclipse using the little bug icon on the toolbar. Click the down arrow next to it, choose your Debug configuration, and it will run. The debugger will attach, your application will start, and then stop at your breakpoint. You will see a little arrow next to the line of code that is currently about to execute.
Now you can step through your code using basic debugging features. These features are available on the Debug panel toolbar, or you can use the hot keys associated with these features.

The most common debugging features in Eclipse that you will need in order to step through your code are:
Step Into: Use this feature to move deeper into your code by moving into method code. Use this if you think the method you are currently executing needs debugging. If this method is well tested and you know it will return the right result, then you probably don't need to step into it, but instead step over it to the next code line on the same "level" as the previous one. Press F5 to step-into code.
Step Over: Use this feature to move to the next line of code on the same level as the previous one. Press F6 to step-over code.
Step Return: Use this feature if you are in the middle of stepping into a method, and are past the area of the method you wanted to inspect. The current method will finish up and you will pop up to the next line of execution after that method has returned so you can continue debugging. Press F7 to step-return.
Resume: Done with this little session of debugging and want the app to start running again (until the next breakpoint is reached)? Then use the Resume feature. Press F8 to resume running without stepping.
Terminate: Done with this little session of debugging and want the app to stop running altogether? Then use the Terminate feature. Press Control-F2 to terminate execution.
Part 4:
Viewing Diagnostic Logging with Logcat
Logging, or printing out diagnostic information from within your code, can be a helpful way to diagnose problems, especially race conditions or timing-related problems that don't happen readily when you are stepping carefully through the code. In this case, you have your code run as normal, but you print out whatever info you like as it runs. You can view this diagnostic info from the LogCat pane of the Debug perspective. You can also access Logcat output in a variety of other ways, from the DDMS tool, the DDMS perspective within Eclipse, or the adb command-line tool, for example.
Adding LogCat logging output to your application is easy but it requires you to change your app Java code and recompile. Also, logging will slow down your application to some extent, so you always want to remove logging from your application before you release it to the public. Learn more about Android logging in Android Essentials: Application Logging.

Conclusion
In this tutorial, you've learned the basics of debugging Android applications with Eclipse and the ADT Plugin. You learned how to navigate Eclipse in debug mode, using the Debug perspective, and how to step through your code and view Logcat logging output. You've learned about debugging on both emulators and devices. You now have a handle on the basic skills that are required to get started developing real-world Android applications. You're well on your way to Android development. What kinds of apps are you looking forward to creating? Which sample app was your favorite? Let us know in the comments!
About the Authors
Mobile developers Lauren Darcey and Shane Conder have coauthored several books on Android development: an in-depth programming book entitled Android Wireless Application Development (now in it's third edition as a two-volume set), Sams Teach Yourself Android Application Development in 24 Hours, and Learning Android Application Programming for the Kindle Fire: A Hands-On Guide to Building Your First Android Application. When not writing, they spend their time developing mobile software at their company and providing consulting services. They can be reached at via email to [email protected], via their blog at androidbook.blogspot.com, and on Twitter @androidwireless.
Need More Help Writing Android Apps? Check out our Latest Books and Resources!


Comments