As interesting as web applications are, they are not the only game in town. These days, mobile applications are a massive part of the software development landscape. Just like with web apps, we want our mobile application code to be performant.
Fortunately, in the last year or two, New Relic has focused hard on building out a solution for monitoring the performance of your mobile apps. Today we will look at how you can start using New Relic to monitor the performance of an Android application.
Why Monitor Mobile Apps At All?
The great thing about building a web app is that you can always deploy a new version, instantly forcing your whole user base to use your new code. So if you weren't monitoring your code before, you can easily hook up New Relic or hack up something custom, push it out, and start getting metrics within a few minutes.
With mobile apps, you're not so fortunate. You can, of course, release a new version any time you want, but the process is potentially longer—app store approval, for example. And even when your new version is out there, you can't force your users to upgrade. It's therefore important to think about any kind of monitoring you might want to do before you ever release the first version of your app.
Even if you don't need to worry about the performance of your app for a while, once you do, your monitoring solution will already be in place, you just need to start interpreting the metrics.
In addition, it's a rare mobile app these days that doesn't also have a web component to it. Just about every application these days makes HTTP requests to an API—and often many different APIs.
As we know, network calls are not always the most reliable things. It would be great if we could find out how often API calls fail for our users and, more importantly, how slow our API calls are on average. It's the only way to know if our users are having a good experience with our application or if they are being frustrated by lag.
If you're not monitoring your application you can only guess about this kind of stuff. I don't know about you, but I am usually much more comfortable with cold hard data.
There are many other important questions that a good monitoring solution can help us answer, but we can cover those as we're working with our Android application, so let's get cracking.
Building A Basic Android App
Normally, for an introductory article like this one, I like to focus on the subject at hand—in this case New Relic for mobile—and keep the rest of the code as Hello World as possible.
It's easy to build a Hello World Android app, Google even has a tutorial about it. Unfortunately, that app is just a little too basic. It makes no network calls, which means we wouldn't be able to look at a large part of what New Relic offers for mobile app monitoring. So, we'll slightly modify our basic app.
Our app will have two screens, on the first screen we will be able to enter a Twitter handle and submit it. At this point our app will go to the second screen and display some placeholder text. In the meantime our application will go off to Twitter and fetch the latest tweet for that handle. Once the tweet is available, we will update the second screen to display it. The app is still pretty basic, but hopefully it is complex enough that we'll be able to get some interesting data from New Relic.
I'm not going to walk through setting up the whole application, but here are the interesting parts. As per the Google tutorial, when we press the button on the first screen, it will pass along the value of the text field to the second screen, but in our case it will be a Twitter handle:
public void sendMessage(View view) {
    Intent intent = new Intent(this, DisplayMessageActivity.class);
    EditText editText = (EditText) findViewById(R.id.edit_message);
    String message = editText.getText().toString();
    intent.putExtra(EXTRA_MESSAGE, message);
    startActivity(intent);
}
On the second screen, we want to fetch the latest tweet for that handle. But we can't do it on the UIThread, we need an AsyncTask. We'll create one and kick it off inside the onCreate method of the second activity:
@Override
protected void onCreate(Bundle savedInstanceState) {
    super.onCreate(savedInstanceState);
    setContentView(R.layout.activity_display_message);
    setupActionBar();

    String handle = getIntent().getStringExtra(MainActivity.EXTRA_MESSAGE);

    TextView textView = new TextView(this);
    textView.setTextSize(40);

    new FetchLatestTweetTask(textView, handle).execute();

    // Set the text view as the activity layout
    setContentView(textView);
}
The actual task looks like this:
public class FetchLatestTweetTask extends AsyncTask<Void, Void, String> {
    private TextView textView;
    private String handle;

    public FetchLatestTweetTask(TextView textView, String handle) {
        this.textView = textView;
        this.handle = handle;
    }

    @Override
    protected String doInBackground(Void... args) {
        Twitter twitter = new TwitterFactory().getInstance();

        String status = null;

        try {
            User user = twitter.showUser(handle);
            status = user.getStatus().getText();
        } catch (Exception e) {
            e.printStackTrace();
        }
        return status;
    }

    protected void onPreExecute() {
        textView.setText(String.format("Fetching tweet by @%s ...", handle));
    }

    protected void onPostExecute(String tweet) {
        textView.setText(tweet);
    }
}
We display some placeholder text before fetching the tweet and update the placeholder text with the tweet's content after we've fetched it. We use Twitter4J to talk to the Twitter API. In order for the API library to work, I've dumped a twitter4j.properties file in the /src folder of the project so that it ends up on the classpath as per the documentation.
The properties file contains the OAuth consumer key, consumer secret, access token key, and access token secret for the Twitter app that I set up just for this.
This is all the interesting code in our application, the rest is just generic boilerplate as per the introductory Google tutorial.
Setting Up New Relic For You App
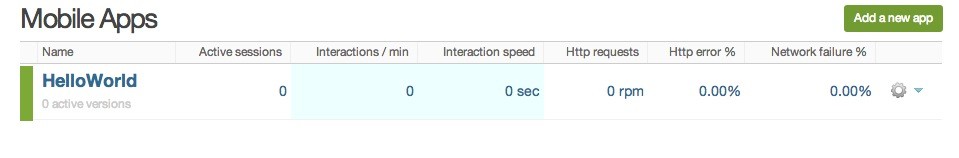
Setting up New Relic to start monitoring your Android app is very easy. In your New Relic account, click on Mobile in the menu. This is where all your mobile apps will live, just like the web apps live under the Applications menu item.
Now click the Add a new app button:
This will take you to another screen where New Relic will walk you through setting up a new app:
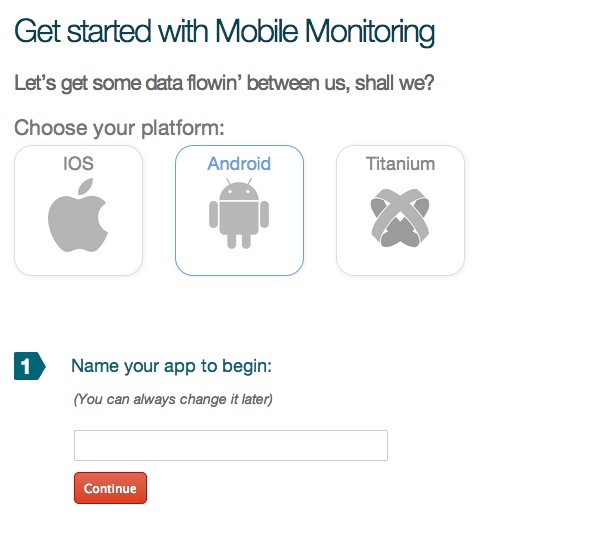
We click on Android and give our app a name. Once you've given your app a name, you need to press Continue so that New Relic generates a new API key for your application.
Next, we need to install the New Relic agent. I'm using Eclipse so I go to Help > Install New Software... and add New Relic as a site:
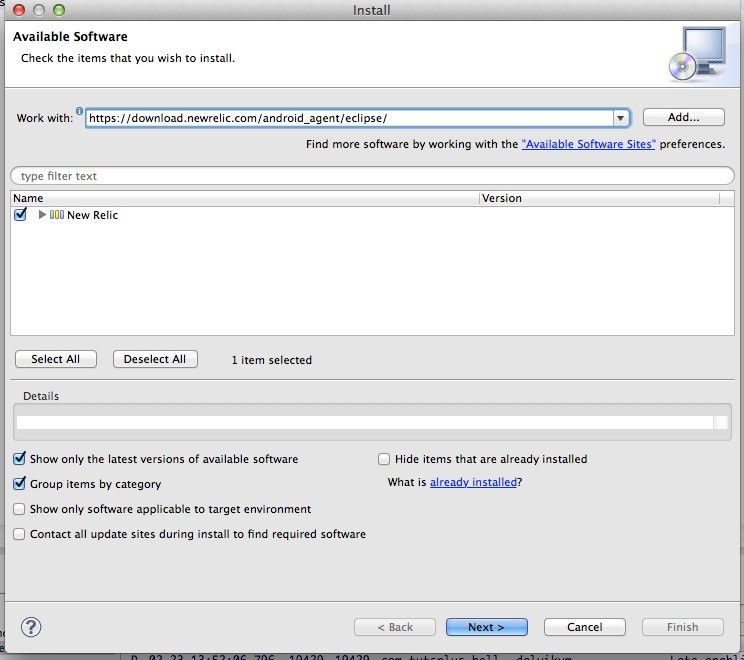
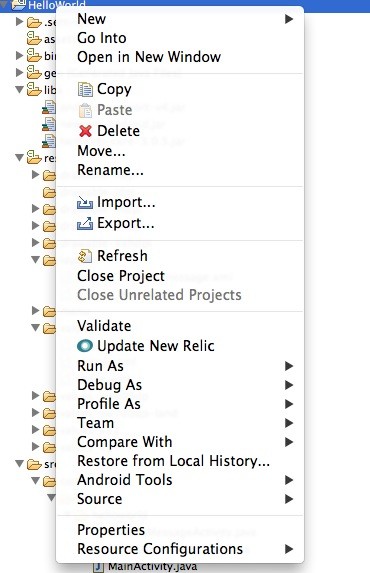
Click Next and wait for Eclipse to do its thing. Once it's done, you need to restart Eclipse. At this point, you should be able to right-click your project in Eclipse and there should be an Install New Relic menu option. When we click it, the New Relic agent jar will end up in the /libs folder of our project.
Incidentally, if a new version of the New Relic agent comes along, you update it in the same way. First, do Help > Check for Updates to get the latest updates. After that, just right-click your project and there should be an Update New Relic menu option, which will update the New Relic jar when clicked:
Now we need to give our app permissions for INTERNET and ACCESS_NETWORK_STATE as New Relic will need to send data back to their servers. Our AndroidManifest.xml will look like this:
<?xml version="1.0" encoding="utf-8"?>
<manifest xmlns:android="http://schemas.android.com/apk/res/android"
    package="com.tutsplus.helloworld"
    android:versionCode="1"
    android:versionName="1.0" >

    <uses-permission android:name="android.permission.INTERNET" />
    <uses-permission android:name="android.permission.ACCESS_NETWORK_STATE" />

    <uses-sdk android:minSdkVersion="8" android:targetSdkVersion="19" />

    ...

</manifest>
Now we just need to launch the agent. In our MainActivity.java we import New Relic:
import com.newrelic.agent.android.NewRelic;
We then start the agent inside the onCreate method:
protected void onCreate(Bundle savedInstanceState) {
    super.onCreate(savedInstanceState);
    setContentView(R.layout.activity_main);
    NewRelic.withApplicationToken("XXXXXXXXXXXXXXXXXXX").start(this.getApplication());
}
Note the application token. If you pressed Continue when you gave your application a name, this should already be pre-filled for you. Once your app is up and running, you can always look it up again in the Settings menu for your application.
After this step, we build the project and deploy it to an emulator or a physical device. I prefer to deploy to a test device as I find it to be faster, more responsive, and easier to work with. I will use my Nexus 4.
If we look at the LogCat tab when the application is deploying, we should see output similar to this:
02-23 17:25:17.004: I/com.newrelic.agent.android(25592): Loaded configuration: HarvestConfiguration{collect_network_errors=true, cross_process_id='null', data_report_period=60, data_token=[0, 0], error_limit=50, report_max_transaction_age=600, report_max_transaction_count=1000, response_body_limit=2048, server_timestamp=0, stack_trace_limit=100, activity_trace_max_size=65534, activity_trace_max_report_attempts=1, activity_trace_min_utilization=0.30000001192092896, at_capture=ActivityTraceConfiguration{maxTotalTraceCount=1}}
02-23 17:25:17.054: I/com.newrelic.agent.android(25592): Application state monitor has started
02-23 17:25:17.104: I/com.newrelic.agent.android(25592): Measurement Engine initialized.
02-23 17:25:17.114: I/com.newrelic.agent.android(25592): New Relic Agent v3.264.0
This is how we know that New Relic has loaded. After that, if we keep looking at LogCat we'll see something like this every minute or so:
02-23 17:55:40.410: I/com.newrelic.agent.android(31413): Harvester: connected
02-23 17:55:40.410: I/com.newrelic.agent.android(31413): Harvester: Sending 2 HTTP transactions.
02-23 17:55:40.410: I/com.newrelic.agent.android(31413): Harvester: Sending 0 HTTP errors.
02-23 17:55:40.410: I/com.newrelic.agent.android(31413): Harvester: Sending 0 activity traces.
This is New Relic calling home to send data. If we now go back to the New Relic user interface we should start seeing data.
Exploring the Dashboards
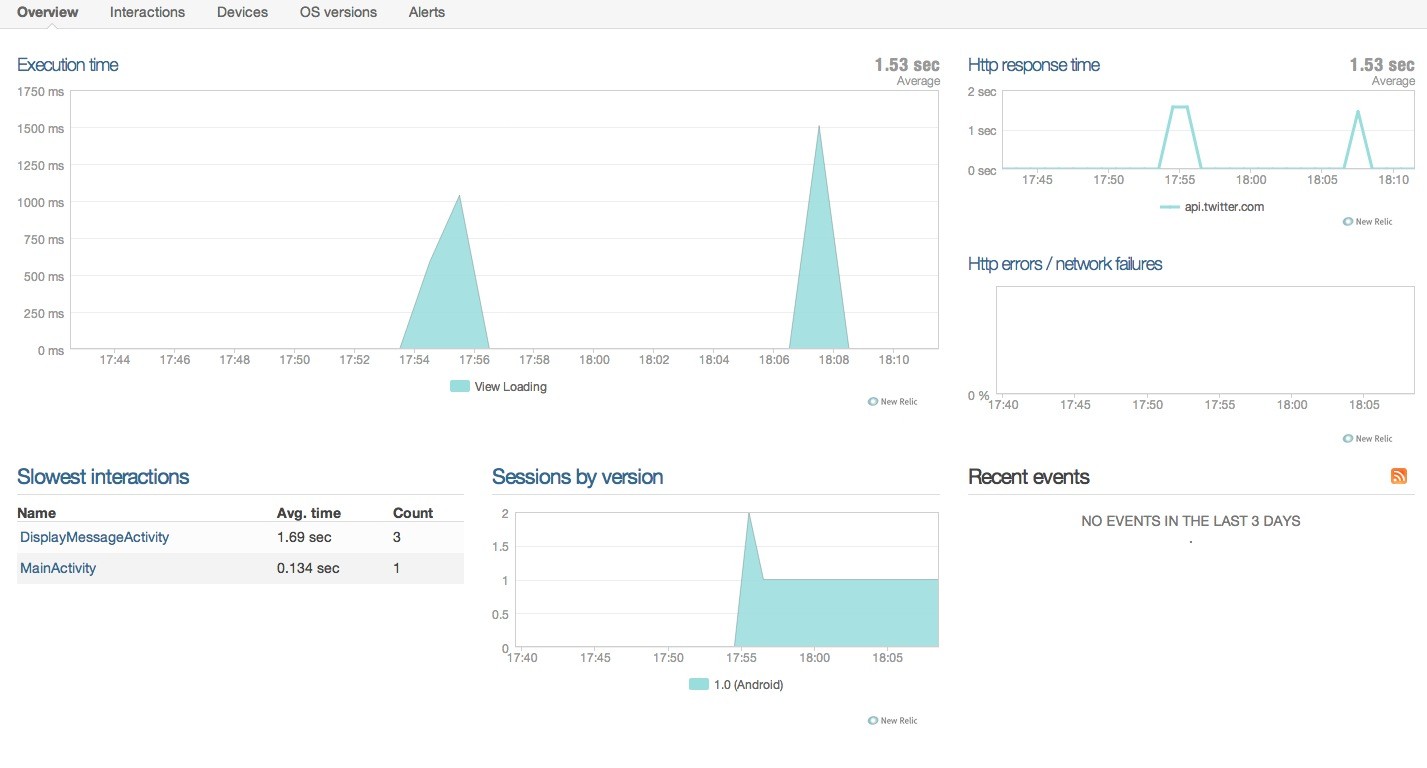
The activity on those graphs is sporadic since we only have one client sending back data and we've only done a couple of interactions.
So what are some of the more interesting things that you can see in New Relic for your mobile app? Well, there is the App > Devices tab that shows you which devices people are using your app on. This is interesting since you can tell at a glance what sort of phones/tables most of your user base is using. Are people mostly on older devices or newer ones? Are they mostly on tablets or phones? This is valuable data.
You can drill down into each device and see how well your app is doing there. Is the interaction time for that device slower than what you would expect? What about the Http response time? How many active users are currently using your app on this type of device? In our case:
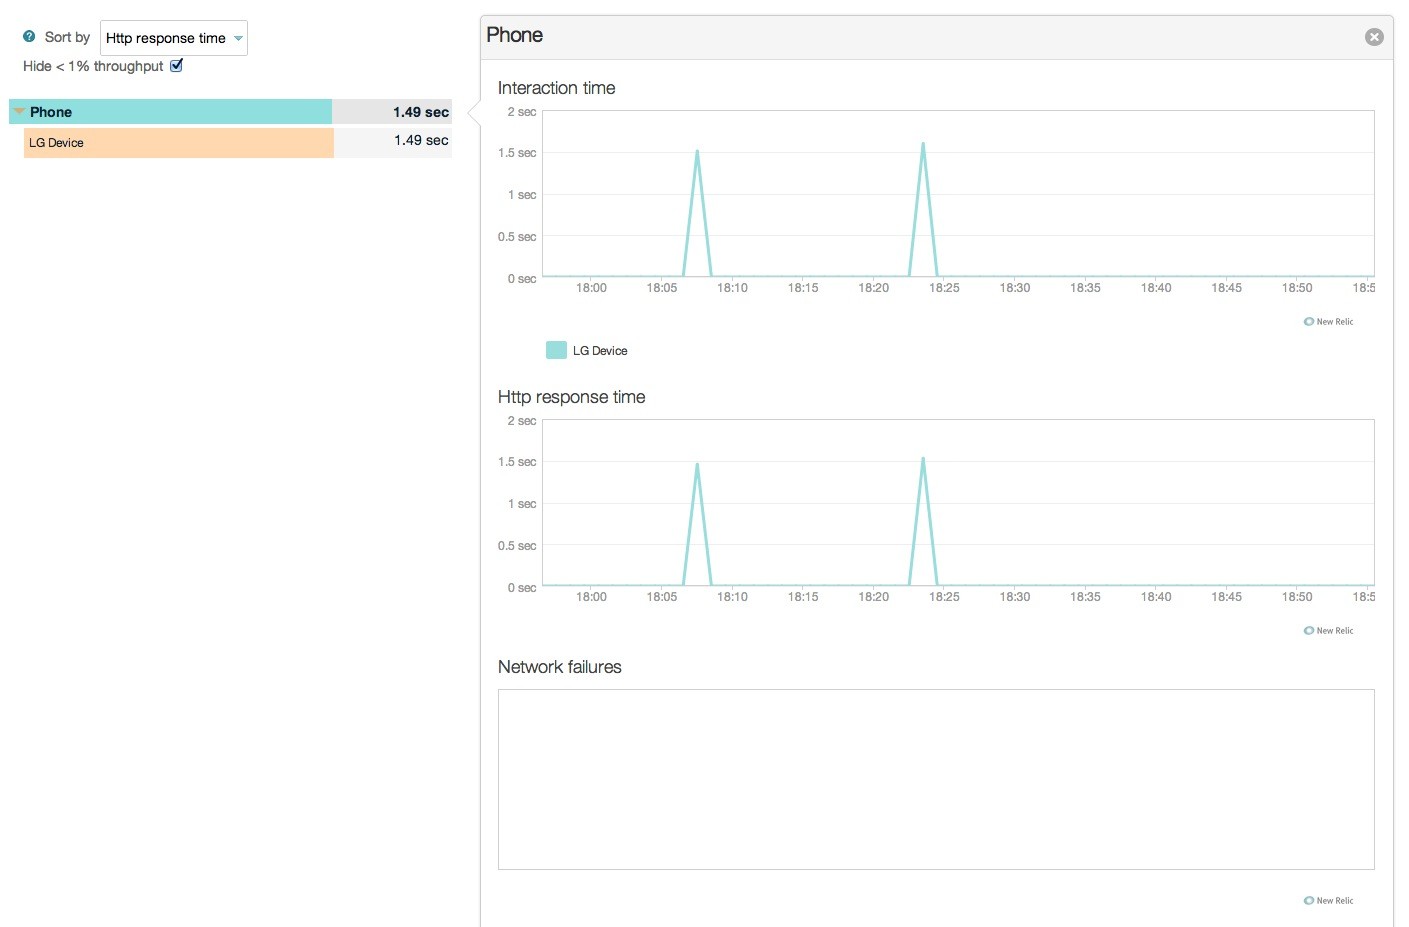
There is only one device, so there isn't that much to see. But if a large percentage of your user base was on a device where your app wasn't performing very well, you would see it straight away and be able to address the issue.
Similar to the Devices tab, there is the OS versions tab, which breaks down the usage of your app by the version of Android that your users have installed:
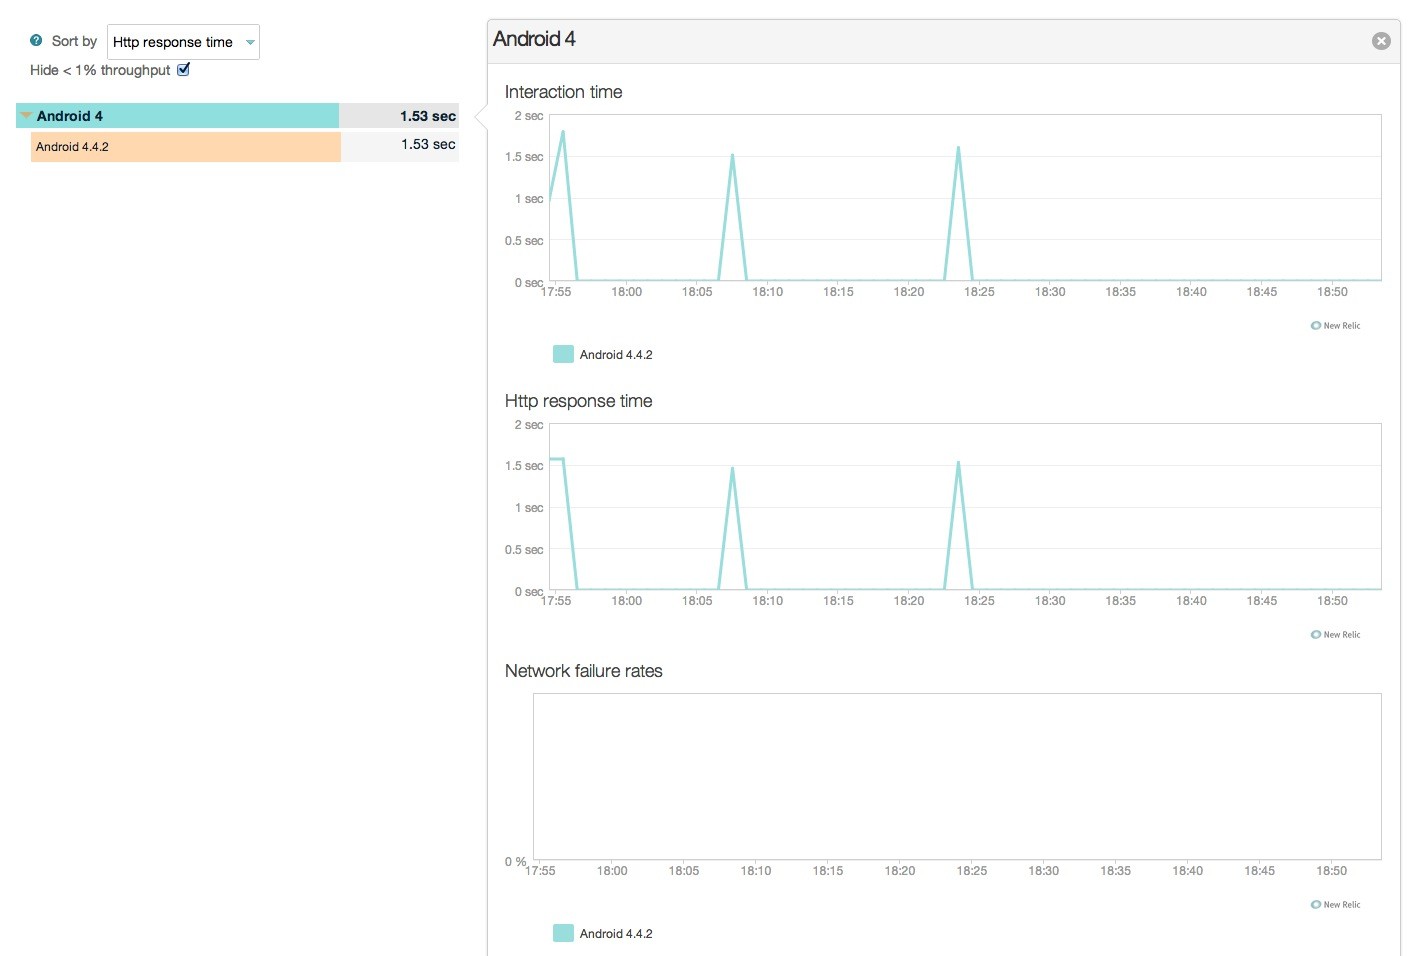
You can tell if you need to focus more of your attention on newer versions of Android or if most of your user base is still on an older version.
Then there's the Network tab and its children. In the Map tab, you can see which APIs your app connects to and how well each one of them is doing. What's the throughput, response time, and error rate:
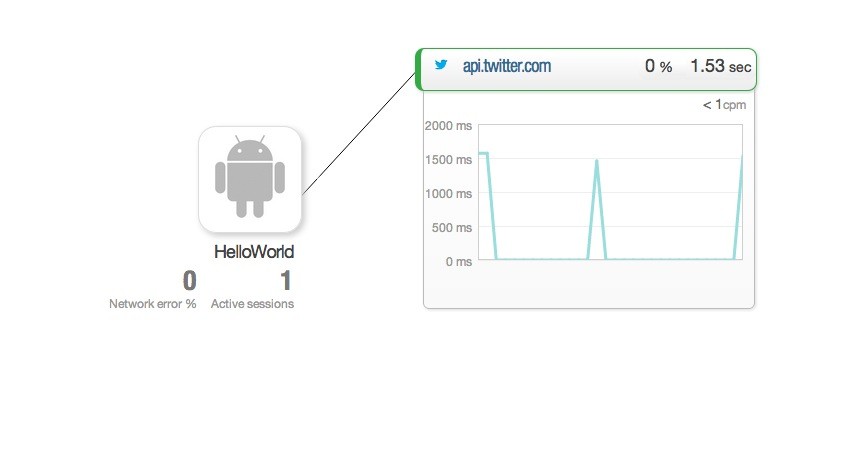
In our case, we only have the Twitter API and it's pretty slow actually. Maybe we might consider caching some of the responses for a period of time.
In the Networks > Http requests tab, we can drill down into each endpoint of every API that we use in a similar way to how we drill down into devices and OS versions. We can find out which endpoints are used most and which are the slowest. This gives us some solid leads regarding where to direct our optimization efforts. This is especially true if we also control the APIs that are being used.
In the Network > Geography tab, you can tell where most of your users are coming from and in the Carriers tab you can see what kind of internet connection your users have. In our case, I am on Wi-Fi:
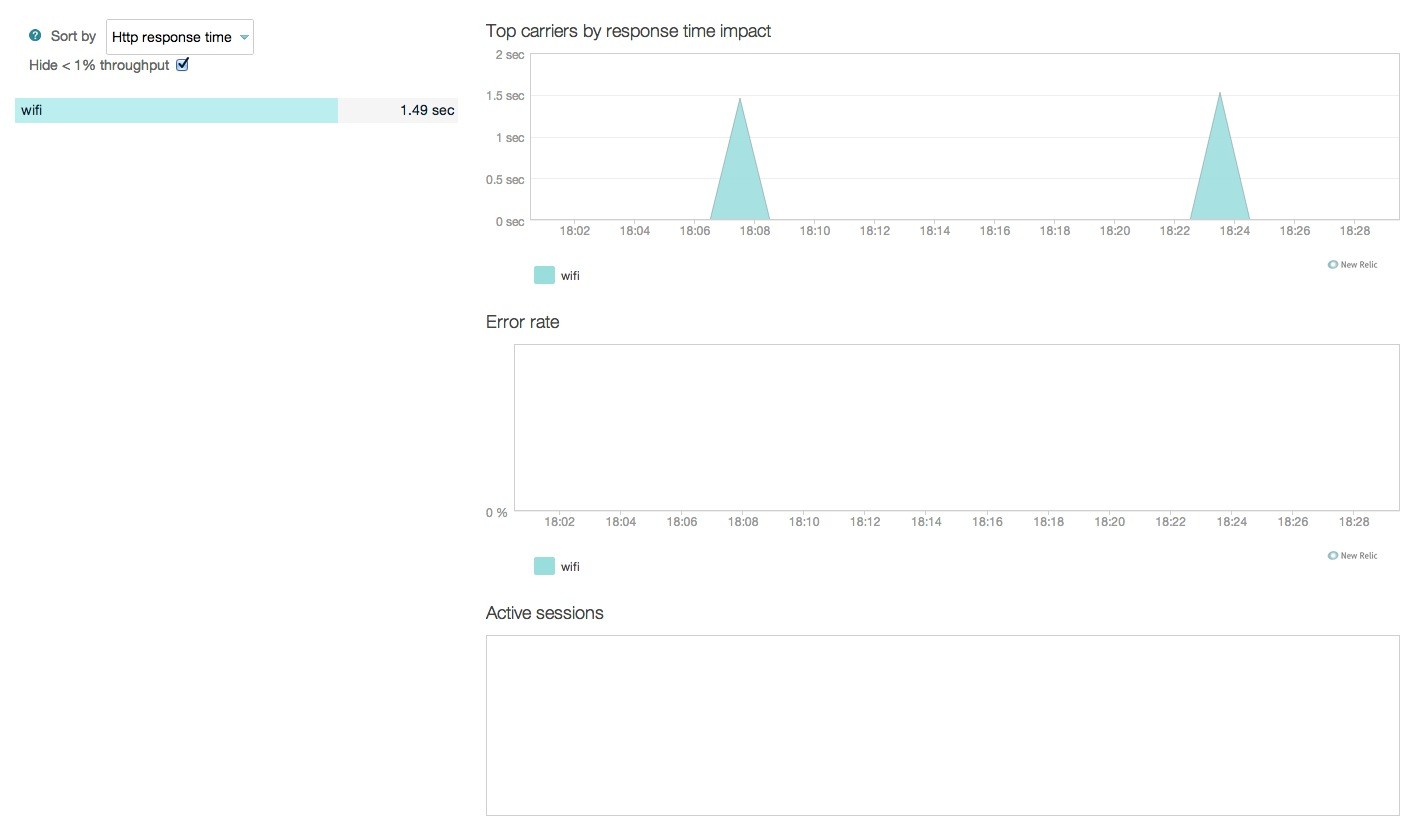
It's very valuable to know if your user base is using Wi-Fi, 3G, or 4G as your optimization efforts can be completely different depending on the breakdown.
Under Settings > Alerts, you can also define some conditions for your external APIs for New Relic to notify you if response times exceed a certain threshold or if error rates go above a certain percentage.
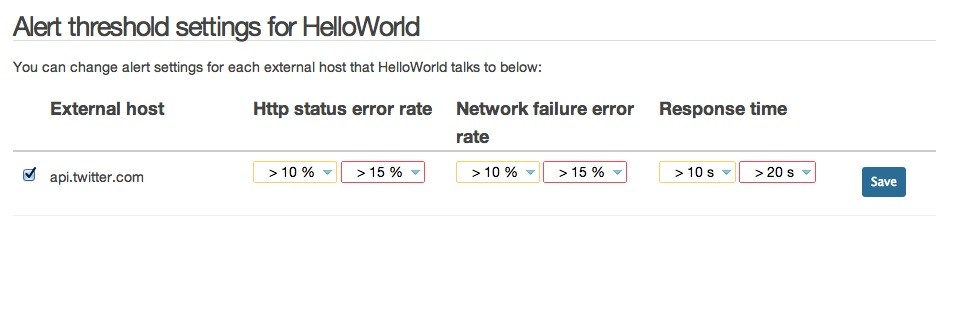
This is potentially less valuable for APIs you don't control, but still a good indicator if an API you're using is unstable or not very performant.
The last two interesting ones are Usage > Versions and Usage > Monthly Uniques. The first one shows you which versions of your app are being used in the wild. This allows you to tell how eagerly users download updates of your app. It also shows you how well each version of your app is performing on the device. Is the new version using more memory than the previous version?
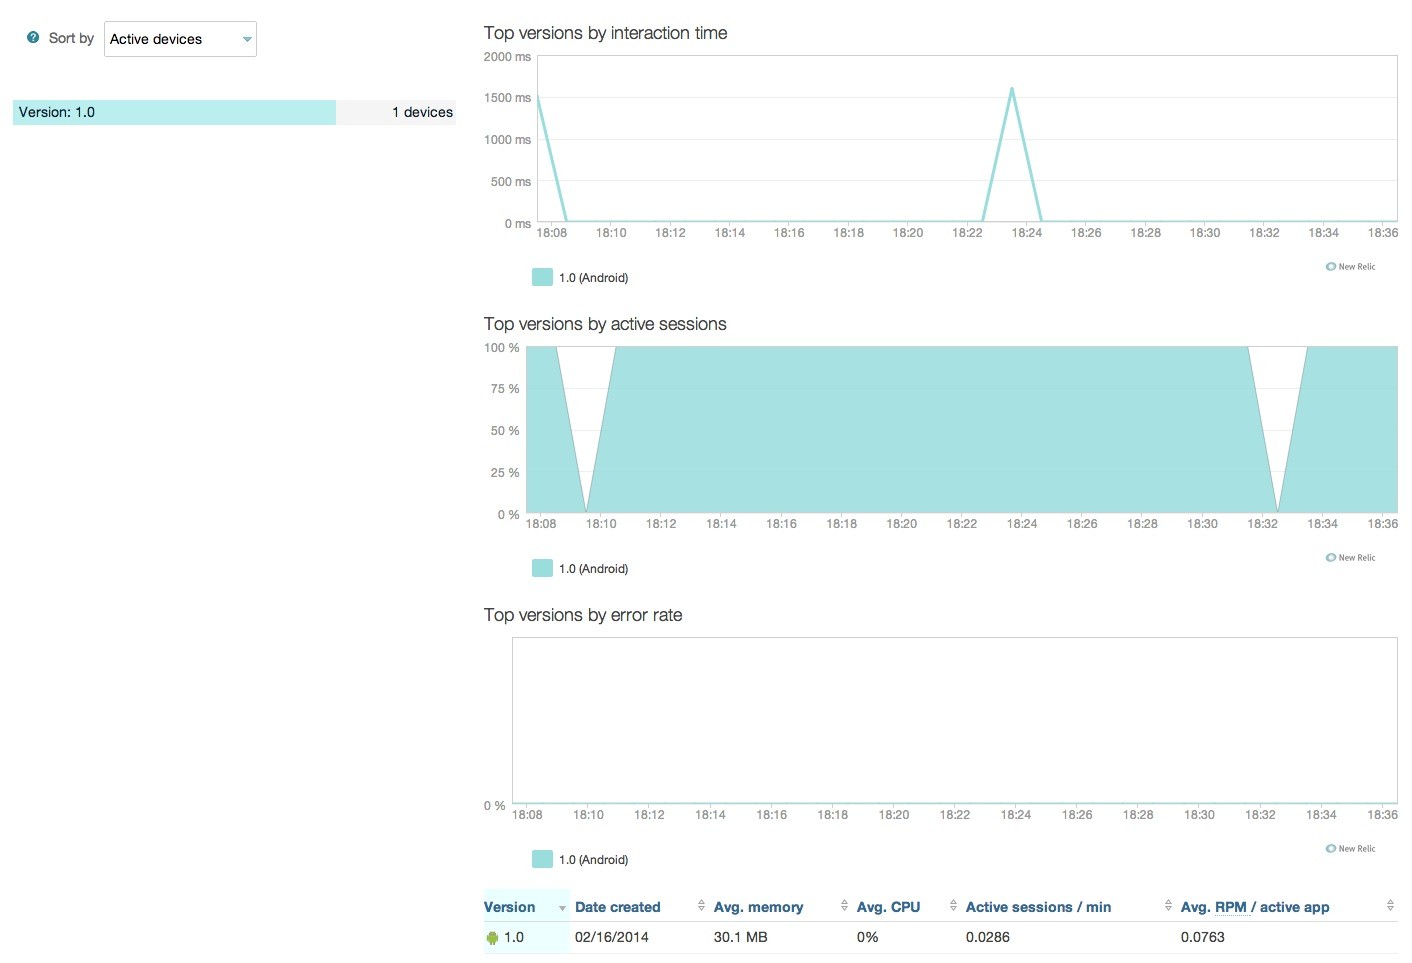
The monthly uniques basically gives you an idea if people are actually interacting with your app. You may have 10 million downloads, but if the number of monthly uniques is low, then things aren't as great as they seem to be.
Conclusion
This is a basic overview of some—but not all—interesting features of New Relic for Android apps. In and of themselves, none of the features are mind blowing, but it is good solid data that, for a mobile app, you can't get any other way.
How your app is being used and on which devices, how well your network calls are performing on a slow connection, this is the type of data that forces you to stop guessing and make informed decisions about how to improve your app and give your users a better experience.
Remember, performance is just as important for mobile apps as it is for web apps, and there's no reason to guess about what's making your app slow when there's a much better way readily available.

Comments