If you're asking, "What's Yii?" check out Introduction to the Yii Framework, which reviews the benefits of Yii and includes an overview of Yii 2.0.
Introduction
In the Programming With Yii2 series, I'm guiding readers in use of the Yii2 Framework for PHP.
In today's tutorial, I'll show you how to install the Yii2 Debugger, and we'll explore its capabilities in detail. It's a powerful programming assistant which is often underutilized.
As you code and test your application, the debugger can show you your application path, queries and query variables, performance characteristics, server and framework settings, and much more. Please follow along with me for an extended tour.
Before we get started, please remember, I do try to participate in the discussions below. If you have a question or topic suggestion, please post a comment below or contact me on Twitter @reifman.
If you noticed the gap in between the Programming Yii series episodes, it's because I had to have brain surgery last year. Thank you for your patience and support—it's nice to be writing again regularly, and I'm looking forward to continuing coverage of Yii2.
Getting Started
Installing the Debugger
First, you'll need to add the yiisoft/yii2-debug library to composer.json or install it manually as follows:
$ composer require yiisoft/yii2-debug
$ composer update
There are a couple of ways to set up the debugger in your application. The most common way is to do so in your application's main.php configuration:
return [
    'bootstrap' => ['debug'],
    'modules' => [
        'debug' => [
            'class' => 'yii\debug\Module',
        ],
        // ...
Alternately, you can programmatically configure the debugger for a specific mode as I've done below:
// ...
if (!YII_ENV_TEST) {
    // configuration adjustments for 'dev' environment
    $config['bootstrap'][] = 'debug';
    $config['modules']['debug'] = [
        'class' => 'yii\debug\Module',
        'allowedIPs' => ['*'],
    ];
    // ...
The above configuration disables the debugger during acceptance testing.
Accessing the Debugger
Initially, the debugger will appear at the bottom of your application screen:
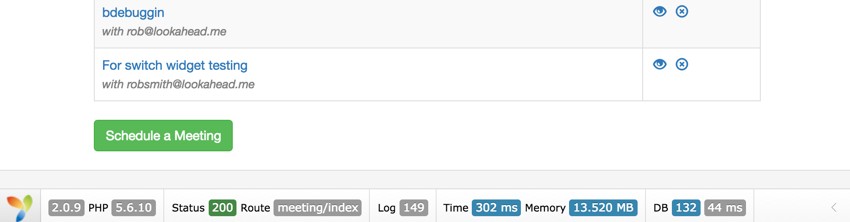
However, by clicking the less than sign at the far right, you can minimize the toolbar as shown below:
You can access the debugger at any time by clicking on it or visiting the debug URL as shown:
http://localhost:8888/yourapp/index.php/debug/default/index
The Debug Console
The initial debug console will show the toolbar at the top of your screen and then a list, descending backwards in time, of all the executed paths of your application by URL:
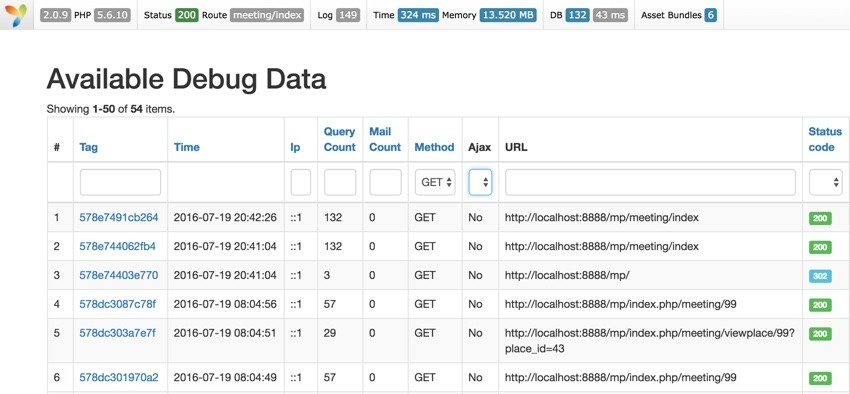
By clicking the Tag elements above, you can access more detailed debug information for any given page request, even if it's from 10 minutes or an hour ago.
The Toolbar
You can also click on specific elements of the toolbar, like Time or DB to jump directly to the console display for performance or database queries for the current executing page:

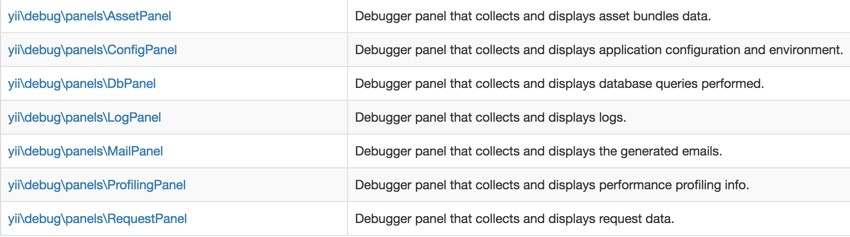
Each toolbar element roughly corresponds to one of the available debug panels:
The Request Panel
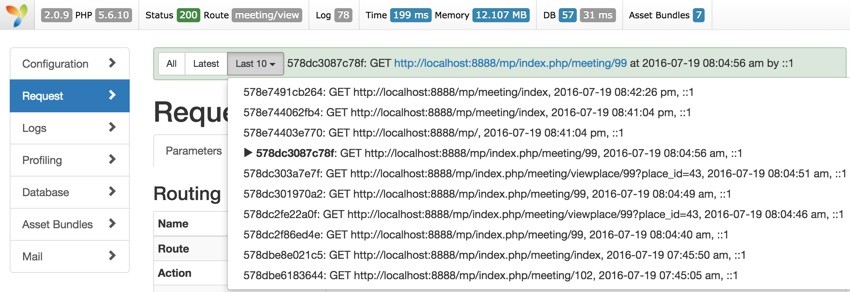
The request page shows you all the variables associated with a specific URL, from query variables to cookies:
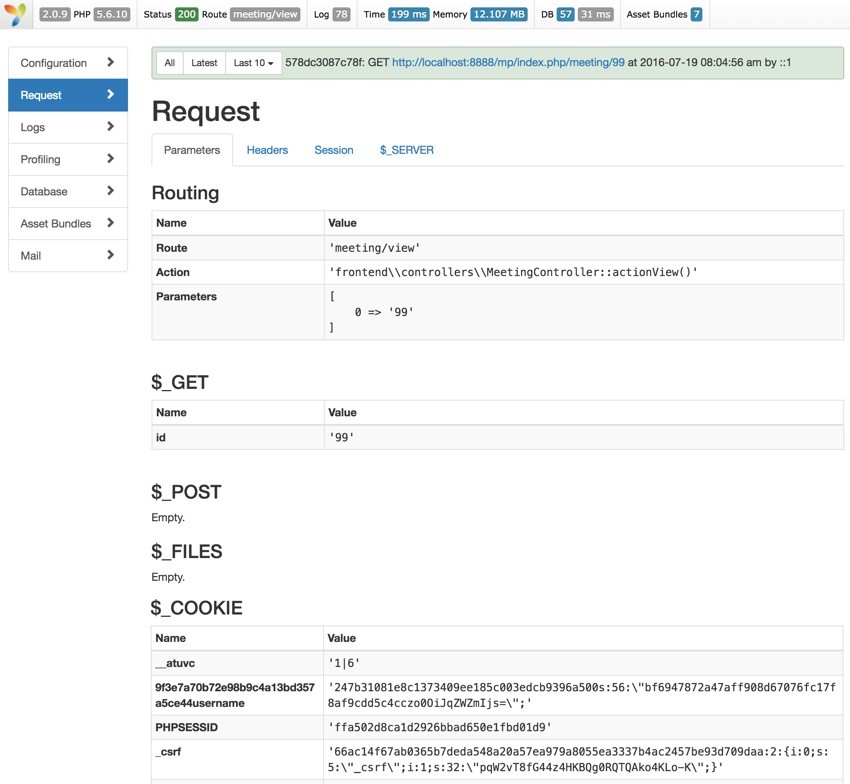
From these console panels, you can always click All, Latest, or Last 10 to navigate to other URL requests (forward or back):
The Configuration Panel
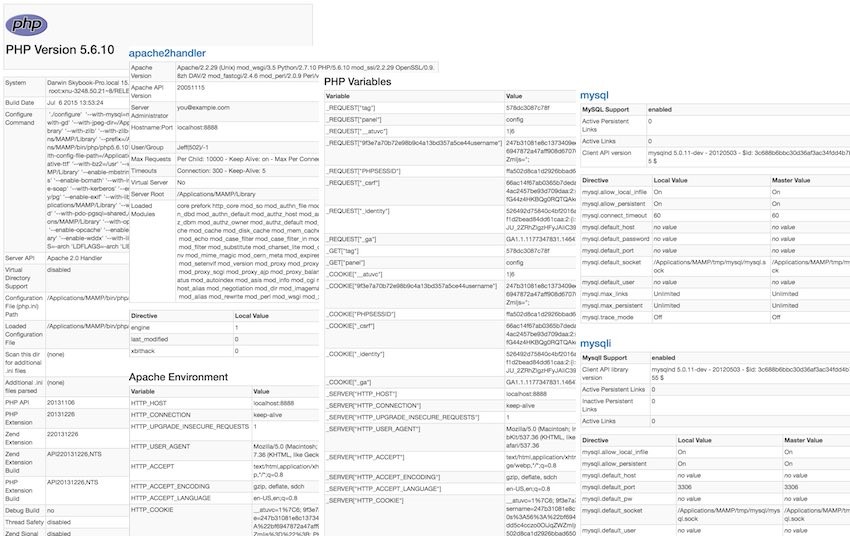
The Configuration panel shows you details about the currently installed framework, its version number, extensions and similar information for PHP:
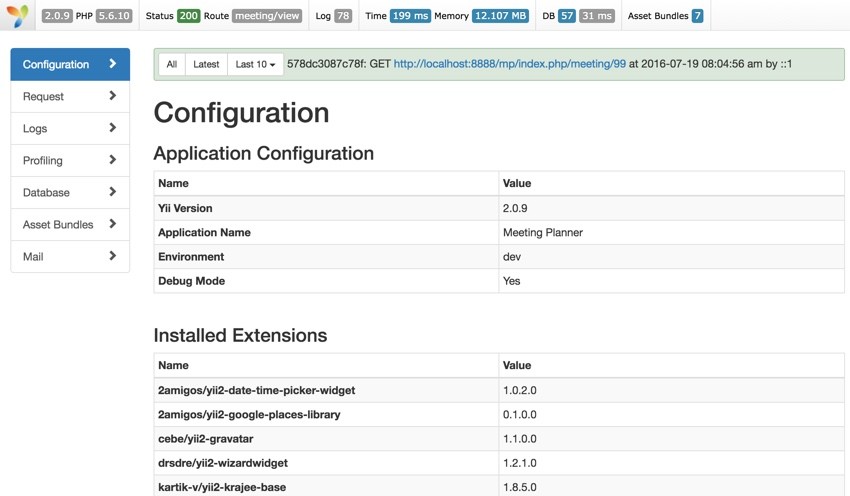
In fact, if you continue scrolling down, the Configuration panel is (almost overly) extensive, even venturing into credits for the PHP developer team:
The Logs Panel
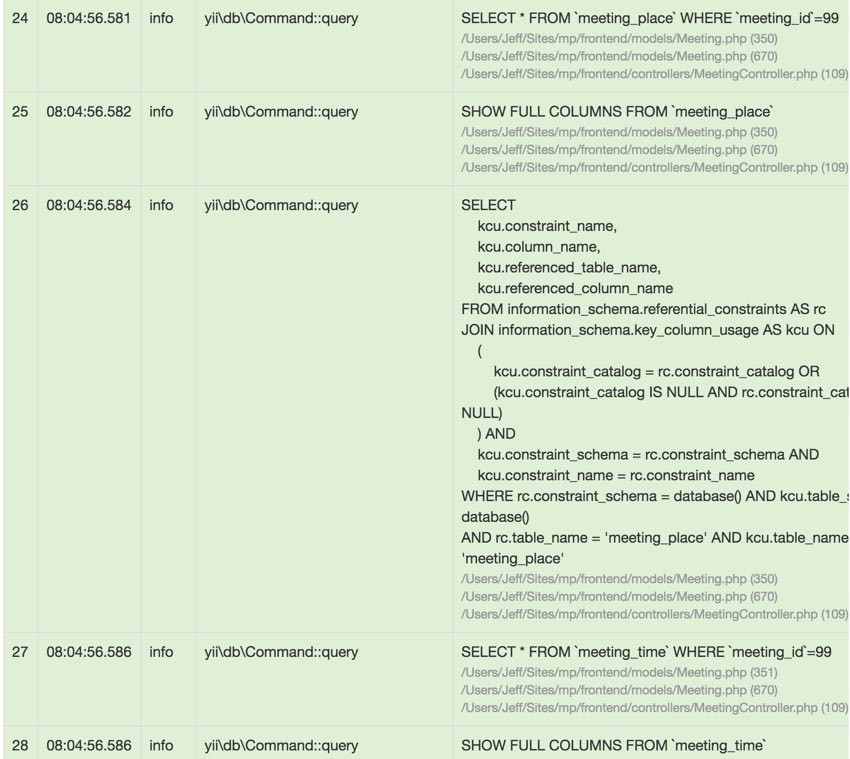
Extremely useful, Log Messages show you the execution trace of your current application page:
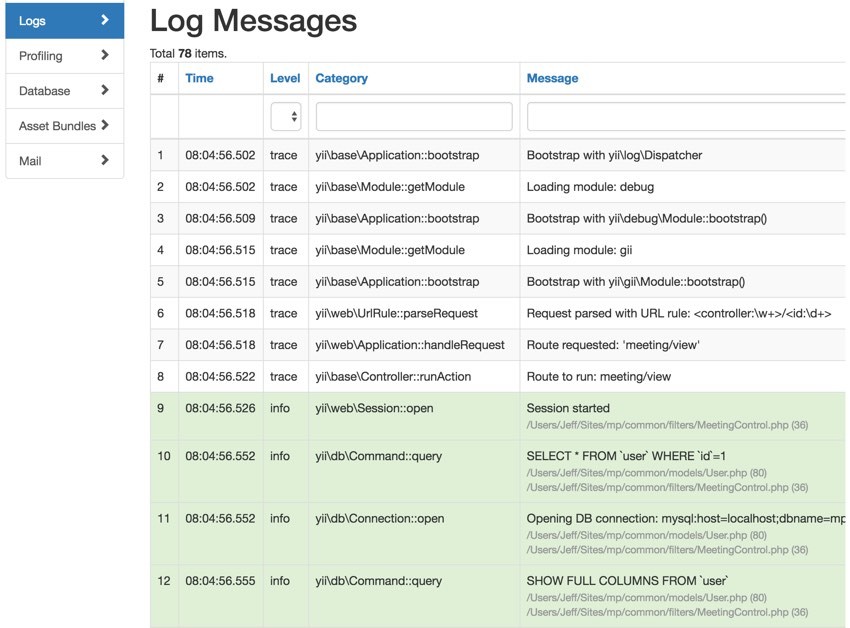
It's especially helpful for navigating code to find problems with code and debugging database queries:
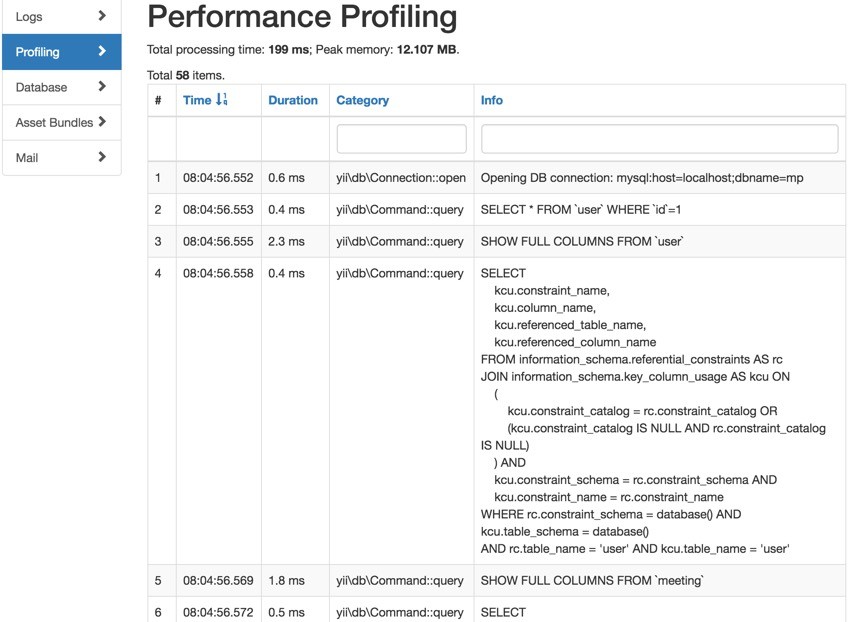
The Performance Profiling Panel
The default view of the Performance Profiling panel shows you how long each element of your page request took, e.g. Duration:
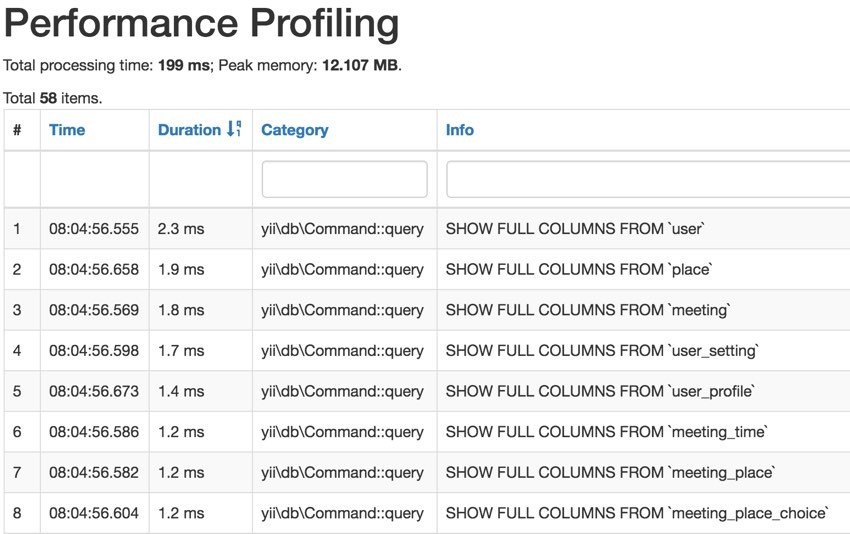
You can sort by Duration and discover the slowest elements of your page:
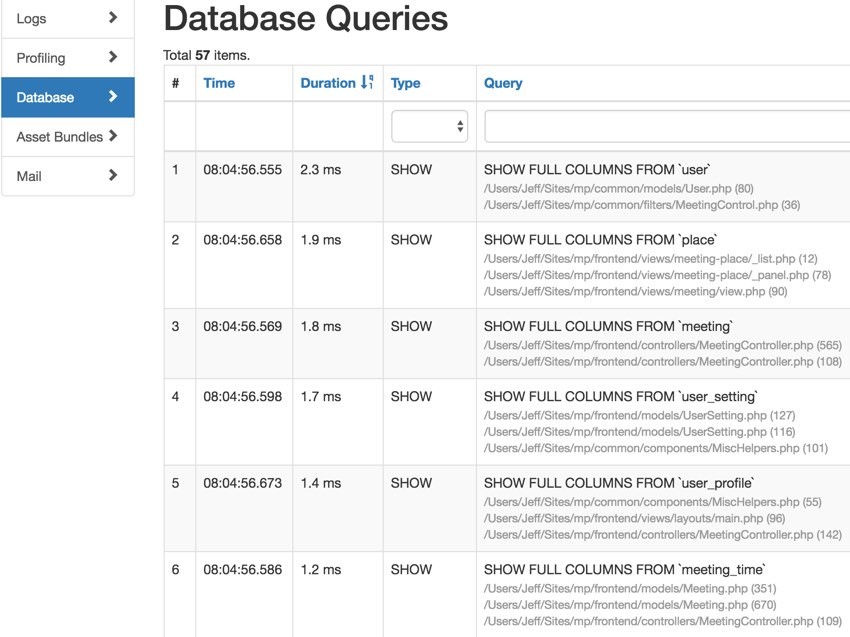
The Database Queries Panel
The Database Queries panel shows you a lot of the above filtered by database activity:
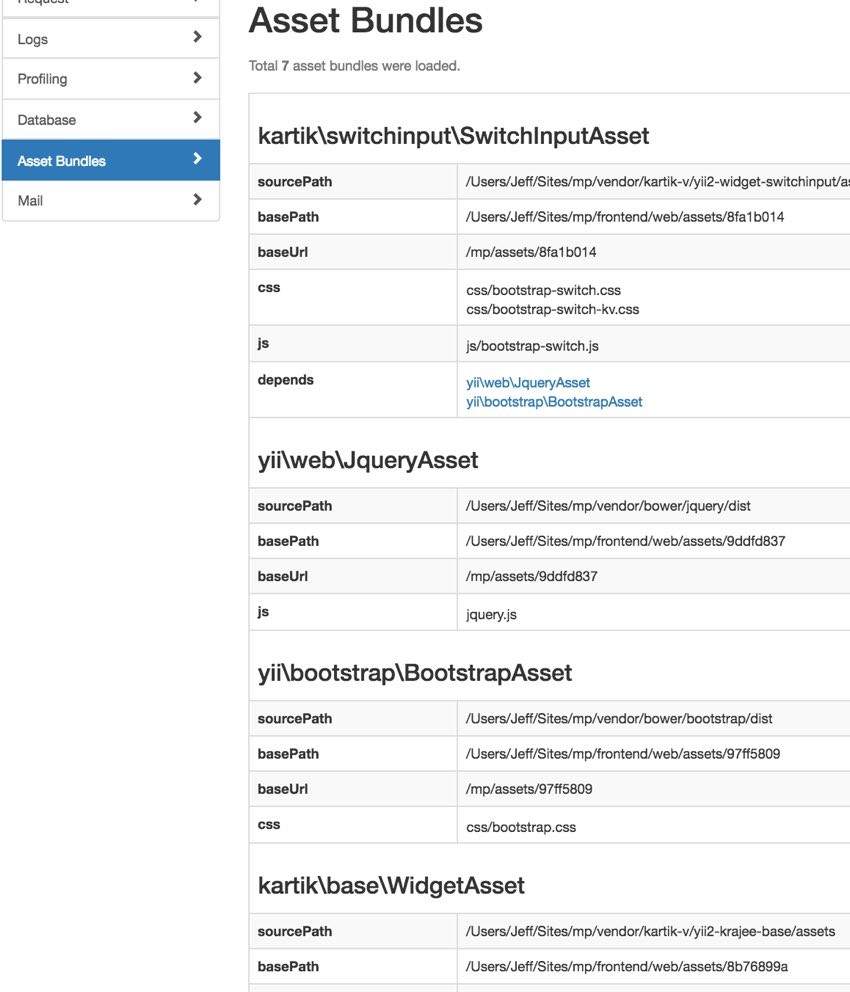
The Asset Bundles Panel
On Asset Bundles, it will show you all the components that Yii is using on your page, such as CSS and JavaScript and which asset files they are loaded from:
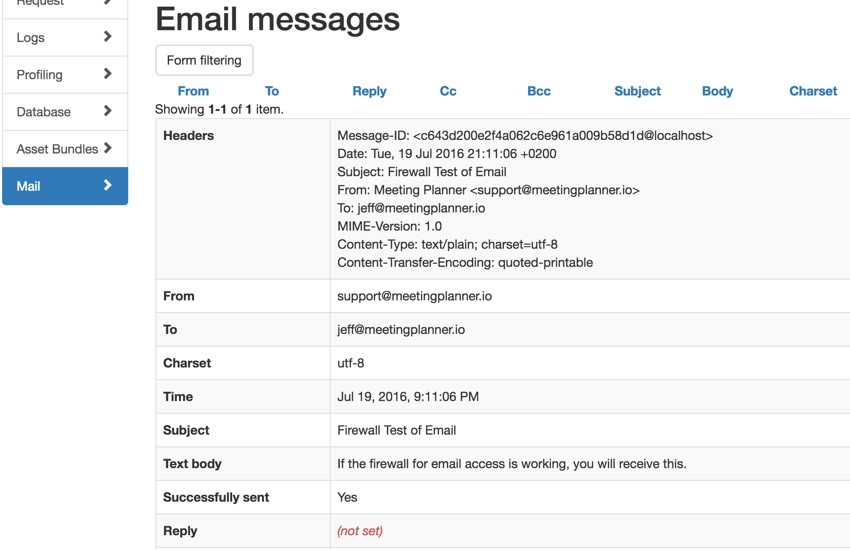
The Email Messages Panel
On Email Messages, if the page you are viewing sent a message using Yii's SwiftMailer, you'll be able to see the headers and field settings on this panel:
Overall, the Yii2 debugger provides a fairly broad and detailed view of what's happening in the framework and your application.
In Closing
I hope you've enjoyed exploring the Yii debugging console with me and that it has been productive for you.
We've come pretty far in the Yii2 series, and at this point especially, I'd like to hear what features and topic requests would be most helpful to you. You can post them in the comments below or email me at my Lookahead Consulting website.
If you'd like to know when the next Yii2 tutorial arrives, follow me @reifman on Twitter or check my instructor page. My instructor page will include all the articles from this series as soon as they are published.
To explore a more advanced Yii2 application now, check out our startup series and Meeting Planner. The application is now in alpha release, and you can schedule meetings with friends. You can also download the code—it's open source.

Comments