New Relic has gained name and fame for being the number one solution for monitoring application performance. It tells you what you need to know about your applications to improve performance by reducing response time and increasing application throughput. It helps you track down bottlenecks and monitor your server infrastructure.
However, you're reading this article, because you're interested in mobile. Don't worry, New Relic has your back covered too. New Relic Mobile lets you monitor the performance of iOS and Android applications. Alan recently wrote about New Relic for Android so I suggest you check out his tutorial if you're interested in Android.
In this tutorial, I will show you how to integrate New Relic in an iOS application. You will learn how easy it is to set up New Relic and what it can do for your iOS application in terms of performance and making sure your users get the best possible experience using your product.
Is It Necessary?
If you think application performance monitoring is only useful if you maintain a large-scale web application like Facebook or Twitter, then you're in for a surprise. Monitoring application performance is always useful if you care about the user experience of your product and its users.
Use Cases
There are several reasons why performance monitoring is vital to the success of your application. No matter how often you talk to the users of your application or how large your group of testers is, you don't know how every one of your users is using your application and what problems they run into.
Not too long ago, I developed and maintained an iPad application that integrated with Aperture and iPhoto. Event though the concept was pretty straightforward, I was often baffled by the way people were using my application. Believe me when I say that your application will be used in ways you didn't anticipate or even thought of. This is fine and perfectly normal, but make sure you have a solution in place that tells you what you need to know about your application's health and performance so you can optimize for use cases that you didn't consider during development.
Network Issues
Another common misconception is that mobile devices are lightning fast and everyone has access to a blazing fast LTE connection. I'm afraid the truth is less rosy. New Relic lets you monitor the API requests your application makes, how long they take to complete, and how this impacts your application's user experience.
If your application fetches data from an API and that request takes several seconds to complete, then your users might ditch your application the second or third time they use it. People don't like to wait and they expect everything to be fast.
As David Smith recently pointed out in An Unexpected Botnet, your application can sometimes show unpredictable behavior, no matter how well you know the code base and the system frameworks your application interacts with. Don't wait for your users to report problems to you or, even worse, for them to look for an alternative without even telling you about the problem that made them switch.
1. Creating an Application in New Relic
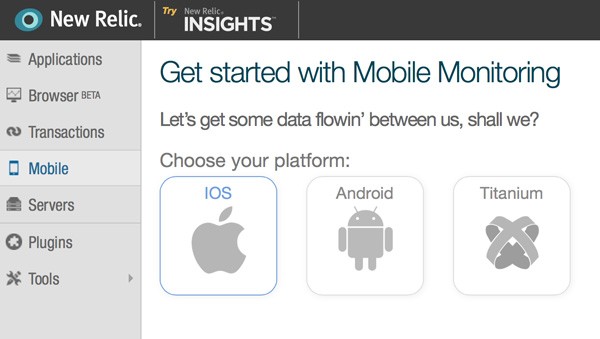
Getting started with New Relic is free. Head over to New Relic's website and create an account so you can follow along. In your New Relic account, select the Mobile tab on the left and choose iOS from the list of platforms.
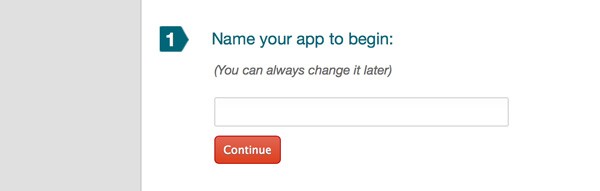
Give your application a name and click Continue to get started integrating New Relic in your iOS application.
2. Installing the New Relic SDK
The next step is integrating the New Relic SDK into your iOS application. To give you a head start, I've created a sample application that you can use, which you can find in the source files of this tutorial. The sample application is a simple weather client I created for another tutorial. It's a great fit for New Relic Mobile.
You have two options to install the New Relic SDK, manually or through CocoaPods. Because the sample application already uses CocoaPods, I'll be using CocoaPods to install the New Relic SDK.
Open the project's Podfile at the root of the project and update the list of dependencies as shown below.
platform :ios, '6.0'

pod 'ViewDeck', '~> 2.2.11'
pod 'AFNetworking', '~> 1.2.1'
pod 'SVProgressHUD', '~> 0.9.0'
pod 'NewRelicAgent', '~> 3.289'
To install the New Relic SDK, open a terminal window, navigate to the location of the project's Podfile, and run pod update. The beauty of CocoaPods is that it also links the project against the necessary frameworks and libraries. The New Relic SDK depends on the Core Telephony and System Configuration frameworks as well as the libz library. If you're using CocoaPods, you don't have to worry about this.
Build the project to verify everything is working as expected and no errors are thrown by the compiler.
If you're new to CocoaPods, then take a few minutes to read my tutorial on CocoaPods. CocoaPods has become the de facto dependency management tool for iOS and OS X development.
3. Integrating New Relic
Step 1
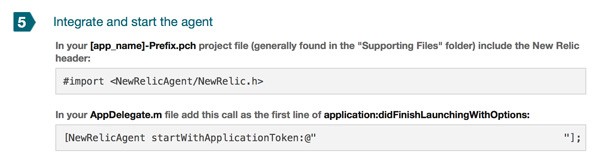
Once you've installed the New Relic SDK, integrating New Relic is easy as pie. Open your project's precompiled header file and add the following import statement.
#import <NewRelicAgent/NewRelic.h>
The precompiled header file is located in Supporting Files and ends in -Prefix.pch. The precompiled header file of the sample application, for example, is named Rain-Prefix.pch.
Step 2
To set New Relic up, open you application's application delegate and add the following snippet to application:didFinishLaunchingWithOptions:. Make sure to pass your own application token as the argument of startWithApplicationToken:.
[NewRelicAgent startWithApplicationToken:@"XXXXXXXXXXXXXXXXXXXXXXXXXXXXXXXXXXXXXXXXXX"];
You can find your application's token in the New Relic dashboard.
4. Run the Application
The sample application uses Forecast to fetch weather data so replace the API key in MTConstants.m with your own API key. You can create a free Forecast account at the Forecast website.
#pragma mark -
#pragma mark Forecast API
NSString * const MTForecastAPIKey = @"XXXXXXXXXXXXXXXXXXXXXXXXXXXXXXXX";
5. Exploring the New Relic Dashboard
Overview
Once you've successfully set up New Relic for your iOS application, it will automatically start sending data to New Relic's servers. The amount of data the SDK collects for you is astounding and the level of detail may even be a bit overwhelming. Let's take a moment to see what data New Relic has collected for our weather application.
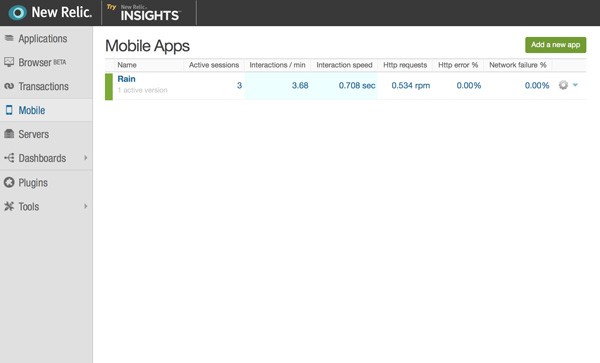
Sign in to your New Relic account and select the Mobile tab on the left to see a list of the mobile applications New Relic is monitoring for you. This list immediately gives you an idea of the status of your application by showing you the number of active sessions, network performance, and possible problems New Relic has detected. Click Rain to further explore the data New Relic is collecting for us.
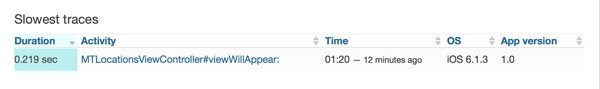
The Overview page shows you a high-level picture of how your application is performing. It shows you a number of key performance statistics, such as execution times of various operations, including the loading of views and execution of HTTP requests.

You are looking at live data, but you can adjust the timescale at the top right of the page to browse historical data.

Even though network performance is important for most mobile applications, the performance data New Relic collects isn't limited to that. If you open the Interactions tab at the top, you'll see how long certain interactions take and, more importantly, New Relic conveniently shows you which interactions are slowest.
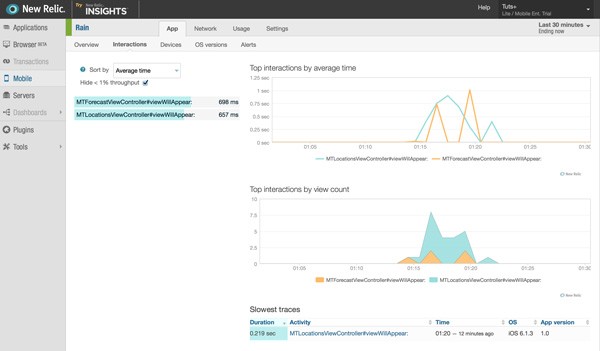
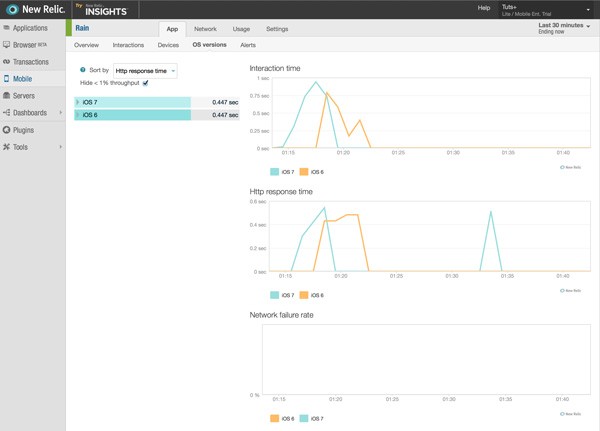
I've tested Rain on an old iPhone 3GS running iOS 6.1.3 and it shouldn't surprise you that New Relic effortlessly shows us that our application performs slow on this device and on iOS 6.
Of course, it is up to you to decide how you use the data New Relic collects for you. The iPhone 3GS was introduced in 2009 and iOS 7 has surpassed an 80% market share so it may not be worthwhile tweaking your application to improve performance on an iPhone 3GS running iOS 6. However, it's important to understand that this too is valuable information and it allows you to make appropriate decisions in terms of development and focus.
In addition to collecting data about application performance, New Relic also collects information about application usage, such as the number of active users, device information, etc. New Relic is much more than an application performance monitoring solution.
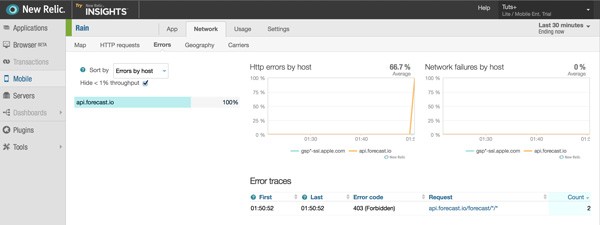
Network
New Relic is a great solution for monitoring the performance of network operations on mobile. It shows you exactly which requests your application makes, how long they take to complete, and if any errors pop up.

This may not seem useful if you're not running your own backend, but it does help decide which requests are sent at what moment to make your application snappier and more responsive. Developers often wrongly assume that nothing can be done if an application relies on a third party for its data. This simply isn't true and New Relic helps you avoid such problems.
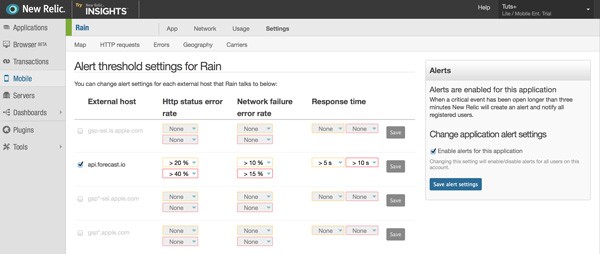
Alerts
Alerts are one of the most powerful and useful features of New Relic. In the Settings tab, you can set one or more custom alerts, which is especially useful if your application connects with a backend that you maintain and control.
In the next example, I've created an alert to notify me when requests to the Forecast API are becoming very slow, taking more than five seconds to complete.
Conclusion
As a developer, you always need to keep in mind that you don't know how your application is being used and under what circumstances. This implies that you cannot predict the behavior of your application for every user of your application.
New Relic is a valuable service for every iOS application that has some complexity to it. People download lots and lots of applications every day, which means they don't hesitate to ditch your application for the next best thing. It's therefore key to make sure your application performs well so your users are happy users. New Relic helps you with this.

Comments