
Welcome to the seventh tutorial in our series about Google DoubleClick for Publishers. DFP is a service that can seem incredibly complicated to the uninitiated, so our series has aimed to simplify it (while possibly annoying a few Google product managers for pointing out its numerous UX missteps).
In this tutorial, I'll guide you through Google DFP's Query and Reporting options, exploring the differences between queries and reports and the various ways to gather data about the performance of your web advertising.
For consistency, the DFP team has made these look as complicated and confusing as other parts of the DFP interface, but if you study them for a while, queries and reports become fairly simple to use.
If you're new to this series, please review our earlier episodes before continuing: Introduction to Google DFP Small Business, Beginning Ad Integration With Your Website, Placements, and Placing Orders.
I do try to participate in the discussions below. If you have a question or topic suggestion for a future episode, please post a comment below or contact me on Twitter @reifman.
How Do DFP Queries Differ From Reports?
Before I began writing about this topic, I wanted to see how Google describes the differences between queries and reports and immediately was confronted with yet another example of the complexity of the system, its terminology, and its sometimes redundant help system:

Essentially queries and reports are the same thing. However, when you want to run just a quick, one-off ad-hoc report, you can use the Reports menu. When you want to create something that will run repeatedly, it's not a Report that recurs (Dear Google UX team, that would be simpler), it's a query.
Also, the I'M DONE button seems to be both a button and a checkbox. This is odd. If we could get by without ad revenue, I'm sure a lot of us would check and click a button entitled "I'M DONE WITH DFP."
More amusingly, the description above isn't enough. There's actually a "full article about the difference between a query and a report" which takes you to a new page with just a few extra sentences for each (note to Google, JavaScript links are great for expanding small sections of content):

What's a Query?
Queries are like templates for reports. When you create a query, you essentially set up the criteria for a report to be run. When you run a query, the output is a report. Queries are recommended when you want to pull the same type of data again in the future, particularly when you select a rolling date range, for example, "Last 7 days".
To easily find the last report you've generated from a specific query, view the queries list page, and you'll see a column for "Most recent report run". Queries can be set up to run automatically on a schedule.
The benefits of queries include:
- You can use DFP's system queries, another poorly named term, to run traditional advertising reports without having to create your own query.
- Detailed filtering through the use of dimensions and metrics, performance breakouts by week, quarter, or month, as well as fixed date ranges and on demand editing.
- Preview queries to quickly see what your reports will look like without having to actually run them.
- Scheduling for recurrence.
- Sharing queries with others.
What's a Report?
Reports can be run ad hoc, without being generated from a saved query. If you run reports in this way, it could prove to be more useful when data is needed for one-time use, for example, troubleshooting. When you see the reports list page, the "Query" column displays the query that generated the report. For reports that were run ad hoc, this column shows blank.
Here are Google DFP's Report (and Query) types:
- Historical: View data on clicks, revenue, click-through rate, and total impressions for dates in the past.
- Future sell-through: View data on sell-through rate (STR) and forecasted, available, and reserved impressions for dates in the future.
- Reach: View the number of unique visitors exposed to different advertisers, orders, line items, or ad units in your network over a given time period.
- Business intelligence: View data on the revenue earned and impressions gained from the buyer or advertiser on both DFP and the Ad Exchange, as well as the aggregate revenue.
- Data protection: View data on cookies that are detected for each creative added to DFP, broken down by advertiser, order, line item, creative, and the specific technology vendor from which the cookie originated.
- Sales: Run reports for DFP sales management. DFP sales management must be enabled in your network to see this report type.
The Yield Report
At the top left of the DFP Reports menu, there is a Yield Report. You can generate this with two different approaches:
- Yield Type, showing either direct sales (standard or sponsorship), house or remnant inventory, or unfilled impressions.
- Aggregated Demand Channel, which shows you an aggregation of revenue by: Direct (includes revenue from all standard, sponsorship and click tracking line items), Google bidded (AdExchange/AdSense/AdMob line items), Third-party demand (includes all bulk, price priority and network line items) and Unfilled impressions.
Here's the Yield Type as one example over just a month:

And, here's an Aggregated Demand Channel report over two years:

Default Queries and Reports
The default System Queries are built into DFP and can be very helpful. Unfortunately, the description column is empty and wasted:

You can find the missing description fields for System Queries here.
When you hover over a query, DFP shows you more details about its configurable input options:

Here are a few obviously useful system queries:
- Currently running campaign report (all under an order) shows the performance of a specific client or house ads over time.
- Creatives report shows which ads (creatives) are performing well (and poorly).
- Monthly network performance report shows the performance of your entire account over the past month.
- Monthly ad unit report shows the performance of the locations (ad units) of ads across your site(s) in your network. This can show you which areas of your site perform best (or worst) with ads.
Before you create your own query from scratch, I recommend experimenting with running and editing one of these System Queries to your liking. Let's do this first.
Customizing a System Query
On the Queries page, click New Query. You can name the query and begin a broad array of open-ended configuration options for what you want. In this case, I wanted to create a Historical report for two years of my network's performance showing the basics: impressions, CPM, CPC, etc.

The report configuration is very detailed. Here are the report metrics you can choose:

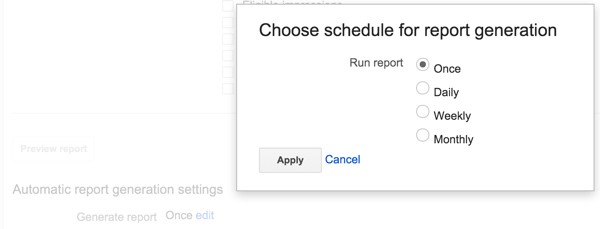
And the final area allows you to set up recurring reports. Click edit beside Generate Report:

And you can choose the frequency of recurrence and select an email address and report file format:
Here's my first view of the report, which I can save or export into various file formats:

Creating a Report From Scratch
If you want to create a report yourself, visit the Reports menu and click New Report. Then you can fully configure new reports with all of DFP's rich set of options:

For this I asked for a historical report over the last week showing lifetime clicks and impressions as well as CTR, CPM and CTC.

DFP allows you to Preview reports, which can be quite useful in seeing how your customization is coming together:

Report Generation and Automation
If you visit the Reports menu, you'll see a list of reports and when they were created. Recurring reports will appear here as well.
You can easily share reports with your colleagues by clicking the Share button on individual reports and providing an email address:

People who are not registered in DFP only receive an attachment of the report; they do not have access to the DFP user interface.
Exporting Reports
Google doesn't allow sorting within its reporting interface, saying, "Generally the idea is that most developers prefer the report in a basic format like CSV so they can import and manipulate it themselves as they wish."
It's pretty easy to export reports when you're creating them to send file exports on a report generation schedule, or to do it one time from the Reports list or Report results:

The file types and destinations for exported reports are as follows:
- CSV
- TSV
- Excel
- CSV
- XML
- XLS
- XLSX
- Google Drive
Here's what my report looked like in Google Drive:

In Closing
If you've been following along with the series, I hope you're beginning to feel more proficient with the basics of DFP. It's not easy to dive into. Queries and reports are also more complicated than they should be.
Its System Queries make reporting quite simple once you get to used to the user interface. The recurrence, sharing and export are quite powerful as well.
While I've noticed that the folks at Google have tried to improve their help and documentation, they really need to redesign a lot of the system and update their terminology. It's not helpful to have to repeatedly leave a web application and dig through long technical explanations.
What's Next?
As the series evolves, I'd love to hear more of your feedback about DFP topics you'd like me to explore. Please feel free to post your questions and comments below. You can also contact me on Twitter @reifman. To see other tutorials I've written, browse my Envato Tuts+ instructor page.
In the next episode, we'll explore selling directly to advertisers and placing their orders for your ad units and placements within Google DFP.
Related Links
-
Google DFP Website
-
Overview of Reporting (Google DFP Help)
- Google Publisher University School of DFP

Comments