In this tutorial I will give a basic introduction to pandas. Oh, I don't mean the animal panda, but a Python library!
As mentioned on the pandas website:
pandas is an open source, BSD-licensed library providing high-performance, easy-to-use data structures and data analysis tools for the Python programming language.
Thus, pandas is a data analysis library that has the data structures we need to cleanse raw data into a form which is suitable for analysis (i.e. tables). It is important to note here that since pandas performs important tasks such as aligning data for comparison and merging of data sets, handling of missing data, etc., it has become a de facto library for high-level data processing in Python (i.e. statistics). Well, pandas was originally designed to handle financial data, provided that the common alternative is using a spreadsheet (i.e. Microsoft Excel).
The basic data structure of pandas is called DataFrame, which is an ordered collection of columns with names and types, thus looking like a database table where a single row represents a single case (example) and columns represent particular attributes. It should be noted here that the elements in various columns may be of different types.
So, the bottom line is that the pandas library provides us with the data structures and functions necessary for data analysis.
Installing Pandas
Let's now see how we can install pandas on our machines and use it for data analysis. The easiest way to install pandas and avoid any dependency issues is by using Anaconda which pandas comes part of. As mentioned on the Anaconda download page:
Anaconda is a completely free Python distribution (including for commercial use and redistribution). It includes more than 400 of the most popular Python packages for science, math, engineering, and data analysis
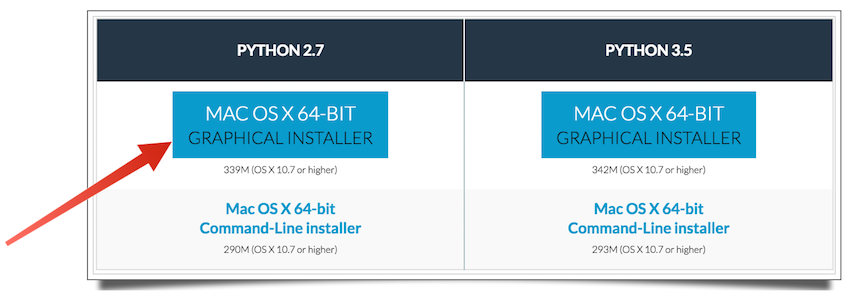
The Anaconda distribution is cross-platform, meaning that it can be installed on OS X, Windows, and Linux machines. I'm going to use the OS X installer since I'm working on a Mac OS X El Capitan machine, but of course you can choose the suitable installer for your operating system. I will go with the graphical installer (be careful, it is 339 MB).
After downloading the installer, simply walk through the simple installation wizard steps and you are all set!
All we need to do now in order to use pandas is to import the package as follows:
import pandas as pd
Pandas Data Structures
I have mentioned one of the three pandas data structures above, the DataFrame. I will describe this data structure in this section in addition to the other pandas data structure, Series. There is another data structure called Panel, but I will not describe it in this tutorial as it is not so frequently used, as mentioned in the documentation. DataFrame is a 2D data structure, Series is a 1D data structure, and Panel is a 3D and higher data structure.
DataFrame
The DataFrame is a tabular data structure which is composed of ordered columns and rows. To make things clearer, let's look at the example of creating a DataFrame (table) from a dictionary of lists. The following example shows a dictionary consisting of two keys, Name and Age, and their corresponding list of values.
import pandas as pd
import numpy as np

name_age = {'Name' : ['Ali', 'Bill', 'David', 'Hany', 'Ibtisam'],
'Age' : [32, 55, 20, 43, 30]}
data_frame = pd.DataFrame(name_age)
print data_frame
If you run the above script, you should get an output similar to the following:
_(1).png)
Notice that the DataFrame constructor orders the columns alphabetically. If you want to change the order of the columns, you can type the following under data_frame above:
data_frame_2 = pd.DataFrame(name_age, columns = ['Name', 'Age'])
To view the result, simply type: print data_frame_2.
Say you didn't want to use the default labels 0,1,2,..., and wanted to use a, b, c,... instead. In that case, you can use index in the above script as follows:
data_frame_2 = pd.DataFrame(name_age, columns = ['Name', 'Age'], index = ['a', 'b', 'c', 'd', 'e'])
That was very nice, wasn't it? Using DataFrame, we were able to see our data organized in a tabular form.
Series
Series is the second pandas data structure I'm going to talk about. A Series is a one-dimensional (1D) object similar to a column in the table. If we want to create a Series for a list of names, we can do the following:
series = pd.Series(['Ali', 'Bill', 'David', 'Hany', 'Ibtisam'],
index = [1, 2, 3, 4, 5])
print series
The output of this script would be as follows:
.png)
Notice that we used index to label the data. Otherwise, the default labels will start from 0,1,2...
Pandas Functions
In this section, I'm going to show you examples of some functions we can use with DataFrame and Series.
Head and Tail
The functions head() and tail() enable us to view a sample of our data, especially when we have a large number of entries. The default number of elements that get displayed are 5, but you can return the customized number you like.
Let's say we have a Series composed of 20,000 random items (numbers):
import pandas as pd
import numpy as np
series = pd.Series(np.random.randn(20000))
Using the head() and tail() methods to observe the first and last five items, respectively, we can do the following:
print series.head()
print series.tail()
The output of this script should be something similar to the following (notice that you might have different values since we are generating random values):
_(1).png)
Add
Let's take an example of the add() function, where we will attempt to add two data frames as follows:
import pandas as pd

dictionary_1 = {'A' : [5, 8, 10, 3, 9],
'B' : [6, 1, 4, 8, 7]}
dictionary_2 = {'A' : [4, 3, 7, 6, 1],
'B' : [9, 10, 10, 1, 2]}
data_frame_1 = pd.DataFrame(dictionary_1)
data_frame_2 = pd.DataFrame(dictionary_2)
data_frame_3 = data_frame_1.add(data_frame_2)
print data_frame_1
print data_frame_2
print data_frame_3
The output of the above script is:
_(2).png)
You can also perform this addition process by simply using the + operator: data_frame_3 = data_frame_1 + data_frame_2.
Describe
A very nice pandas function is describe(), which generates various summary statistics for our data. For the example in the last section, let's do the following:
print data_frame_3.describe()
The output of this operation will be:
_(1).png)
Further Resources
This was just a scratch of the surface on Python's pandas. For more details, you can check the pandas documentation, and you can also check some books like Learning Pandas and Mastering Pandas.
Conclusion
Scientists sometimes need to carry out some statistical operations and display some neat graphs that require them to use a programming language. But, at the same time, they don't want to spend too much time or be faced with a serious learning curve in carrying out such tasks.
As we saw in this tutorial, pandas enabled us to represent data in tabular form and carry out some operations on those tables in a very simple way. Combining pandas with other Python libraries, scientists can even do more advanced tasks such as drawing specialized graphs for their data.
Thus, pandas is a very helpful library and starting point for scientists, economists, statisticians, and anyone willing to perform some data analysis tasks.

Comments