SVG (Scalable Vector Graphics) is an image format which defines vector-based graphics in XML format. In this tutorial, you'll have a look at how to get started with using Pygal, a Python SVG graph-plotting library.
Getting Started
There are no dependencies for installing Pygal. It's available for Python 2.7+. Assuming that you have Python and pip installed on your system, install Pygal using pip.
pip install pygal
If you want to use the latest version of Pygal, take a look at the Pygal GitHub repository and clone it.
Creating a Bar Chart
Data visualization explains the information that we have in the form of charts or graphs. In this tutorial, you'll see how to create a bar chart using the Pygal library inside a Python Flask web application. Let's start by creating a simple flask web application. First, install flask if you don't already have it installed:
pip install flask
Create a file called app.py and add the following code:
from flask import Flask
app = Flask(__name__)

@app.route("/")
def home():
    return "Tutsplus : Welcome to PyGal Charting Library !! "

if __name__ == "__main__":
    app.run()
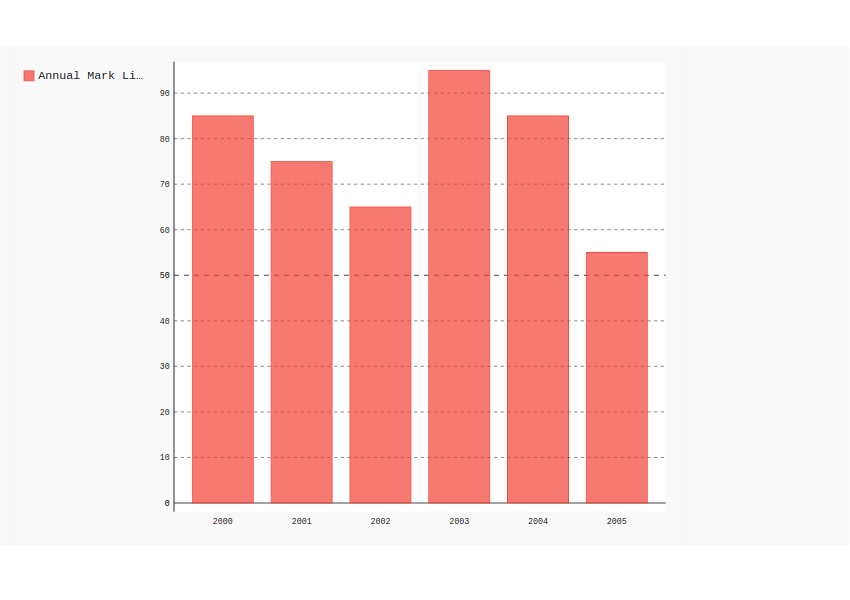
Assume that we have some data for an annual mark list for certain years. The data would be in JSON format. Here is a sample of the JSON data:
[{
    "year": 2000,
    "mark": 85
}, {
    "year": 2001,
    "mark": 75
}, {
    "year": 2002,
    "mark": 65
}, {
    "year": 2003,
    "mark": 95
}, {
    "year": 2004,
    "mark": 85
}, {
    "year": 2005,
    "mark": 55
}]
You'll be displaying Year along the X axis and the Mark along the Y axis. So let's get started by creating a new route for our Python application:
@app.route("/bar")
def bar():
    # Charting code will be here
You'll be loading data from a JSON file, so you'll need to import the json library along with the pygal library.
import pygal
import json
Read the JSON data by opening the file in read mode, and load the JSON data.
with open('bar.json','r') as bar_file:
    data = json.load(bar_file)
Create a Bar chart object from the pygal library.
chart = pygal.Bar()
Once you have the chart object, you need to set the X axis and Y axis. To add the marks on the Y axis, we'll read the marks as a list from the JSON data object.
mark_list = [x['mark'] for x in data]
Similarly, read the year from the JSON data object as a list.
[x['year'] for x in data]
Assign the X axis and Y axis data to the chart object.
chart.add('Annual Mark List',mark_list)
chart.x_labels = [x['year'] for x in data]
Now you need to render the bar chart SVG image to a file. In Python Flask, the static files are served in a folder called static, so create a folder called static inside the project directory. Inside the static folder, create a folder images. Add the following line of code to render the SVG image to a file.
chart.render_to_file('static/images/bar_chart.svg')
Create a template folder inside the project directory. Inside the template directory, create a file called app.html. Add the following HTML code to the app.html file:
<html>
<head>
     <title> Tutsplus - Pygal Charting Library</title>
</head>
<body>
     <h2> Tutsplus - Pygal Charting Library</h2>
     <div>
         <p>Bar Chart</p>
         <object type="image/svg+xml" data="{{image_url}}">
          Your browser does not support SVG
         </object>
     </div>
</body
</html>
You'll render our bar chart inside the app.html file. Finally, all you need to do is to render the template along with the image_url parameter, which will serve as the data for the element. Here is the full /bar route and method:
# -------------------------------------------
# Charting route which displays the bar chart
# -------------------------------------------

@app.route("/bar")
def bar():
    with open('bar.json','r') as bar_file:
        data = json.load(bar_file)
    chart = pygal.Bar()
    mark_list = [x['mark'] for x in data]
    chart.add('Annual Mark List',mark_list)
    chart.x_labels = [x['year'] for x in data]
    chart.render_to_file('static/images/bar_chart.svg')
    img_url = 'static/images/bar_chart.svg?cache=' + str(time.time())
    return render_template('app.html',image_url = img_url)
I have added a query string cache to the img_url to prevent the image getting loaded from the browser cache.
Save the above changes and try running the application:
python app.py
Point your browser to http://localhost:5000/bar and you should be able to view the bar chart based on the JSON data.
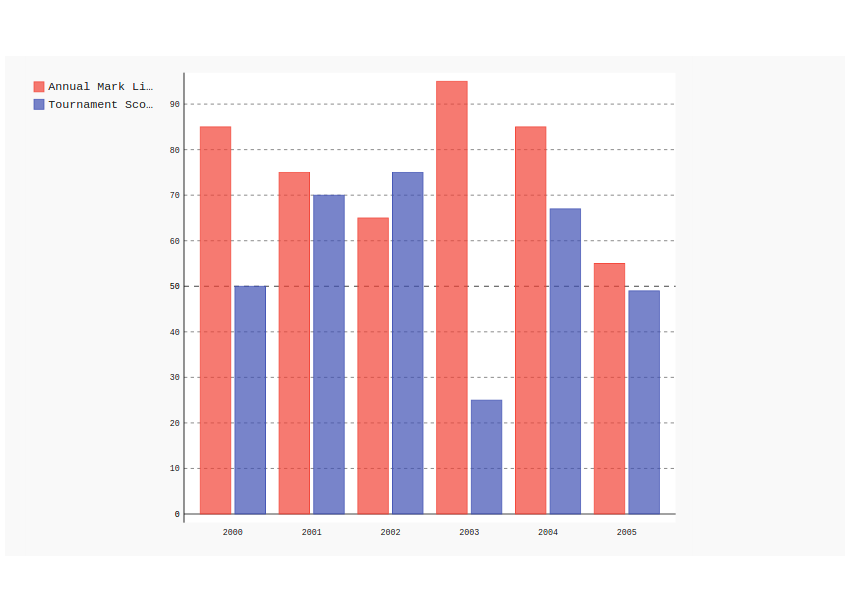
Multiple Bar Charts
You can also add multiple bars to the existing bar chart. Suppose you have the same JSON data with a few extra parameters that need to be represented. Here is an example:
[{
    "year": 2000,
    "mark": 85,
    "tournament": 50
}, {
    "year": 2001,
    "mark": 75,
    "tournament": 70
}, {
    "year": 2002,
    "mark": 65,
    "tournament": 75
}, {
    "year": 2003,
    "mark": 95,
    "tournament": 25
}, {
    "year": 2004,
    "mark": 85,
    "tournament": 67
}, {
    "year": 2005,
    "mark": 55,
    "tournament": 49
}]
To display a bar of the tournament data, you need to get a list of the tournament score and add it to the bar chart object.
tourn_list = [x['tournament'] for x in data]
chart.add('Tournament Score',tourn_list)
Save the above changes and restart the server. Point your browser to http://localhost:5000/bar and you should have the bar chart rendered.
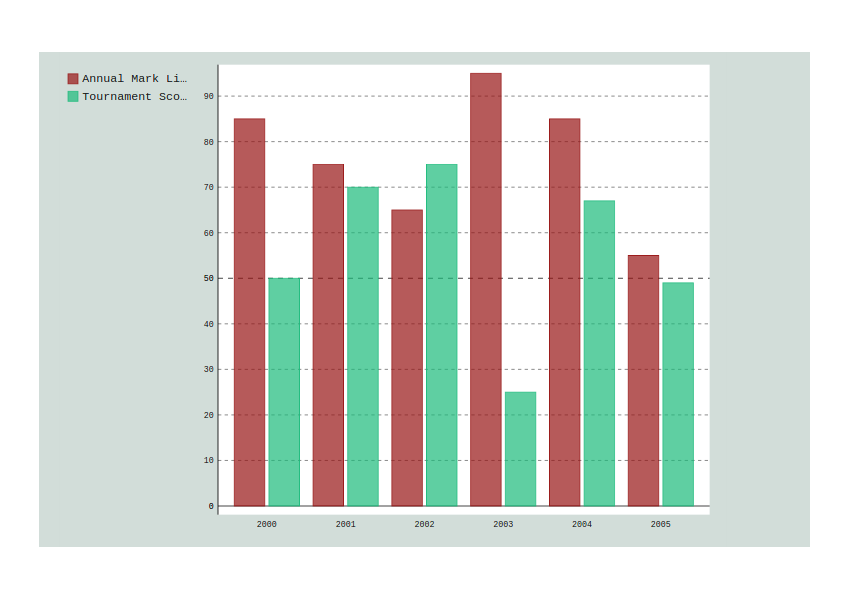
Adding a Custom Style
You can also add custom styles to bar charts. For example, to change the bar colors, you need to import the Pygal style.
from pygal.style import Style
Define the custom style as shown to specify colors for the bar and to specify a background color for the chart.
custom_style = Style(
        colors=('#991515','#1cbc7c'),
        background='#d2ddd9'
        )
Apply the custom style to the chart when creating the bar chart object.
chart = pygal.Bar(style = custom_style)
Save the above changes and restart the server. Point your browser to http://localhost:5000/bar and you should be able to view the bar chart with the custom style rendered on screen.
Wrapping It Up
In this tutorial, you saw how to get started with using Pygal, a Python SVG graph-plotting library. You learnt how to use Pygal to create a bar chart in a Python Flask application. You saw how to add multiple bars to the bar chart and to customize the bar chart style.
What you saw is just the tip of the iceberg, and you can do a lot more using Pygal. I would recommend reading the Pygal official documentation to get detailed information.
Additionally, don’t hesitate to see what we have available for sale and for study on Envato Market, and don't hesitate to ask any questions and provide your valuable feedback using the feed below.
Source code from this tutorial is available on GitHub.

Comments