Suppose you are viewing a column chart which displays yearly sales figures of your company, where each column represents one single year. If you click on a column, you go one level deep to see quarterly data. Now if you click once more, you arrive at monthly sales figures.
What you are doing here is drilling down from yearly to quarterly to monthly data using on a drill down chart. Drill-down charts allow you to click on individual data plots to reveal more details about it (a data plot refers to a column in column chart, lines in a line chart or pie slices in a pie chart).
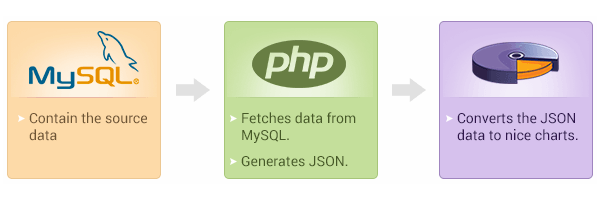
Drill down charts are very useful in business reports and analytics dashboards. And in this tutorial, I am going to cover the step-by-step process of creating a drill down chart using FusionCharts’ JavaScript chart library. We are going to fetch the data present in a MySQL database using PHP, and then use FusionCharts’ core library and its PHP charts wrapper to plot our chart.
Here’s what we are making today: (you can see live version here or download the source code using this link).
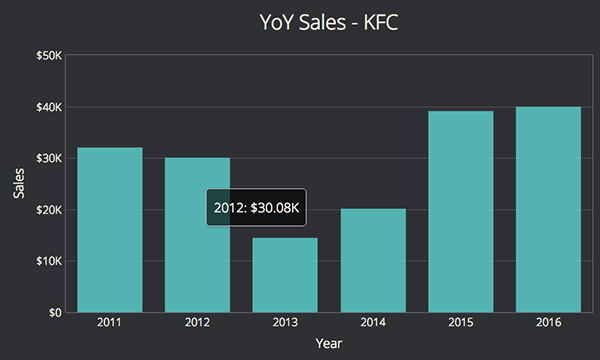
It is a 2D column chart with two level drill-down. First level contains yearly sales data for 6 years. If you click on any year, you will be able to view quarterly data for that particular year (second level).
I have divided the complete process into seven steps:
- 1: Including JavaScript files and PHP wrapper
- 2: Initiating & validating DB connection
- 3: Fetching data using SQL query
- 4: Converting the query result to JSON
- 5: Repeating steps -3 & 4 for each drill-down level
- 6: Creating chart instance and closing DB connection
1. Including JavaScript Files and PHP Wrapper
To render charts in this project, we need both FusionCharts’ core JS library and its PHP wrapper:
- FusionCharts’ JavaScript charts library -
fusioncharts.js- will be included using HTML<script>tag. -
PHP charts wrapper -
fusioncharts.php- will go inside PHP code.
Here is how our PHP and HTML code will look like after this step:
<?php // including FusionCharts PHP Wrapper include("/path/to/fusioncharts.php"); ?>
<head> <!-- FusionCharts JavaScript file --> <script type="text/javascript" src="/path/to/fusioncharts.js"></script> </head>
2. Initiating & Validating DB Connection
Once we have included all the dependencies, we need to initiate the connection with our database to fetch data for the chart.
Here is how we initiate and validate database connection in PHP:
<?php // initiating connection with database $hostdb="localhost"; // address of the DB server $userdb="db_username"; // your MySQL database username $passdb="db_password"; // your MySQL password $namedb="DB_name"; // database name // establish connection with the database $dbhandle = new mysqli($hostdb, $userdb, $passdb, $namedb); // validating DB Connection if ($dbhandle->connect_error) { exit("There was an error with your connection: " . $dbhandle->connect_error); } ?>
To establish the connection with MySQL database these four parameters should be specified:
- Address of the server where database is installed. In our case it is
localhost. - Username to connect to the database. Default value is
root. - Password for that username.
- Name of the database under which the table is created.
$dbhandle establishes connection with the database. I have included dummy values in above code snippet, and you will have to replace values for $hostdb, $userdb, $passdb, and $namedb with actual values for your database.
3. Fetching Data Using SQL Query
After the connection with MySQL database is successfully established, we can use below SQL query to fetch the data for our chart:
// SQL query for the parent chart $strQuery = "SELECT Year, Sales FROM yearly_sales"; //Execute the query, or else return the error message $result = $dbhandle->query($strQuery) or exit("Error code ({$dbhandle->errno}): {$dbhandle->error}");
If query ($strQuery) is executed successfully, data will be populated in $result.
4. Converting the Query Result to JSON
If you followed all the above steps properly till now, you should have fetched data from query in $result variable.
To form the JSON data in correct format, we will create an associative array - $arrData - and push all the chart configuration attributes and data in it as shown in the code below:
// if the query returns a valid response, preparing the JSON array. if ($result) { // `$arrData` holds the chart options and data. $arrData = array( "chart" => array( "caption" => "YoY Sales - KFC", "xAxisName"=> "Year", // other chart attributes ) ); // create an array for parent-chart $arrData["data"] = array(); // push data in array while ($row = mysqli_fetch_array($result)) { array_push($arrData["data"], array( "label" => $row["Year"], "value" => $row["Sales"], "link" => "newchart-json-" . $row["Year"] )); } }
This code contains the JSON data for the parent chart. The link attribute in JSON data refers to the next chart to be rendered, after clicking individual data plot. For a more detailed description, you can visit this official documentation page.
5. Repeating Steps-3 & 4 for Each Drill Down Level
To drill down to the next level, we have to fetch data again using the variable $resultQuarterly from the respective database table (quarterly_sales). This is similar to what we did in step 3. Code for the same is shown below:
$strQuarterly = "SELECT Quarter, Sales, Year FROM quarterly_sales WHERE 1"; $resultQuarterly = $dbhandle->query($strQuarterly) or exit("Error code ({$dbhandle->errno}): {$dbhandle->error}");
The associative array $arrData is appended with the child-chart data for each parent-data plot, but here the data comes under linkeddata . The code for this is shown below with related comments:
// linkeddata is responsible for feeding data and chart options to child charts. $arrData["linkeddata"] = array(); $i = 0; if ($resultQuarterly) { while ($row = mysqli_fetch_array($resultQuarterly)) { $year = $row['Year']; if (isset($arrData["linkeddata"][$i - 1]) && $arrData["linkeddata"][$i - 1]["id"] == $year) { array_push($arrData["linkeddata"][$i - 1]["linkedchart"]["data"], array( "label" => $row["Quarter"], "value" => $row["Sales"] )); } else { array_push($arrData["linkeddata"], array( "id" => "$year", "linkedchart" => array( "chart" => array( "caption" => "QoQ Sales - KFC for $year", "xAxisName" => "Quarter", "yAxisName" => "Sales", "paletteColors" => "#D5555C", "baseFont" => "Open Sans", "theme" => "elegant" ), "data" => array( array( "label" => $row["Quarter"], "value" => $row["Sales"] ) ) ) )); $i++; } } }
Now , we have our associative array ready with data in the variable $arrData and finally we encode the array into our JSON format using json_encode() method. The variable $jsonEncodedData holds the data for the chart having drill down feature.
$jsonEncodedData = json_encode($arrData);
6. Creating Chart Instance and Closing DB Connection
An HTML <div> is best suited as a container for our chart and here is how we declare it:
<div id="linked-chart">Awesome Chart on its way!</div>
As the next step, we will create chart instance and pass the chart type, its dimensions, container id and other details to it to render the chart. Here is the template for creating FusionCharts instance:
// Syntax for the instance - new FusionCharts("chart type", "chart id", "chart width", "chart height", "div id to render the chart", "type of data", "actual data")
Here is the code to create FusionCharts instance (using above template), render the chart and finally close the database connection:
// Creating FusionCharts Instance $columnChart = new FusionCharts("column2d", "myFirstChart" , 600, 300, "linked-chart", "json", "$jsonEncodedData"); //FusionCharts Render Method $columnChart->render(); //Render method //Closing Database Connection $dbhandle->close();
Making Your Charts Look Better
If you downloaded the source code for this project, then you must have noticed some parameters under chart array that we didn’t discuss above. Those parameters control looks and functionality of a chart and are formally referred to as chart attributes.
Here is some explanation on few key attributes I have used in my code:
-
canvasBgColorandbgColor: you can use these two attributes for controlling the background color of your chart’s canvas and its container. -
baseFont: you can use this attribute to set font family for your chart. You are not restricted to only system fonts, but are free to add any font. To use a custom font, include the source file for that font in HTML and set it usingbaseFontattribute. Our example uses Open Sans from Google Fonts. -
plotToolText: displaying additional information on hover is a great way to enhance data viz experience and this is whereplotToolTextcomes into picture. It allows you to customize the tooltip for the chart. You can use HTML -<div>and custom CSS to style your tooltip using this attribute. -
theme: this attribute helps you maintain a consistent design across all your charts. You can define a chart’s cosmetics in one file and include it usingthemeattribute to have a common design for all your charts. You can learn more about it on this theme manager documentation page.
There are hundreds of attributes that you can use to customize your chart and it is practically impossible to describe everything in this post. So above I have only listed few key ones, and for more information you can visit the chart attributes page for 2D column charts.
More Resources
I tried to cover everything in detail above, but you are bound to face challenges when you try to do it on your own or want to take this concept further. So to help you in your journey, here are some important resources:
- Documentation: to learn more about drill down charts and its implementation, please visit the official developer center page.
- PHP wrapper: if you want to know more about what is possible with FusionCharts’ wrapper, you can explore their PHP charts page. It contains many live examples with full code.
Feel free to post your questions/feedback/suggestions in the comment section below. Always happy to chat and help!

Comments