Google Chrome is one of the biggest players in the Web today. It's fast, reliable, packed full of features, and is extremely helpful, especially if you are a web developer. Chrome also allows the installation of third party extensions. We build these extensions with pure HTML, CSS and JavaScript. The team at Google does a wonderful job. In this article, we will see several handy tools, in Chrome, that help with our development processes.
Developing Responsive Web Applications
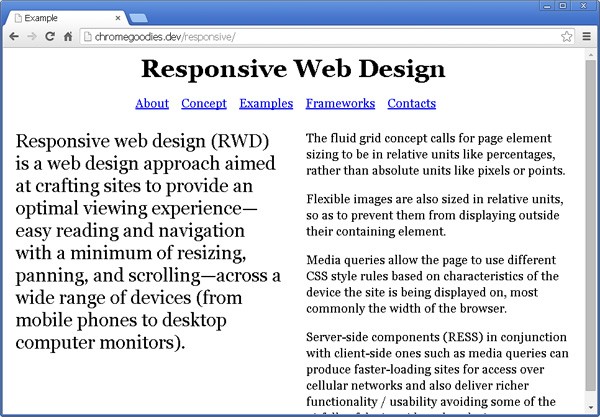
Nowadays responsiveness is everywhere. With the rise of mobile devices, we have to make our applications run on many different resolutions. The latest versions of Chrome contain wonderful instruments to make our work easier. Let's start by defining a simple page and continuing by making it responsive. Here is the HTML markup:
<body>
    <h1>Responsive Web Design</h1>
    <ul class="nav">
        <li><a href="#">About</a></li>
        <li><a href="#">Concept</a></li>
        <li><a href="#">Examples</a></li>
        <li><a href="#">Frameworks</a></li>
        <li><a href="#">Contacts</a></li>
    </ul>
    <section class="concept">
        <p>Responsive web design (RWD) is a web design approach ...
    </section>
    <section class="elements">
        </p>The fluid grid concept calls for page element sizing to be in relative units ...
    </section>
</body>
There is some basic styling on the page. The CSS rules, float the navigation's links and makes the two sections positioned next to each other. The result looks like this:
Now, having the HTML and the basic CSS in place, we can start experimenting. Let's place our media queries' breakpoints. It's important to choose them based on the content and where that content starts looking bad. Setting resolutions like 1024x768, just because it is popular, is not a good practice.
Setting the Viewport
Our content breaks and we want to see the exact size of the viewport. So we have to resize the browser's window. Under Chrome, we are able to open the developer tools panel and increase its size in there.
Notice that while we are changing the viewport's size, we see its size in the upper right corner. This little tooltip eliminates the need of a manual size check. In our case, both sections below the navigation became too squashed, around 500px. So, that's the place for our first media query:
section {
    float: left;
    width: 50%;
}
@media all and (max-width: 550px) {
    section {
        float: none;
        width: 100%;
    }
}
If we go a little bit below 550px, we will see that the navigation causes a horizontal scroll around 540px. A new media query definition solves that problem.
.nav {
    list-style: none;
    margin: 10px auto;
    padding: 0;
    width: 510px;
}
.nav li {
    float: left;
    margin: 0 20px 0 0;
}
@media all and (max-width: 540px) {
    .nav {
        width: auto;
    }
    .nav li {
        float: none;
        margin: 0;
        padding: 0;
        text-align: center;
    }
}
The result is a web page that works on a wide range of screens. Yes, our page is a simple one and has only two breakpoints, but the process of choosing them will be the same, even if we have a giant website.
Device Simulation
Often we receive bug reports that our application is not working properly on some specific device. Chrome can simulate various devices, to help solve this problem. It sets the exact screen resolution and defines the right HTTP headers. So, we are able to get a close view of what the real user sees. The JavaScript browser detection will work too because the browser modifies the request headers.
Let's say that we need to simulate an iPhone5 device. There is a small button that opens the drawer panel and then there is an Emulation tab.
We choose the device and Chrome applies all the settings in Screen, User agent and Sensors sections. The browser even emulates touch events.
Making Modifications With the Elements Panel
Our page is now responsive, but at some point we have to make modifications. Again, we are able to use Chrome as a tool and see what styles are applied to the document. For example, the text in the first section is too big. We want to change that and set a new color.
The Elements panel is also helpful if we need to see specific CSS rule, but we don't know where the definition of that rule is. There is a section on the right side, that shows the computed styles applied to the currently selected element and then we can modify it.
Developers Tools Panel
And then lastly, sometimes we need to search for certain CSS styles, but it is difficult to find them because there are a lot of definitions. In the developers tools panel, we have a nice filter field. Let's say that we want to access the rules for our <section> tag that has the concept class applied, here's how we could do that:
Debugging JavaScript
Google Chrome is a universal tool. It has instruments for supporting designers like we did in the last section of this tutorial. But it can do the same for the developers, as we will see now.
Integrated JS Debugging
There is a nice JavaScript debugger, integrated within Chrome. There's also a wonderful console and source viewer. To illustrate how everything works, we will add a little logic to our example. We want to change the label Examples in the main menu to Awesome examples when we click on the link. We will use jQuery as a helper, so we can focus on the example better:
$('.nav').on('click', function(e) {
    var clicked = e.currentTarget;
    if(clicked.innerHTML === 'Examples') {
        clicked.innerHTML = 'Awesome examples';
    } else {
        console.log('do nothing ...');
    }
});
You probably already know the problem, but let's see how the above code works.
No matter what we click we get do nothing ... in the console. So, it looks like our if clause is always false. Let's set a breakpoint to see what's going on.
The debugger stops at our breakpoint and shows us the local defined variables. The variable clicked, points to the navigation element and not to the <a> element. So, its innerHTML property is definitely not Examples. That's why we got do nothing ... every time. To fix the bug, we could simply use .nav a instead of just .nav.
Above is the traditional approach that works if we know where exactly to set the breakpoint. But if we work with a large code base and especially if we have to debug the concatenated file, it gets a little bit problematic. We start placing console.log here and there and check the console. It will work, but soon we will have a lot of data, it will be difficult to filter the data and find the needed information. Chrome has a solution for that problem too. We could style the output in the console by adding %c in front of the text, passed to the .log method. After that, attach a second parameter containing our styles. For example:
There is something else that we could add. The console object has two, not so popular methods - group and groupEnd. They give us the ability to group our logs.
Using Deb.js
There is also a library that combines both the styling and grouping of the output, Deb.js. The only thing that we have to do, is to include it in our page before the other scripts and attach .deb() at the end of the function that we want to inspect. There is also .debc() version that sends collapsed groups to the console.
With this library, we can get the arguments passed to the function, its stack trace return value and execution time. As we mentioned above, the messages are nicely grouped and nested into each other, so it is much easier to follow the application's flow.
Terminal in the Browser
One of the killer features of Google's browser, is the extension's ecosystem. There's a way for us to write installable programs that run in the browser and there are dozens of helpful APIs that we can use. The most important thing though, is that we don't have to learn a new language. The technologies that we'll use, are the usual HTML, CSS and JavaScript. Checkout the following introduction to Chrome's extension development.
Yez!
There's even a separate section in the Chrome's web store called Web development. It contains useful instruments made specifically for us - developers. There is one called Yez!. It brings terminal like functionalities into the Developer Tools panel. We are able to execute shell commands and get their output in real time.
The extension itself is not enough to perform shell commands. That's because we don't have access to the operating system. That's why there is a Node.js module that acts as a proxy. Yez! connects to the running Node.js app via web sockets. We could install the module via the Node.js package manager using npm install -g yez.
Yez! Git Integration
Yez! also has nice Git integration and it shows us the branch in the current directory. We are able to execute terminal commands and get their output immediately.
The extension was originally developed as a task runner. So it has an interface for task definitions. In fact, that's just a series of shell commands run after each other. We are achieving the same results by creating shell scripts.
We can also see the terminal's output in real time. So the extension is suitable for developing Node.js applications. Normally we have to restart the Node.js process, but now, everything is visible inside Chrome.
Performing HTTP Requests
As web developers, it often happens that we have to perform HTTP request to our applications. Maybe we developed a REST API, or we have a PHP script that accepts POST parameters. There is a command line tool available called cURL. It's probably the most widely used instrument for querying the web.
With cURL, we don't have to jump to the terminal. There is DHC (REST HTTP API Client) available. It's an extension that gives us full control of the HTTP request. We could change the request method, the headers, or the GET and POST parameters. It also displays the result of the request, with its headers. A very useful instrument.
Testing With Chrome's Web Driver
We all know the importance of testing. It is extremely important for us to know that our programs behave properly. Sometimes, the writing of tests can be challenging. Especially if we need to test the user interface. Thankfully, there is a Node.js module that controls our browser (Chrome) and triggers actions like visiting a page, clicking on a link or filling in a form. It's called DalekJS. It's easily installable by running:
npm install -g dalek-cli
Let's make a short experiment and see how everything works. In a newly created directory, we need a package.json file with the following content:
{
  "name": "project",
  "description": "description",
  "version": "0.0.1",
  "devDependencies": {
    "dalekjs": "0.0.8",
    "dalek-browser-chrome": "0.0.10"
  }
}
After running npm install in the same directory, we will get dalekjs and dalek-browser-chrome installed into a node_modules folder. We will place our test inside a file called test.js. Let's save it in the same folder. Here is a short script that tests the search functionality of GitHub:
var url = 'https://github.com/';
module.exports = {
    'should perform search in GitHub': function (test) {
        test
        .open(url)
        .type('#js-command-bar-field', 'dalek')
        .submit('#top_search_form')
        .assert.text('.repolist h3 a', 'dalekjs/dalek', 'There is a link with label dalekjs')
        .click('[href="/dalekjs/dalek"]')
        .assert.text('.repository-description p', 'DalekJS Base framework', 'It is the right repository')
        .done()
    }
};
To run the test, we have to fire dalek ./test.js -b chrome in our console. The result is that DalekJS launches an instance of the Google Chrome browser. It then opens GitHub's site, at which point you can type dalek in the search field and it goes to the correct repository. In the end, Node.js simply closes the opened window. The output in the console looks like this:
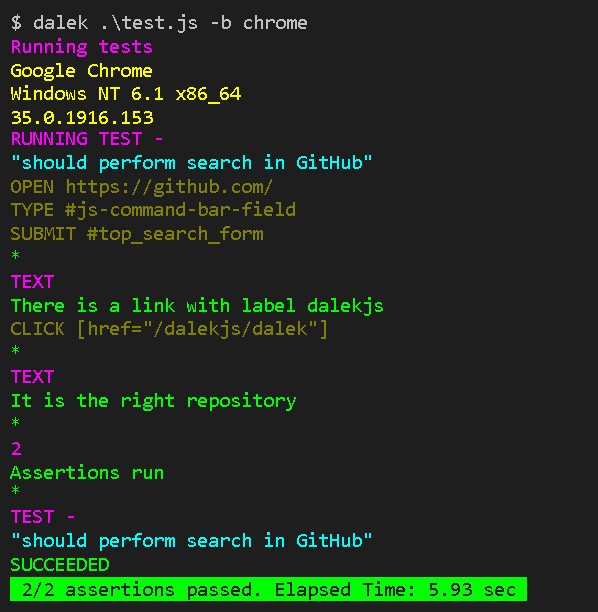
DalekJS supports PhantomJS, Firefox, InternetExplorer and Safari. It's a useful tool, and it works on Windows, Linux and Mac. The documentation is available at the official page dalekjs.com
Summary
When we are in front of our computer, we spend most of that time in the browser. It's good to know that Google Chrome is not only a program for browsing the Web, but it's also a powerful instrument for web development.
Now, there are tons of useful extensions and a constantly growing community, so I urge you to try Google Chrome, if you aren't already using it for your next web app.

Comments