Introduction
No matter how innovative and useful your Android app is, if it’s laggy, prone to freezing, or hogs memory, no one is going to want to use it.
Performance is very important, but it’s also something that’s easy to forget about when you’re busy putting the finishing touches to your beautiful user interface or coming up with new and exciting features for your app.
That is, until the negative Google Play reviews start rolling in.
In this article, you’ll get a crash course in the common performance problems every Android developer needs to be aware of. You’ll learn how to test whether these problems are occurring in your own projects, using the tools provided by the Android SDK—plus one tool that’s already installed on your Android device.
If you do discover a performance problem in your app, obviously you’ll want to fix it. So along the way we’ll also look at how to use the Android SDK tools to gather more information about whatever performance problems you uncover. Once you have this information, you’ll have a better understanding of how to perfect your app’s performance and ultimately create an app that people will love using.
1. Overdraw
Step 1: The Problem
Your app’s user interface is your connection to the user, but creating something that looks nice is only half the battle. You also need to ensure your user interface renders quickly and runs smoothly.
One of the most common causes of a laggy, unresponsive user interface is overdraw. Overdraw is where you waste GPU processing time by coloring in pixels that only get colored in again by something else.
For example, imagine a blue background with some text across it. Android doesn’t just paint the areas of blue that are visible to the user, it paints the entire blue background and then draws the text on top. This means that some pixels are colored in twice, which is overdraw.
Some overdraw, as in the example above, is inevitable. Too much overdraw, however, can have a noticeable impact on your app’s performance so you’ll want to minimize overdraw wherever possible.
It’s relatively easy to check your app for overdraw. Large amounts of overdraw can indicate an underlying problem with your app’s user interface, such as redundant views—more on that later. For these reasons, when you’re testing your app for performance problems, overdraw is a sensible place to start.
Step 2: Detecting Overdraw
The good news is that your Android device already has a built-in feature that lets you check the amount of overdraw in any app installed on your device.
Since this feature lives on your device, the first step is installing the app you want to test on your Android device. Then, to check the amount of overdraw, simply open your device’s Settings, select Developer Options, and tap Debug GPU Overdraw followed by Show overdraw areas.
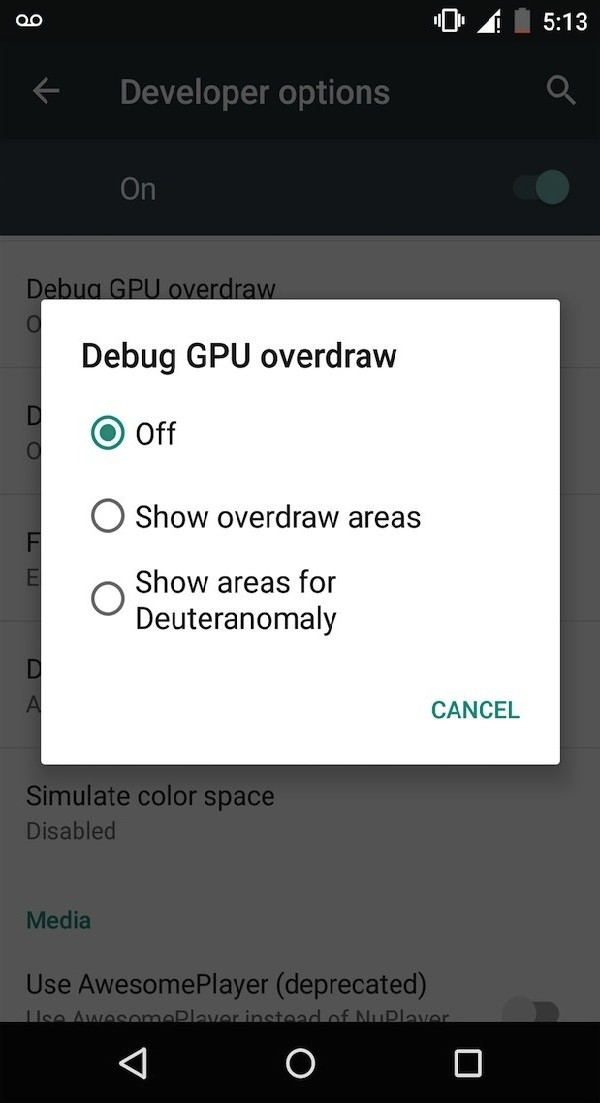
This tool uses blocks of color to highlight the different amounts of overdraw. The only thing left to do is launch the app you want to test and see what the overdraw situation is.
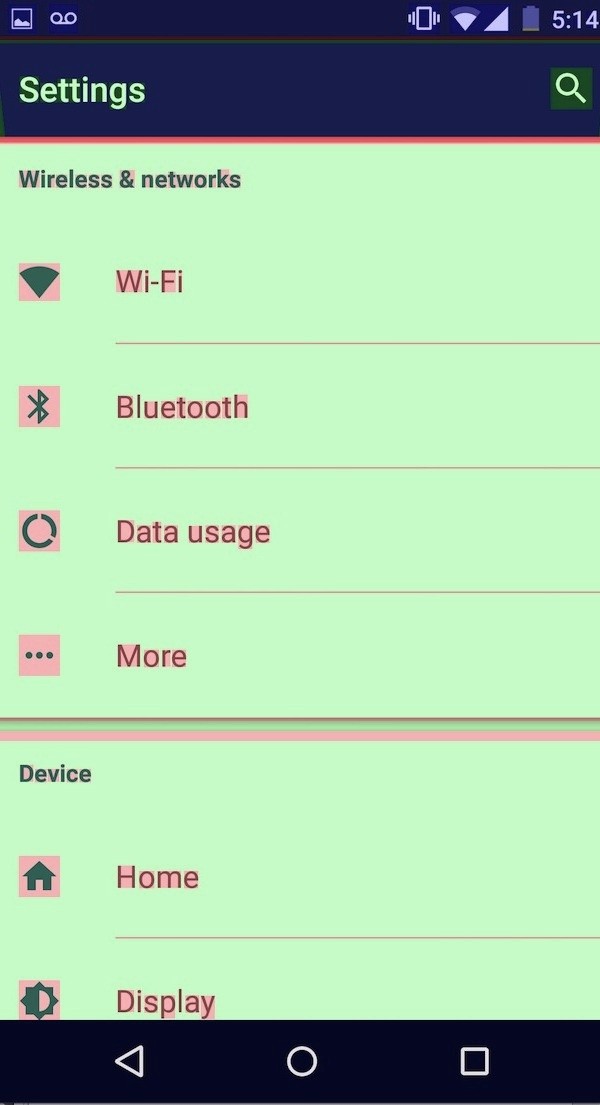
- No Color: No overdraw. This means the pixel was only painted once.
- Blue: An overdraw of 1x. The pixel was painted twice.
- Green. An overdraw of 2x. This pixel was painted three times. As a general rule, you should aim for a maximum overdraw of 2x.
- Light red: An overdraw of 3x. Depending on your app, small areas of light red may be unavoidable, but if you see medium or large areas of red then you should investigate what’s causing so much overdraw.
- Dark red: An overdraw of 4x. This pixel was painted 5 times, or possibly even more. You’ll definitely want to find out what’s causing any dark red areas.
Step 3: Minimizing Overdraw
Once you’ve identified an area of significant overdraw, the easiest way to reduce this overdraw is to open your app’s XML files and look for any areas of overlap, particularly any drawables that aren’t visible to the user, and any backgrounds that are being drawn on top of one another.
You should also look for areas where the background attribute is set to white, even though a parent has already painted a white background. All of these things can cause significant overdraw.
The Android system can automatically reduce simple cases of overdraw, but it’s worth noting that this doesn’t extend to complex custom views where Android doesn’t have an insight into how you’re drawing your content.
If you’re using complex custom views in your app, then you can define the drawable boundaries for your views using the clipRect method. For more information, I recommend visiting the official Android documentation.
2. Android Rendering Pipeline
Step 1: The Problem
Another common cause of performance problems, is your app’s view hierarchy. To render each view, Android goes through three stages:
- measure
- layout
- draw
The time it takes Android to complete these stages is proportional to the number of views in your hierarchy. This means that one of the easiest ways to reduce your app’s rendering speed is to identify and remove any views that don’t contribute to the final image the user sees on their device.
Even if all the views in your hierarchy are necessary, the way these views are arranged can have a significant impact on the measure phase of the rendering process. Generally speaking, the deeper your view hierarchy, the longer it takes to complete the measurement phase.
During the rendering process, each view provides its dimensions to the parent view. If the parent view discovers an issue with any of these dimensions, it can force every child to remeasure.
Remeasurements may even occur when there isn’t an error. For example, relative layouts often have to measure their children twice to get everything to fit. Linear layouts with children that use the layout_weight parameter routinely measure each child twice.
Depending on how your views are arranged, measurements and remeasurements can be a costly, time-consuming process that has a noticeable impact on your app’s rendering speed.
The key to ensuring your user interface renders quickly and smoothly, is to remove any unnecessary views and look for opportunities to flatten your layout.
The Android SDK includes a tool, Hierarchy Viewer, that lets you visualize your entire view hierarchy. This tool helps you spot both redundant views and nested layouts.
Step 2: Using Hierarchy Viewer
Before we take a closer look at the Hierarchy Viewer tool, there’s a few quirks you need to be aware of. Firstly, Hierarchy Viewer can only communicate with a running app, not your application’s source code. This means you’ll need to install the app you want to test either on your Android device or use an emulator.
There’s another, bigger catch though. By default, Hierarchy Viewer can only communicate with a device that’s running a development version of the Android operating system. If you don’t have a developer device, you can get around this restriction by adding the ViewServer class to your application.
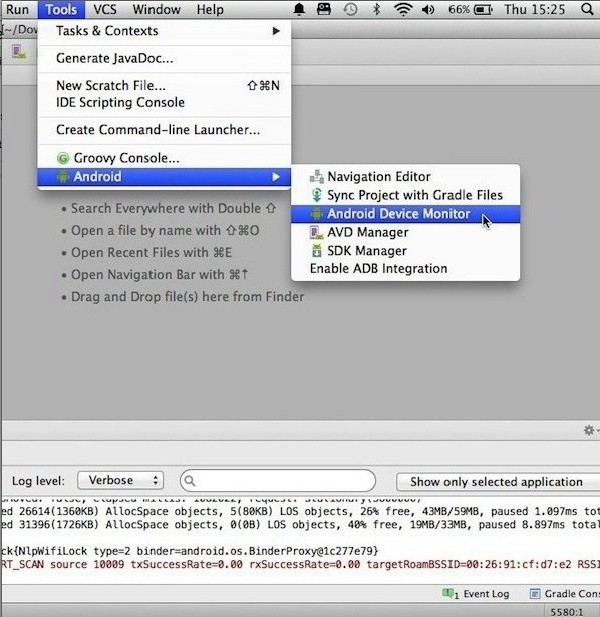
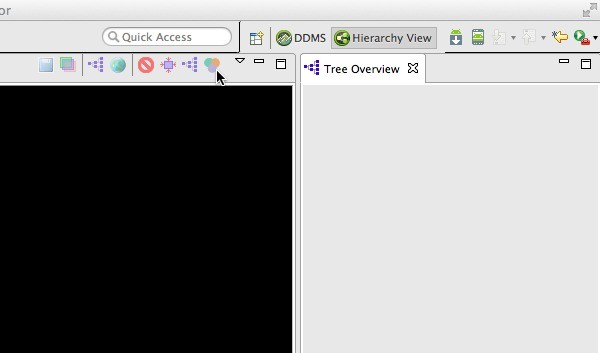
Once you’re ready to take Hierarchy Viewer for a spin, launch Android Studio and select Tools from the toolbar, followed by Android and Android Device Monitor.
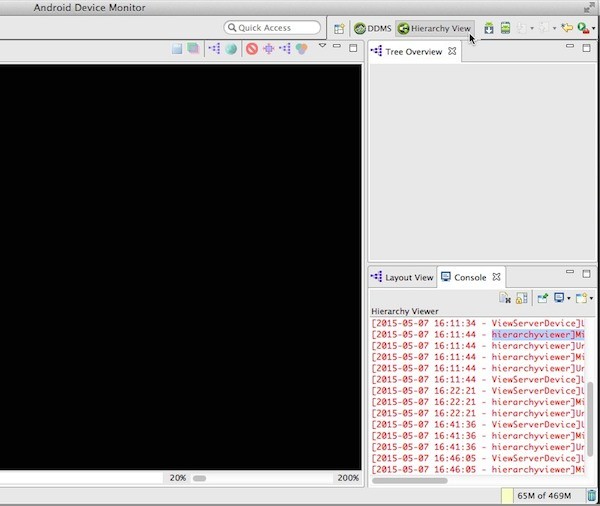
Click the Hierarchy View button on the right as shown in the screenshot below.
Along the left side of the screen is a Windows tab that lists all the detected Android devices and emulators. Select your device and you’ll see a list of the processes running on that device. Select the process you want to take a closer look at and three areas of Hierarchy Viewer will update automatically.
These three windows provide three different visual representations of the view hierarchy:
- Tree View: A bird’s eye view of your view hierarchy, where each node represents a single view.
- Tree Overview: A map representation of your view hierarchy. This view is particularly useful for identifying opportunities to flatten your layout.
- Layout View: A block representation of your view hierarchy.
These three windows are linked. If you select a view in one window, it’ll appear highlighted in the other two. You can use all three windows simultaneously to hunt down any redundant views lurking in the view hierarchy.

If you’re unsure whether a view is really contributing anything to the final image, simply go to Tree View and click the node in question. You’ll see a preview of how this view will appear on-screen so you can see exactly what this view is contributing to your app.
But just because a view is contributing something to the final rendered image doesn’t mean it isn’t also contributing to a big performance problem. You’ve already seen how you can use Hierarchy Viewer to spot obvious nested layouts, but what if this performance-sapping nesting isn’t so obvious? Or what if something else is causing a view to render slowly?
The good news is that you can also use Hierarchy Viewer to profile how long it takes each view to move through the different phases of the rendering process. This gives you a way to zero in on rendering problems that may not be obvious at first glance.
The next section shows you how to use Hierarchy Viewer to profile the different views in your layout to spot any rendering problems that may be lurking beneath the surface.
Step 3: Per-Node Profiling
The easiest way to identify bottlenecks in your user interface is by gathering data about how long it takes each of your views to complete the measure, layout, and draw phases of the rendering process.
Not only can you use Hierarchy Viewer to gather this information, Hierarchy Viewer also displays this data in an easy-to-understand, visual way so you can see at a glance which views are not performing well.
Hierarchy Viewer doesn’t display render times by default. You can add this information by going to Tree View and selecting the root node of the part of the tree you want to test. Next, invoke Hierarchy Viewer’s profiling feature by clicking the green, red, and purple Venn diagram icon as shown in the screenshot below.
Three colored dots will appear on every node in this part of the hierarchy. Left-to-right, these dots represent:
- the time it takes to measure the view
- the time it takes to layout the view
- the time it takes to draw the view
Each dot also has an assigned color:
- Green: For this part of the render time, this view is faster than at least half of the profiled nodes. For example, a green dot in the Layout position means this view has a faster layout time than at least 50% of the profiled nodes.
- Yellow: For this part of the render time, this view is in the slowest 50% of all the profiled nodes.
- Red: For this part of the render time, this view is the slowest out of all the profiled nodes.
After collecting this data, not only will you know the views you need to optimize, but you’ll know exactly which part of the rendering process is causing that view to render more slowly.
Just be aware that although views with yellow and red dots may be the logical place to start your optimization efforts, these performance indicators are relative to the other profiled nodes in the view hierarchy. In other words, you’re always going to have some views that render more slowly than others.
Before you start scouring your code for ways to optimize a particular view, ask yourself whether this view has a good reason to render more slowly than the other profiled nodes or whether this really is an opportunity to cut down on your app’s rendering time.
3. Memory Leaks
Step 1: The Problem
Although Android is a memory managed environment, don’t let this lull you into a false sense of security—memory leaks can still happen. This is because garbage collection (GC) can only remove objects that it recognizes as unreachable. If it doesn’t spot an unreachable object, then that object isn’t going to get garbage collected.
These unreachable objects hang around, polluting your heap, and taking up valuable space. As your app continues to leak objects, the amount of usable space gets smaller and smaller, which in turn triggers more frequent and longer GC events.
This is bad news for two reasons. Firstly, while GC events normally don’t have a noticeable impact on your app’s performance, lots of GC events occurring in a small space of time can result in a laggy, unresponsive user interface. The second problem is that mobile devices tend to be short on memory to begin with, so a memory leak can quickly escalate into an OutOfMemoryError, crashing your app.
Memory leaks can be difficult to detect. You may only realize that memory is an issue for your app when your users start complaining. Thankfully, the Android SDK has some useful tools that you can use to scour your app for those sometimes subtle signs of memory leaks.
Step 2: Memory Monitor
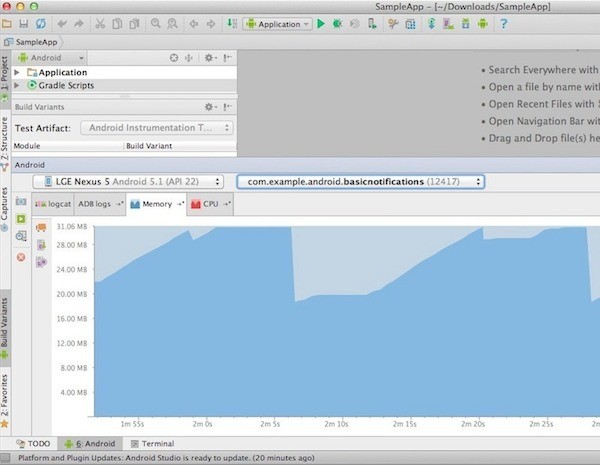
Memory Monitor is an easy way to get an overview of your app’s memory usage over time. Note that this tool can only connect to a running app, so make sure the app you want to test is installed on your Android device and that your device is attached to your computer.
This tool is built into Android Studio, so you access it by clicking the Memory tab towards the bottom of your IDE. As soon as Memory Monitor detects your running application, it starts recording your app’s memory usage.
If Memory Monitor doesn’t start recording, double-check that your device is selected in the devices drop-down menu.
If Memory Monitor is returning a No debuggable applications message, open Android Studio’s Tools menu, select Android, and make sure Enable adb integration is selected. This feature can be temperamental, so you may need to toggle Enable adb integration on and off a couple of times. It may also help to remove your Android device and then reconnect it.
Once Memory Monitor has detected your running application, it’ll display the amount of memory your app is using in dark blue and the unallocated memory in light blue.
Spend some time interacting with your device while keeping an eye on how your app’s memory usage changes in Memory Monitor. Eventually, the allocated memory will grow until there’s no free memory left. At this point, the system will free up memory by triggering a GC event. Whenever you see a significant drop in allocated memory, this is a sign that a GC event has occurred.
GC events are perfectly normal, but be concerned if you see your app allocating lots of memory in a short period of time or GC events becoming more frequent. These are both telltale signs that a memory leak is occurring in your app.
If you use Memory Monitor to track a suspected memory leak over a significant period of time, you may see the Android system compensate for your app’s growing memory demands by granting your app a higher memory ceiling, at which point the cycle begins again.
Eventually, you may even see your app consuming so much memory that the system can no longer make any more memory available to your app. If you see this happening, then there’s something seriously wrong with the way your app is using memory.
Step 3: Android Device Monitor
Another tool that can help you gather more information about memory leaks and other memory-related problems is the Android Device Monitor’s Heap tab.
The Heap tab can help you diagnose memory leaks by displaying how much memory the system has allocated your app. As already mentioned, if the allocated memory keeps increasing, then this is a strong indication that your app has a memory leak.
But this tool also provides lots of data about your app’s heap usage, including the kind of objects your app is allocating, the number of allocated objects, and how much space these objects are taking up. This extra information can be invaluable when you’re tracking down the source of memory leaks and other memory-related problems in your app.
To access this tool, launch Android Device Monitor and select the DDMS tab. In the Devices panel, select your device and the process you want to examine. Then, select the Heap tab, as shown in the screenshot below, and spend some time interacting with your app.
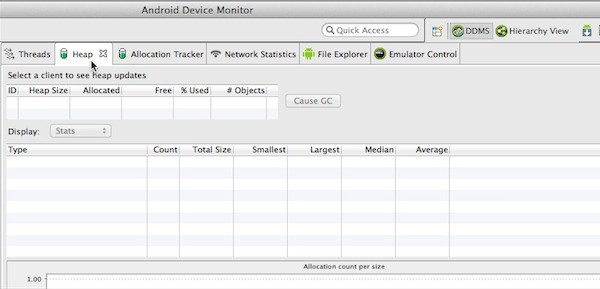
The heap output is only displayed after a GC event, so to populate this tab with data you’ll either have to wait for a GC event to occur naturally or you can force a GC by clicking the Cause GC button.
Once a GC event has occurred, the Heap tab will update with lots of information about your app’s heap usage. This data will refresh after each GC event.
Conclusion
In this tutorial, we’ve covered some of the most common performance problems you need to be aware of when developing Android apps, overdraw, memory leaks, and slow user interface rendering.
You’ve also got to grips with some of the tools you can use to check whether these problems are occurring in your own Android projects, and have seen how to gather more information about whatever performance problems are occurring in your own apps. The more information you have, the better chance you have of tracking down the cause of the problem and fixing it.
The Android SDK has lots more tools that can help you diagnose and address performance problems. If you want to learn more, then the official Android documentation pages on Traceview and dmtracedump and Allocation Tracker contain more information.

Comments