Debugging PHP with a text editor and some combination of echo, print_r and exit calls is sufficient when dealing with simple code. However, when your killer WordPress plugin grows to several thousand lines spanning multiple files, that method will quickly grow tiresome and error-prone. When you hit that point, it will be time to graduate to a remote debugger so you can quickly and easily step through every line of code to pinpoint issues.
A remote debugger is a program installed on the server side which intercepts all running PHP code. Among other features, it has the capability to stop running code mid-execution and pass information to an external client, such as an Integrated Development Environment (IDE). This tutorial will cover how to use the xdebug remote debugger and open source Eclipse IDE together to step through WordPress code to troubleshoot errors.
Step 1 Set Up Your Development Environment
I'm assuming you already have Apache/PHP/MySQL and a functioning WordPress installation running on your local workstation. If not, read over our tutorial on how to set up a WordPress development environment for Windows.
Install Xdebug
The most up-to-date instructions can be found on the xdebug website.
If you're on Windows using XAMPP for development, the xdebug binary is already included and you can move on to configuring PHP.
If you're on Mac OS X, I'd recommend compiling from source or using PECL to install.
If you're on Linux, you may be able to install using your distribution's package manager, or you can compile from source/use PECL.
Configure PHP to Load Xdebug
You will need to add these two lines to your php.ini file (which may live at /etc/php.ini or c:\xampp\php\php.ini or somewhere else depending on your platform):
zend_extension="/absolute/path/to/xdebug.so"
xdebug.remote_enable = 1
Once that's done, restart your Apache server. There are many other options you can configure later that are explained in the xdebug documentation, but that should be enough to get you started.
Verify Xdebug
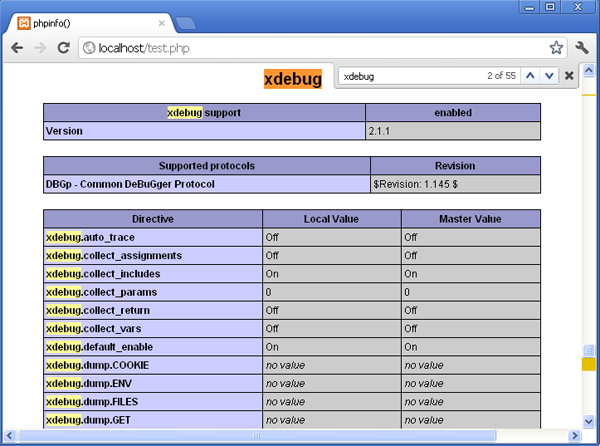
Create a page called test.php in your web root folder, and add a call to the phpinfo() function:
<?php phpinfo(); ?>
Search for xdebug, and you should find a section at the bottom of the page which looks like this:
Install Eclipse and PDT
Download Eclipse Classic from the Eclipse download page, unzip, copy it to your applications directory, then launch.
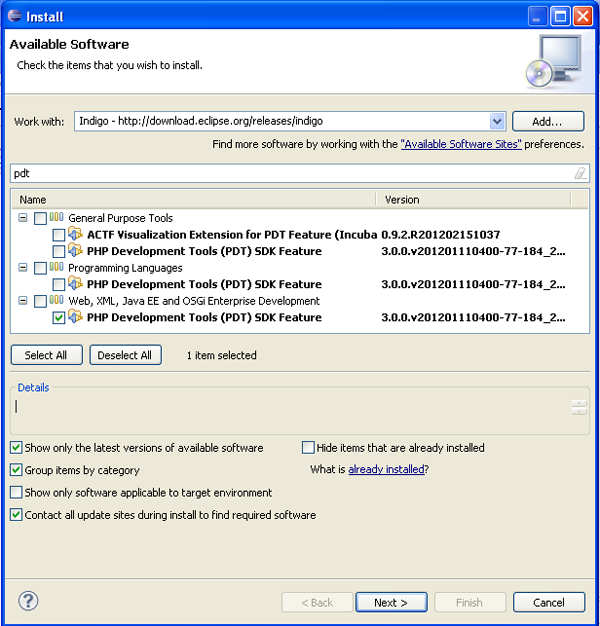
Click the Help menu, then Install Software. Under the "Work With" option, select the "Indigo" site. Check one of the "PHP Development Tools (PDT) Feature" checkboxes, then click "Next."
Click through the remaining steps of the wizard to finish the install, then restart Eclipse when prompted.
Set Up Eclipse to Listen for Xdebug
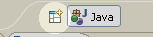
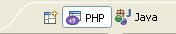
Enable the PHP perspective by clicking the Open Perspective button in the upper-right corner:
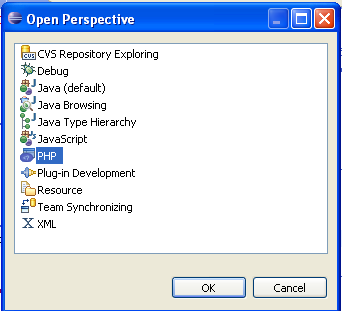
Then select the "Other" option, select PHP, then click "OK":
Click the PHP button to go to the PHP perspective:
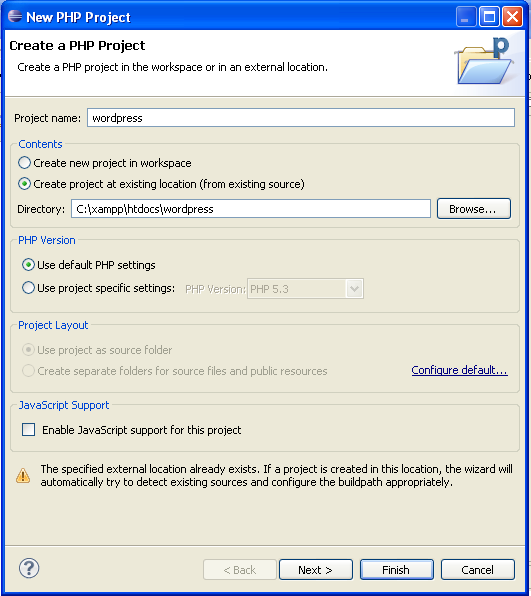
Then go to "File -> New -> PHP Project." This will bring up the "New PHP Project" window. You can enter "wordpress" or whatever you want for your project name. You should select the "Create project at existing location (from existing source)" option under "Contents" and browse to your WordPress root directory. Leave the defaults for the other sections, then click the "Finish" button.
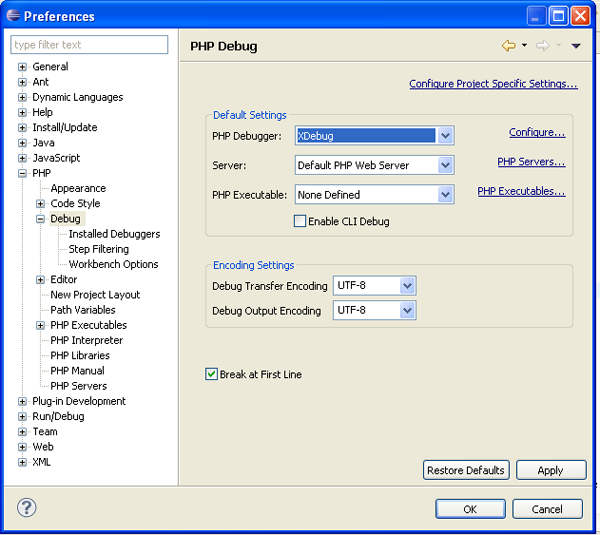
Go to "Window -> Preferences -> PHP -> Debug" and change the "PHP Debugger" setting from Zend to XDebug.
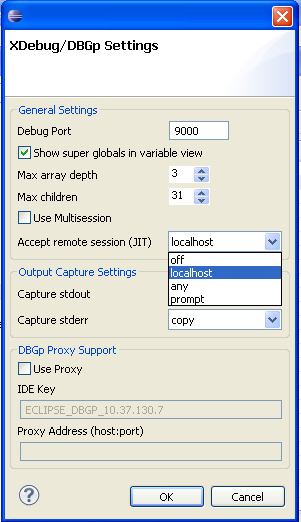
Then go to "Window -> Preferences -> PHP -> Debug -> Installed Debuggers" and double click XDebug. Change the "Accept remote session (JIT)" option from "off" to "localhost" and click "OK".
Step 2 Debug Your Code
Set Breakpoints
A breakpoint is a marker that tells the debugger to pause a program's execution at a certain line of code so you can inspect what's going on.
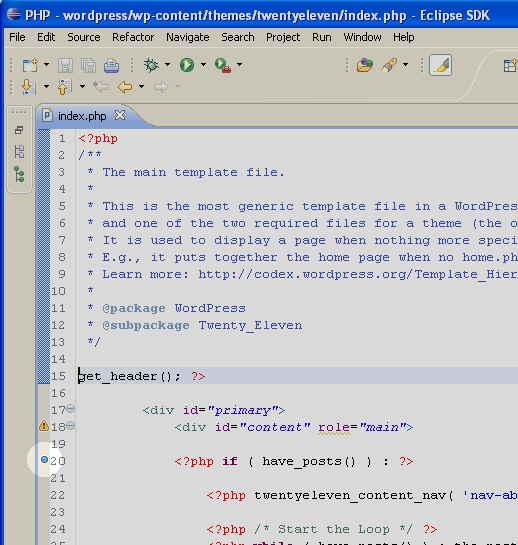
This is easy. Just open the file containing the code you want to inspect (such as the index.php file in a theme you're developing). Then, on the left side of the file window, just double-click the grey area to the left of the line. A blue dot should appear as it does on line 20 in the example below (the index.php from the twentlyeleven theme).
Start an Xdebug Session
After setting a breakpoint, open up a browser and go to your local WordPress site, appending the query string XDEBUG_SESSION_START=wordpress like this:
http://localhost/path/to/wordpress/?XDEBUG_SESSION_START=wordpress
This will tell xdebug to set a cookie which it will look for on subsequent page loads. If everything is configured correctly, you should see a notification that Eclipse has received an incoming session. Click "OK" to accept, and then the Debug view should open on the first line of index.php.
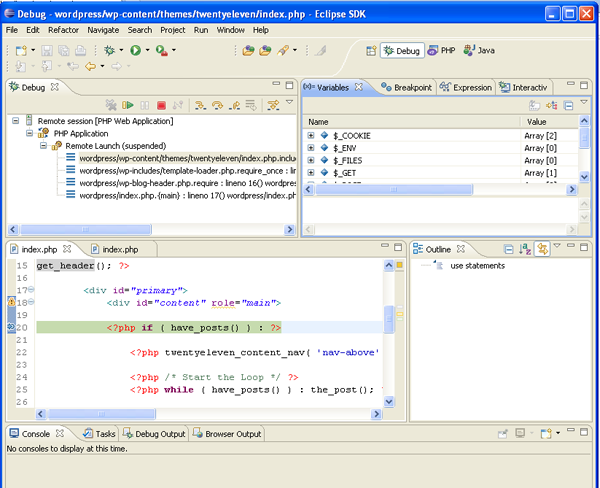
You can inspect variables which are currently in scope using the "Variables" inspector window on the right side. In the example above, there are no local variables to look at, only the global $_COOKIE, $_ENV, $_FILES, $_GET, $_POST, $_REQUEST, $_SERVER and $GLOBALS variables.
Step Through Code
To see an example of more useful information, you'll need to step through a few lines of code to get to The Loop. The Eclipse "Debug" window has several controls you should understand:
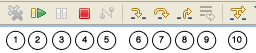
- Remove All Terminated Launches – Clear previous sessions
- Resume – Resumes execution of code. If you have no other breakpoints set, the program will finish loading normally.
- Suspend – Does not apply to PHP debugging.
- Terminate – Stop execution of the program and debugging.
- Disconnect – Stop debugging, but continue executing the program.
- Step Into – Follow code as it executes line-by-line, including going into function calls. This is useful to debug a particular function.
- Step Over – Skip showing execution of a particular function call. Execution will resume at the next line.
- Step Return – If inside a function, this will skip to where it returns.
- Drop To Frame – Does not apply to PHP debugging.
- Use Step Filters – Not supported in Eclipse PDT
Click the "Resume" button once. The Eclipse debug client should next pause at the breakpoint you set in the theme's index.php file.
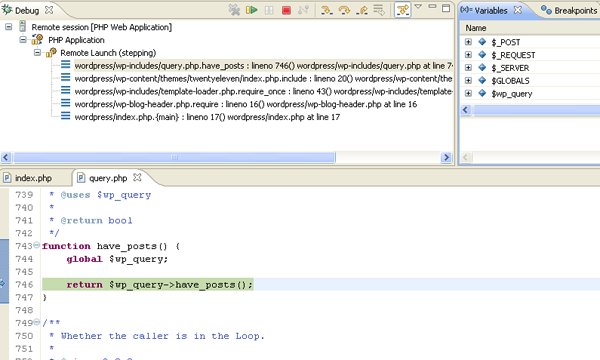
Click the "Step Into" button. This will take you into the WordPress "have_posts" function. Click "Step Into" again, and you will see the global $wp_query variable show up in the "Variables" window.
Click "Step Return" to exit the "have_posts" function, and you'll be back in the index.php file. In the example, this will then leave you at a call to the "twentyeleven_content_nav" function. You can either step into it to see what's going on if you're interested, or step over it if you're not.
Clicking "Step Over" will take you to the call to The Loop. Stepping into "the_post" will teach you a lot about how WordPress fetches data and writes it to the page during The Loop. Keep an eye on the "Variables" window to monitor how local and global variables change as the function executes.
You can also step through your own code in the same way to see how variables are manipulated as the code runs.
When you've seen all you want to see, click the "Resume" button and your blog will finish loading as usual.
If you click a link to another browser page, note that the debugger will load again even if the XDEBUG_SESSION_START query string isn't appended to the end of the URL.
Closing Your Debug Session
When you no longer want Eclipse to enter debug mode when a page loads on your local blog, just enter a URL call that looks like this into your browser:
http://localhost/path/to/wordpress/?XDEBUG_SESSION_STOP
That will delete the xdebug cookie, and your pages will load normally until you open another xdebug session.
Do you use Eclipse and Xdebug for hardcore WordPress development? If so, do you have any additional tips? If not, what's stopping you from diving in?

Comments