Welcome to part six of the Mobiletuts+ Beginning iOS Development series. This installment will cover Xcode debugging fundamentals. It will include a brief amount of software debugging theory and a practice application to demonstrate the use of breakpoints and the Xcode debugger. The article will conclude with some general tips and best practices, as well as a list of useful resources available for you to continue your learning.
Screencast:
Trouble viewing the media above? Access the full, high-quality version of this video in its original, MOV format.
Tutorial Transcript:
Instead of building a new application specifically for this tutorial, I’ve taken the FortuneCrunch application that we created in part two of this series and I’ve introduced a number of different errors into the source code. Download BrokenCrunch, the broken version of FortuneCrunch accompanying this post, to follow along as I demonstrate how to use the Xcode debugging tools.
Debugging Theory
Before we begin actually debugging BrokenCrunch, let’s talk for a moment about software debugging theory. In general, software errors (also known as "bugs") can be categorized as follows:
- Compile-Time Errors
- Run-Time Errors
- Logical Errors
Compile-Time Errors
As the name implies, a compile-time error occurs when you attempt to compile your application source code. In Xcode, this happens when you select "Build and Run" or "Build and Debug" in order to launch your application on the device or simulator. When a compile-time error is encountered, it will literally prevent your application from being launched. As we will see, errors in this category may either occur from nonsensical or incorrect syntax statements or from problems that arise in the linking phase of your application build. Generally speaking, compile-time errors are the easiest of the three categories to resolve because the compiler will typically issue a meaningful error message or warning message that will alert you to the nature of the problem.
Run-Time Errors
Run-time errors occur after your application has been compiled and launched in the Simulator or on a device. An application crash or memory leak that occurs as the result of poor object memory management is an example of a run-time error.
Logical Errors
A logical error occurs during the run-time phase of an application and results in unexpected or undesired application behavior that conflicts with the software developer’s or project stakeholder's intended outcome. A good example of a logical error is a mathematical formula that has been implemented incorrectly. Consider the Pythagorean theorem:

If a software developer unintentionally implemented this formula as:

The result would be a logical error, but it most likely would not cause the application to crash. That is what makes logical errors so hazardous: the application may seemingly run "bug free" to the developer while in fact producing invalid or undesirable output.
Debugging BrokenCrunch
With this theoretical knowledge in place, open BrokenCrunch and let’s get started. After loading our sample application, select Build > Build and Debug. You’ll notice that the application fails to launch, and the compiler has generated a number of errors. To view the results of the attempted compilation, select Build > Build Results.
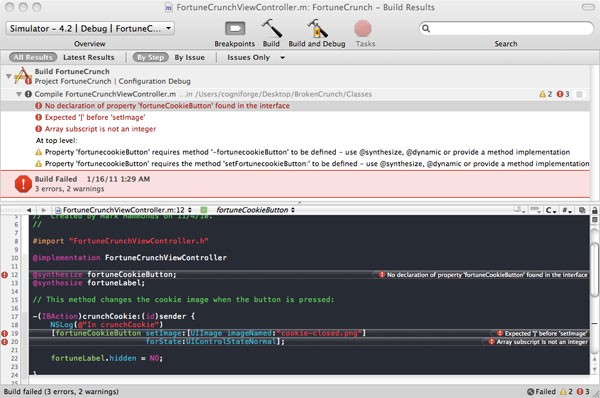
Selecting the errors listed will take you directly to the line of code where the error is being reported. One important thing to keep in mind, however, is that the number of errors being reported by the compiler and the line numbers of those errors should be thought of as the "best guess" of what’s wrong with your application, not a conclusive pronouncement.
In fact, one simple syntax error can result in multiple errors being reported by the compiler that are seemingly unrelated to the problem. As an example, take a look at the "Expected bracket before 'setImage'" error line. If you examine the line in question, you should find that the syntax is perfect. As it turns out, the problem here isn't on the line reported, but the line just above it. Do you see the problem?
The NSLog() statement wasn’t terminated with a semicolon. This means that the compiler doesn’t know that you intended to end the line after the last parenthesis, and is viewing everything from NSLog to the final closing bracket and semi-colon after UIControlStateNormal as one statement.
Add the semicolon to complete the NSLog statement:
NSLog(@"In crunchCookie");
Save the source file, and click "Build and Debug" again. Two of the three errors originally displayed should now be resolved.
Next, select the "No declaration of property" error. As you can see, this error is reporting that the property we are attempting to synthesize doesn’t exist. To verify this, open the FortuneCrunchViewController.h file where the property should have been declared. If you examine line 17, the syntax is correct, but we do have a mismatch between the property we have declared and the one we are attempting to synthesize. Objective-C is a case-sensitive language, meaning that the ‘C’ in cookie must be capitalized to match the property we are attempting to synthesize. Update the property declaration in the header file to read:
@property(nonatomic, retain) IBOutlet *fortuneCookieButton;
Save the source file and build and debug once again. This time, rather than opening the build results from Build > Build and Debug, simply click the error icon in the bottom right corner of Xcode.
One step forward, four steps back. The error regarding the synthesize property line is gone, but we have an entirely new list of errors. What happened?
This is a good time to take notice of the different phases being shown in the Build Results window:
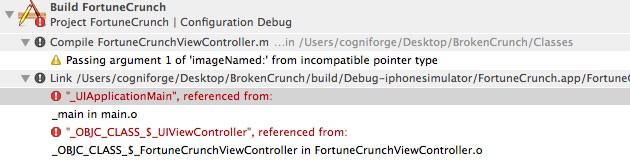
Notice that we have one warning underneath the “Compile” section of the build results output. This is the same section that our previous errors were being reported in. Now that the previous three errors have been resolved, we have been able to progress from the compile phase to the linking phase of our application build, and all of the new errors are linking errors. When you encounter a linking error, it’s typically because you are trying to use functions from a framework that you haven’t actually included in your application. In this case, the Build Results are referencing a function called _UIApplicationMain in the main.o file. Main.o is the compiled, machine code version of main.m. Let’s take a look at the source code in that file. On line 13 you can see a function call to UIApplicationMain:
int retVal = UIApplicationMain(argc, argv, nil, nil);
UIApplicationMain is a central function to every iOS application, but how can you find out more about it and figure out what framework it is included within? Fortunately, the iOS SDK comes with some great documentation. If you hold down the option (or alt) button and double-click the function name, you will launch an abstract from the official iOS SDK documentation discussing this function. Click the “book” icon in the top right to view the full documentation available. You can see that doing so launched the function reference documentation for the UIKit framework. Bingo, we have our missing framework. However, before we add the framework to the project, let’s examine another method that you could have used for determining the origin of UIApplicationMain.
Close the documentation window. Now, hold down the command button and double-click the UIApplicationMain function. You are now looking at the source of UIApplication.h, the header declaration file that contains the UIApplicationMain function declaration. If you scroll to the top of the window, you will see that this file imports multiple other UIKit headers, and that the comment at the top includes the “UIKit” framework name.
Let’s move on to resolving these linking errors by including the UIKit framework. To do so, right click or control click on the Frameworks folder in the Groups & Files pane, and select add > existing frameworks. Find the UIKit framework and click “Add.” To test our work, select Build and Debug again.
As you can see, the simulator launched successfully and we are able to view our application. This means that we have resolved all of the compile-time errors in our application.
Go ahead and click the fortune cookie. . .as you can see, clicking the cookie results in a run-time error and the application has crashed. The message displayed in the bottom left of the Xcode screen isn’t very helpful, so let’s take a closer look by opening up the console.
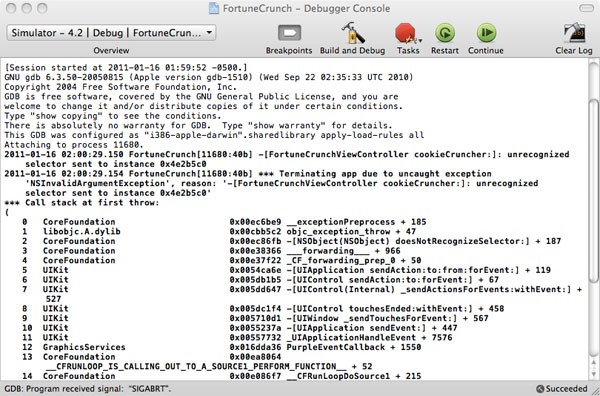
The console displays both a call stack of what was occurring in our program execution at the time of the crash, as well as a more detaild explanation: "Terminating app due to uncaught exception. . .FortuneCrunchViewController cookieCruncher: unrecognized selector sent to instance." This message means that our button is calling the wrong selector for the event that we fired by clicking the cookie. Since the interface for FortuneCrunch was built in Interface Builder, let’s open the Interface Builder XIB file for “FortuneCrunchViewController” to take a closer look.
Select the cookie button and control click or right click to view a list of connected actions:
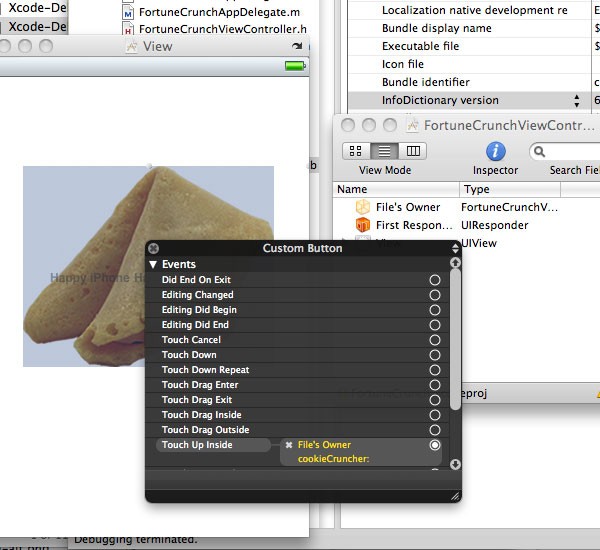
You can see that the Touch Up Inside event is referencing a target that doesn’t exist, indicated by the yellow text. Remove the non-existent “cookieCruncher” target and reconnect touchUpInside to File’s Owner by selecting the “crunchCookie” target that appears in the drop down. Save your work in Interface Builder, switch back to Xcode, and relaunch the application.
Clicking the fortune cookie again results in a run-time error. This time, the console message isn’t so helpful, it just displays "EXC_BAD_ACCESS".
Take another look at the build results by selecting Build > Build Results. Did you notice the warning earlier? Compiler warnings are often an indication of a potential run-time error, but because there is nothing incorrect with the actual syntax of the line the warning is issued for, the compiler is still able to build the application successfully. Of course, there are times when a compiler warning is a “false flag” and will not result in a run-time error, but upwards of 95% of the time, if the compiler has issued a warning you are doing something wrong.
Click on the warning to jump to the line in your source code where it occurred.
The warning is referring to incompatible pointer types. Do you see the problem? The imageNamed method expects an NSString object, but this line of code is supplying the method with a literal C style string. Add in the “@” symbol to make this an Objective-C string:
[fortuneCookieButton setImage:[UIImage imageNamed:@"cookie-closed.png"] forState:UIControlStateNormal];
Save your progress and run the application again.
This time, when you click the fortune cookie you encounter a logical error: the application doesn’t crash and the “Happy iPhone Hacking” label appears as expected, but the background image remains as the closed cookie.
To fix this, let’s take a look at the function responsible for the transition: (IBAction)crunchCookie. Line 19 is responsible for changing the background image and you can see that it is setting the new background image to “cookie-closed.png”. If you take a look at cookie-closed in the Resources folder, you’ll see that this is in fact the same image displayed when the app first loads. We need to change that line to transition to “cookie-crunched.png”:
[fortuneCookieButton setImage:[UIImage imageNamed:@"cookie-crunched.png"] forState:UIControlStateNormal];
Build and run the application again. . .and now tapping the cookie results in the expected background image with the label displayed properly.
Congratulations! You’ve just walked through the process of fixing compile-time errors, run-time errors, and logical errors in an application. All the while, we have barely tapped into the powerful debugging tools available to you with Xcode.
To continue our exploration of the more advanced debugging tools available, let’s try to extend the FortuneCrunch app to make it a bit more interesting. Rather than display the static string “Happy iPhone Hacking!” every time the cookie is crunched, let’s build an array of multiple NSString values that could be displayed.
Switch back to Xcode and open the FortuneCrunchViewController.h file. Add the following data member:
NSArray *fortunes;
This array will be used to hold our random fortune strings.
Now, add the following method signature:
-(NSString *)generateRandomFortune;
This line will declare a new method in our class that will be used to select a random fortune from our fortunes array.
Next, switch to FortuneCrunchViewController.m. Since this class will be initiated from our XIB file, we need to override the initWithCoder method and allocate the array we declared in the .h file, initializing it with some new fortunes:
-(id)initWithCoder:aDecoder
{
    self = [super initWithCoder:aDecoder];
    if(self)
    {
        fortunes = [[NSArray alloc] initWithObjects:
                          @”He who throws dirt loses ground.”,
                          @”A closed mouth gathers no feet.”,
                          @”Help! I am a prisoner in a bakery!”, nil];
    }
    return self;
}
Now that we’ve created a new NSArray, don’t forget to release it in the dealloc method:
-(void)dealloc
{
    [fortunes release];
Let’s move on to coding the generateRandomFortune function:
-(NSString *)generateRandomFortune
{
    int chosen_index = arc4random() % 3 * 10;

    return [fortunes objectAtIndex:chosen_index];
}
These lines simply generate a new, random index number that we will use to return the corresponding fortune string.
Finally, modify the crunchCookie method to use one of our random fortunes rather than the static text “Happy iPhone Hacking!”:
fortuneLabel.text = [self generateRandomFortune];
Build and run the application after saving these changes. If you click the cookie, you will create a run-time error. To figure out why this is happening, we’re going to use the Xcode debugger and custom breakpoints.
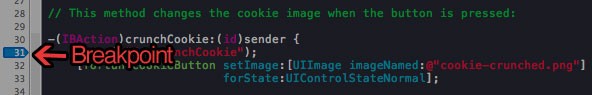
A breakpoint is a flag that signals to your application that program execution should “pause” when the line with the breakpoint is reached. Running your application in “Build and Debug mode” allows you to use breakpoints. To set a breakpoint, simply click in the editor “gutter” on the line you would like to trigger a breakpoint. To figure out what’s happening in our application, we’re going to set our breakpoint on the NSLog line, just after the crunchCookie method is called:
Build and debug the application with this new breakpoint in place.
After the application loads, click the cookie. If you look in the bottom left of Xcode, you’ll see the status message “Stopped at breakpoint 1”. This means the debugger has successfully stopped program execution at the breakpoint you set. You’ll also notice that a red arrow indicates the current line of execution where the debugger has “paused” the program.
So, what can you do with the debugger? More than can be covered in a single tutorial. However, there are three fundamental actions you can take at this point: Step over, step into, and step out. All of these options are available to you from the in-code debugger menu bar.
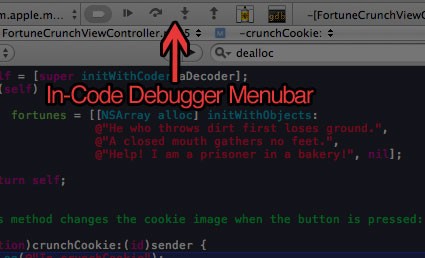
If you press the "step over" button on the in-code debugger menu, you’ll notice that program execution continues to the next line. “Step over” will simply continue execution one line at a time within the current method, but it won’t follow your code execution if it forks to another method. If you want to actually follow the code execution into other method calls in your code, you will need to use the “step into” button.
As you can see, step into has actually taken us into the generateRandomFortune method, which is exactly what we want. Click “Step over” again to see what happens when arc4random() is called. Wouldn’t it be nice if we knew what the chosen_index variable has just been set to? Fortunately, we can! One of the best features of using the debugger is the ability to simply mouse over variables to quickly see their value.
Clearly, the chosen_index value is much larger than the length of our array. Unlike in some other programming languages, the randomization function we are using will return an integer, so there is no need to convert from a decimal to an integer by multiplying the value by 10. Update the line to read:
int chosen_index = arc4random() % 3;
We’re done making modifications to this function, so use the “Step Out” button to exit this sub-function and return to crunchCookie. Note that even though we didn’t see it, the rest of the function executed as normal.
Finally, take note of the “Activate / Deactivate” breakpoint button and the “Continue Execution” button on the in-code debugger menu bar. “Continue Execution” will simply allow program execution to continue as normal. You can think of it as the “unpause” button. Go ahead and press this now.
Before we move on to turning off breakpoints, there is one more issue to tackle: what you have just experienced is called the “in-code debugger”. It’s very powerful, but there are also two other debugging modes available to you: the full debugger window and the mini-debugger perspective.
To access the full debugger window, click the "debugging" icon on the in-code debugger menubar. This window has significantly more information than the in-code debugger. On the left you have a stack-trace displaying the context of program execution (you also have the ability to select from any of the currently spawned threads). To the right, you can see a quick display of the various variables currently held in memory. Selecting a different call-stack signature will change your view in the Debugger. You can change the Debugger window layout by going to Run > Debugger Display.
Finally, the mini-debugger is yet another debugging perspective available to you. I rarely use this perspective, but it is available to you from Run > Mini-Debugger.
Since we just resolved the error introduced in our random fortune code, we no longer need the debugger to be on. Toggle off breakpoints. However, before we build the application again, let’s adjust the font size of our fortune label.
Open Interface Builder, select the label and change the font in the Inspector to Arial Black, 9 point, and then select the “Adjust to fit” box and change the minimum font size to 6 point. Now, build and run our project again.
Voila! Our application now functions as we intended.
Debugging Tips & Tricks
Now that you’ve been introduced to the basics of using the Debugger in Xcode, consider applying the following guidelines in your everyday development workflow:
Test in Both the Simulator AND on a Physical Device
While the simulator is a helpful method of testing an application during the development phase of your product, it is not a replacement for testing on a physical device. This is because the Simulator and an iOS device differ in important and fundamental ways. For example, the simulator is obviously running within OS X, and the filesystem on OS X is not case sensitive. However, the file system on iOS is case sensitive. So referring to the file cookie-CRUNChed.png, instead of cookie-crunched.png, will work just fine in the simulator but fail on an actual iOS device. Another key consideration is that the simulator has much more memory available than an actual device, and this fact will often greatly impact the user experience. Finally, not all of the default applications that ship with iOS are available in the simulator, including the Maps and the App Store programs. This means that you won’t be able to test code that generates driving directions with the Maps app or cross-promotes applications in the App Store in the simulator. These are just a few of the differences that exist. I strongly recommend testing on as many physical iOS devices running as many different targeted versions of iOS as possible.
Use the Clang Static Analyzer
The Clang Static Analyzer is a special C/Objective-C static analysis tool that ships with Xcode. This tool is able to analyze your code for errors or inconsistencies that might otherwise go unnoticed.
While the details of how the analyzer works are beyond the scope of this article, using it is fortunately very easy. To perform a static analysis of your code, simply select Build > Build and Analyze from the Xcode build menu.
If you would like to learn more about how the “Build and Analyze” option works, you can read about Static Code Analysis and the Clang Static Analyzer online.
Set a Global Breakpoint on objc_exception_throw
In this tutorial, we learned about how breakpoints work by setting project specific breakpoints in our code. In addition to project specific breakpoints, Xcode will also allow you to set “global” breakpoints that will apply to all of the iOS projects you create in Xcode. Setting a global breakpoint on objc_exception_throw will allow you to automatically launch the debugger whenever an exception (a type of run-time error) occurs. To read more about the benefits of this approach and how to implement it in code, refer to my iOS Quick Tip on objc_exception_throw and global breakpoints.
Treat Warnings as Errors
As mentioned previously in this tutorial, the vast majority of compiler warnings that are issued should be resolved before you launch your project, and there should really never be a scenario when code that generates compiler warnings must remain unchanged in order for an application to function properly. Consequently, some programmer’s recommend treating all compiler warnings as errors, thus forcing them to be resolved as part of the normal development process.
For all but a few fringe cases, I support this idea, and Xcode makes it easy to implement. Go to Project > Edit Project Settings and then select the Build tab. Type “Treat warning” into the search bar and you’ll see a boolean value called “Treat Warnings as Errors.” Check this box to enable the feature.
Build and Validate Before App Store Submission
Another step you can take to increase the odds of your application being accepted the first time you submit it to the iTunes Store is to enable the “Build and Validate” flag in the project build settings. Type “validate” into the search box of the project settings build tab, and then select “Validate Build Product.” This option will run some of the tests performed by the Apple reviewers, allowing you to potentially pre-empt an App Store rejection. It should be noted that checking this box is not a guarantee that your app will pass App Store review, but it is better than nothing.
Additional Debugging Tools
In addition to the console, build results, and the Debugger, there are a few other great debugging and optimization tools you should be aware of in your development efforts. For further reading, take a look at the documentation for the following tools:
Conclusion
This has been a whirlwind tour of debugging with the iOS SDK. There is still much more that can be done, but hopefully this lesson has been enough to help you more quickly resolves the bugs in your own applications and write better software! If you would like to hear more about some of the advanced tools discussed in this tutorial, such as Instruments, Shark, or SpinControl, or if you would like to hear more about debugging in general, leave a comment below and let me know!

Comments