The Android SDK comes with a number of useful tools to help you design, develop, and test Android applications. One tool that comes in handy for designing, debugging, and profiling your layouts and Android application user interfaces is called the Hierarchy Viewer. The Hierarchy Viewer is available as a standalone executable, and has recently been incorporated into the Eclipse ADT plug-in for Android development. In this tutorial, learn how to use Hierarchy Viewer to optimize your layout resources.
The Hierarchy Viewer is a visual tool that can be used to inspect your application user interfaces in ways that allow you to identify and improve your layout designs.
Getting Started
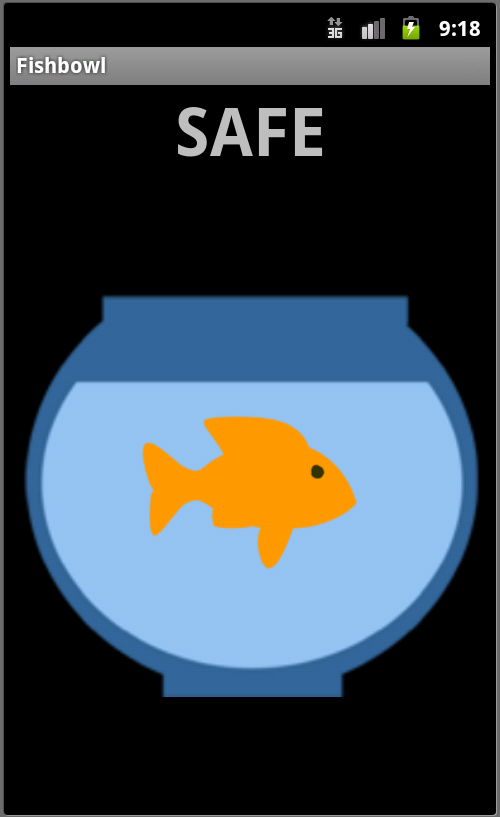
We’ve whipped up a very simple application with one screen. The screen uses a vertical LinearLayout control with two “cells”: A TextView control that says “Safe” and a FrameLayout which contains two ImageView controls. Two underlying drawable graphics are used: a bowl and a fish. Figure 1 shows our simple Fishbowl app screen:
We will use the Hierarchy Viewer tool to optimize our layout. We introduced this tool in the Android Tools: Using the Hierarchy Viewer tutorial. If you are unfamiliar with the Hierarchy Viewer, you will want to read that tutorial before continuing.
Step 1: Inspect the View Hierarchy of the Screen
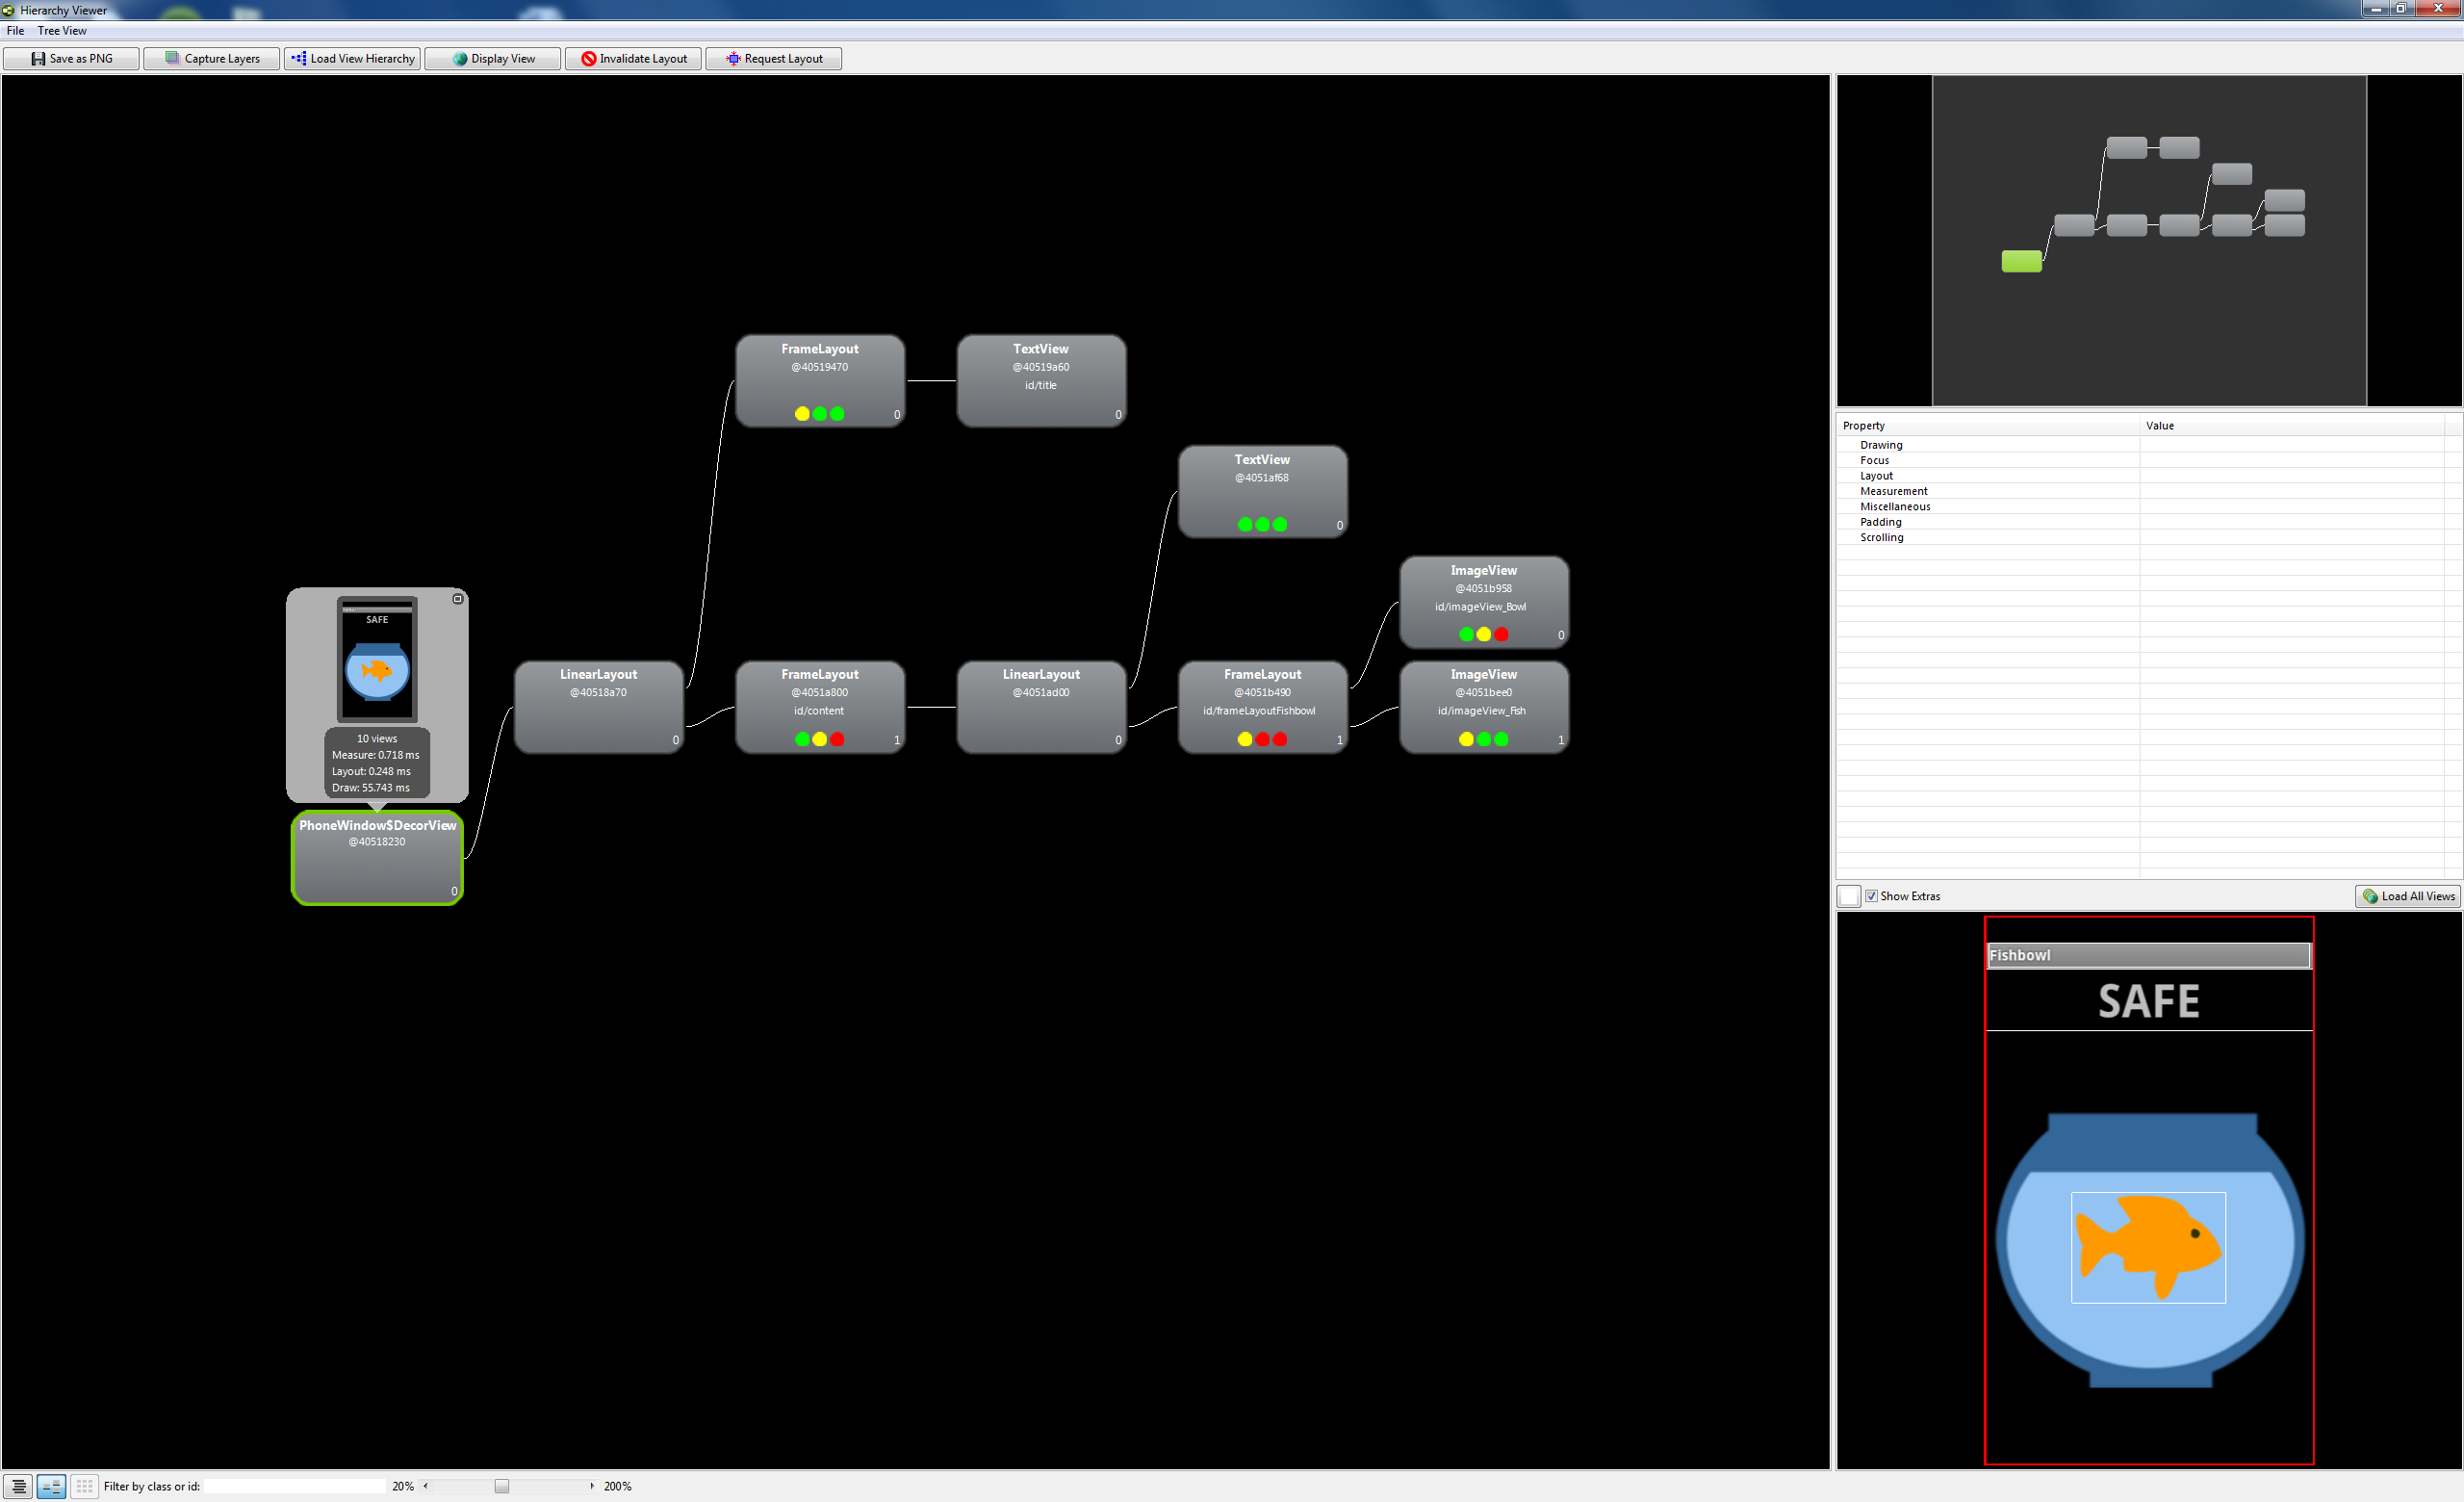
Let’s begin by looking at the general picture of what’s going on with the screen by launching the Hierarchy Viewer and loading the View Hierarchy of the screen. Figure 2 shows what the screen might look like:
Step 2: Using the View Performance Indicators
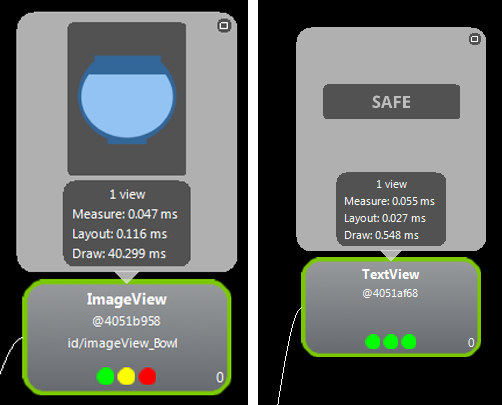
Notice how each View within your application has a set of three colored dots (Figure 3).
These dots are performance indicators:
- The left dot represents how long the measuring operation for this view takes.
- The middle dot represents how long the layout rendering operation for this view takes.
- The right dot represents how long the drawing operation for this view takes.
These indicators can be red, yellow, or green and represent how each view renders in relation to other views in the tree. They are not a strict representation of a bad or good view, per se.
- A red dot means that this view renders the slowest, compared to all views in your hierarchy.
- A yellow dot means that this view renders in the bottom 50% of all views in your hierarchy.
- A green dot means that this view renders in the top 50% of all views in your hierarchy.
When you click on a specific view within the Tree, you will also see the actual performance times upon which these indicators are based. These times include the time of rendering all child controls. For example, the rendering times for the FrameLayout will contain the rendering times of its two child ImageView controls.
Step 3: Using Performance Data to Improve UI Performance as a Whole
Once your user interface has settled and you’ve addressed the obvious culprits to slowing down your UI rendering performance, you have to start looking at the performance statistics more closely. You’ve streamlined the underlying resources as much as possible, so you’ll want to switch your focus on the rendering times as opposed to the indicators.
Optimizing user interface performance means optimizing all its layouts and view controls so that they are as fast as they can be. Your job as a performance tuner is to make those reported rendering times for each view in your hierarchy as fast as possible. To do this, it’s best to take a baseline. I like to print out the hierarchy tree, making a note of each control’s rendering times, and then work on addressing each control’s weak spots and bringing those times down as low as possible.
Step 4: Using Performance Data to Improve UI Performance as a Whole
The performance indicators help you address the obvious culprits to slowing down your UI rendering performance by showing you your lazy views that take the longest to render. But what can you do with this information?
Well, one easy thing to do is look for what’s working and what’s not and prioritize your hunt accordingly. In our example, the TextView control is loading very quickly (all greens). No point in scrutinizing that view too closely right away. However, the FrameLayout containing the fish and bowl ImageView controls is another story. Those red dots cry out for a little investigation.
Step 5: Optimizing ImageView Control Rendering
So what can we do with ImageView controls to make them render faster? Well, here are a couple of ideas:
- Optimize the image format for Android. PNG files are generally the preferred lossless format, followed by JPG, the preferred lossy format, which can be tweaked for compression. GIF usage is discouraged, although it’s generally plenty fast from what we’ve seen.
- Optimize the image dimensions for the layout. If you are sizing your graphics up or down a lot, this takes time.
For example, I was able to improve the draw time of the fishbowl ImageView control by switching it from a lossless PNG file (draw time ~40ms) to a lossy, compressed JPG format file (draw time ~26ms).Similarly, I can make the draw time on the fish ImageView control worse by resizing the graphic and making it substantially larger than what is needed in the application.
When looking at rendering times, consider also what you're drawing and what the user gets out of it. For example, a rendering time of 40ms for a single image is unacceptable for any sort of smooth animation – the image could only be rendered 25 times a second, not smooth enough and not leaving any time for any other processing or rendering.
Step 6: Optimizing Layout Control Rendering
When you’re looking at how to optimize your layouts (LinearLayout, FrameLayout, RelativeLayout, and so on), we’ve got a couple pieces of advice for you:
- Don’t nest your layouts too deeply.
- Watch for layouts duplicated in the hierarchy. For example, if you have a FrameLayout within a FrameLayout, what’s the point?
- Don’t use layouts you don’t need. One single RelativeLayout can often take the place of several nested LinearLayout or TableLayout controls.
- Check out the layoutopt tool (see Android SDK Tools: Layout Optimization), which can help you optimize your layout designs.
Step 7: Optimizing Screens in General
In terms of UI optimization in general, here are a few more tips:
- Don’t overload your screens with view controls. Keep it simple.
- Tailor your resources to the job. By using alternative resources to supply the best resources for a given situation (screen dimensions, orientation, resolution, etc).
Conclusion
Each screen is different and has different performance and responsiveness requirements and characteristics. This concludes our brief discussion of how to use the Hierarchy Viewer application to profile and optimize your application user interfaces. The Hierarchy Viewer is a powerful tool for visualizing and inspecting the components that make up your Android app user interfaces. It can be used to help streamline layout design and determine where your UI performance bottlenecks are. With the rendering information you can derive from the Hierarchy Viewer tool, you can establish a baseline and then tweak your user interface components to make them leaner, meaner, and faster to load, resulting in an improved experience for users.
As always, we look forward to your feedback.
About the Authors
Mobile developers Lauren Darcey and Shane Conder have coauthored several books on Android development: an in-depth programming book entitled Android Wireless Application Development, Second Edition and Sams Teach Yourself Android Application Development in 24 Hours, Second Edition. When not writing, they spend their time developing mobile software at their company and providing consulting services. They can be reached at via email to [email protected], via their blog at androidbook.blogspot.com, and on Twitter @androidwireless.
Need More Help Writing Android Apps? Check out our Latest Books and Resources!


Comments