We have been learning how to develop Android apps in this series. In the last tutorial, we looked at connecting hardware and virtual devices to Eclipse. In this tutorial, we will explore running and debugging apps on physical devices and AVDs from Eclipse.
Introduction
For those who have been following this series on Android app development, the app we created earlier doesn't do much at the moment, but we can use it to work through the process of running apps as you develop, as well as introducing some of the Eclipse ADT utilities you will use for debugging once your apps become more advanced. When you have completed this tutorial, you may wish to spend some time making adjustments to the code in the app we created, and then run it on a physical or virtual device. This tutorial will help you get into the routine of using devices during development and running your apps regularly, so that you catch errors as you code.
1. Running
Step 1
When you compile and run your Android app on a virtual or physical device, Eclipse handles most of the details for you. Eclipse and the ADT create an APK file for your app and install it onto the device you are running. APK files are ultimately what the user downloads from Google Play. However you need to carry out additional steps to build your apps for release, as we will explore later in the series. Initially, Eclipse will build an APK for debugging, which you can run directly on a device from within the IDE.
Connect a hardware device to your computer or start an AVD using the techniques we covered in the last tutorial. We will run the app on whichever device you connect. Any virtual or actual device must meet the minimum API level you specified in the app Manifest or you will not be able to run it.
Step 2
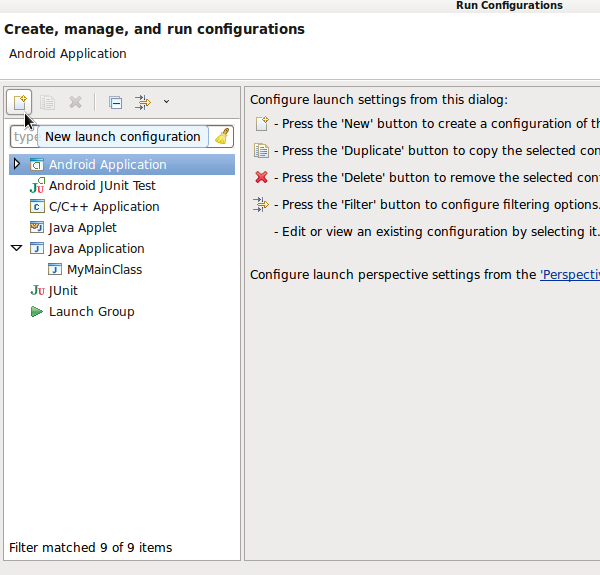
Now we can run the app by first creating a run configuration for it. In Eclipse, choose "Run" then "Run Configurations". To the left of the Run Configurations window, you will see a list of application types you can run. Select "Android Application" and click the New button above it.
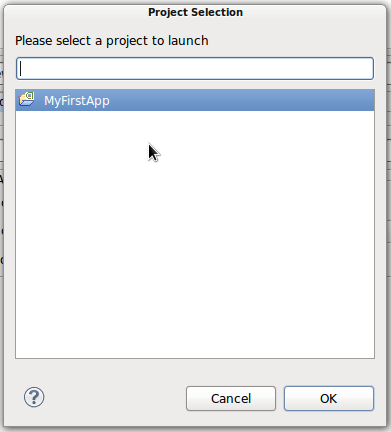
In the new configuration section that opens, type a name in the Name field, replacing the existing text. This should identify your app at a glance. Click the "Browse" button, select your app project, and click "OK".
Click the "Target" tab. You can let Eclipse automatically pick a device to launch the app on, or set it to prompt you to make a choice each time you run the app. This is only applicable when you have more than one device connected to Eclipse, for example a hardware device and an AVD.
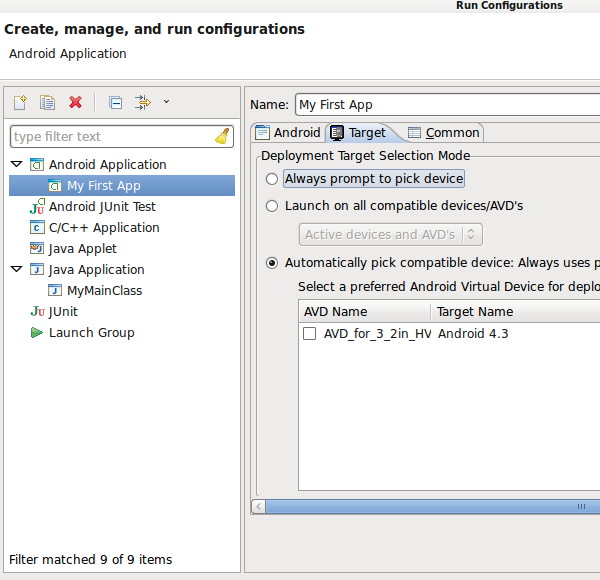
Notice that your app is now listed in the Android Application section of the Run Configurations list. You can launch it from here in the future even when you have other apps in your workspace.
Click "Run". If you set the run config to prompt you to pick a device, Eclipse will do so now. Select the physical or virtual device you are using. If you do not have a device connected or AVD running but have Eclipse set to pick a device automatically, it will launch a suitable one of your AVDs now. You can use the "Run" button in the Eclipse toolbar to launch whichever app you ran last without having to go through the Run Configurations window each time.
Step 3
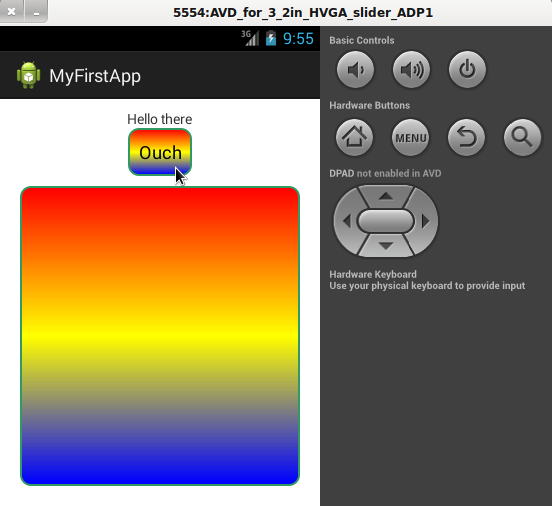
When you run your app, Eclipse copies the APK to the device, installs it, and starts the main Activity.
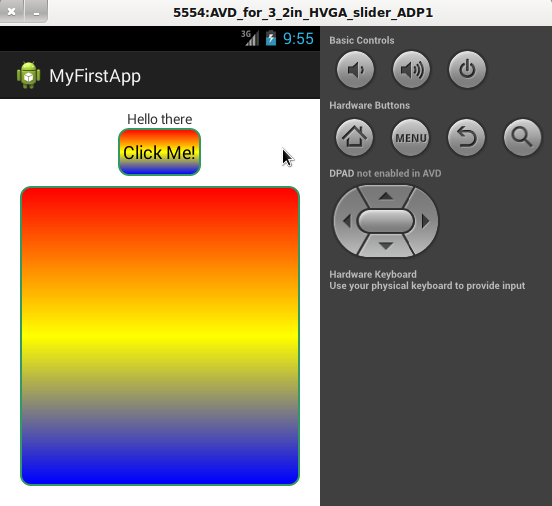
Remember the basic user interaction we implemented with the button; clicking it changes the text displayed (clicking with the mouse on the AVD emulates tapping with the finger on a real device).
Step 4
When you are developing your apps, you will likely repeatedly run them, make edits, and run them again. One of the main tools you will find useful is the Log. Within your Java files, you can write messages out to the LogCat to help with development and debugging. In your main Activity class, add the following instance variable at the top of the class:
private final String LOG_TAG = "MainActivity";
This is a tag constant we will use to write log messages out, using the class name makes it clear which class a log message is from. In the onClick method, just before setting the text on the button, add the following code:
Log.v(LOG_TAG, "button clicked");
You will need the "android.util.Log" import in your class. When you write to the Log, you can choose from various methods to reflect the purpose of the message. In the code above, we use v for verbose. You can also use d for debug messages, i for information, w for warning, and e for error.
Save your file and run the app again using the "Run" button. Make sure you have the LogCat View open in Eclipse. Click the UI button on your device or AVD again. Scroll through the Log messages in the LogCat View until you find your message.
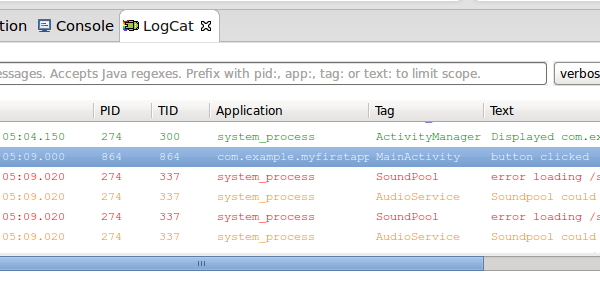
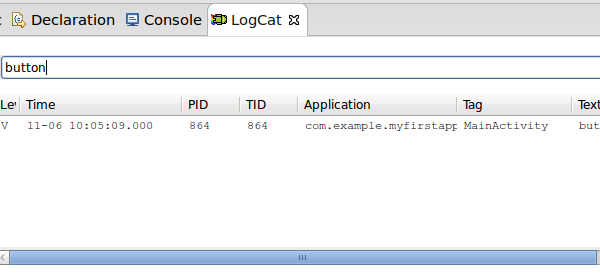
As you can see the messages are color-coded to reflect the Log method used in each case. You can search for messages by typing into the text-field, which can be particularly useful when there are a lot of messages displayed, for example when you are using a hardware device.
2. Testing
We won't go into the details of testing in this tutorial as it's really a topic for later on in your Android learning process. When you are ready to start testing, you can create a test project for your app in Eclipse. See the Developer Guide Testing Fundamentals and Activity Testing Tutorial pages for a comprehensive guide to testing on Android. The testing tools are based on JUnit, with dedicated Android testing resources extending JUnit specifically for Android development. If you are already familiar with Java testing, you should know most of what you need to for Android app testing.
3. Debugging
Step 1
Although you will not need to engage in debugging apps straight away, we will introduce what you can do with the DDMS (Dalvik Debug Monitor Server) as the tools can prove useful throughout the development process. We have already seen one of the debugging Views in Eclipse, the LogCat, but there are several others you can use.
With a hardware or virtual device running and connected to Eclipse, open the DDMS perspective by choosing "Window", "Open Perspective", and "DDMS". You can toggle between this and the Java perspective using the buttons you see at the top right corner of Eclipse.
Step 2
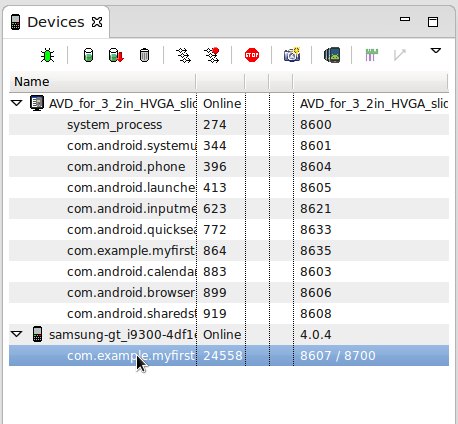
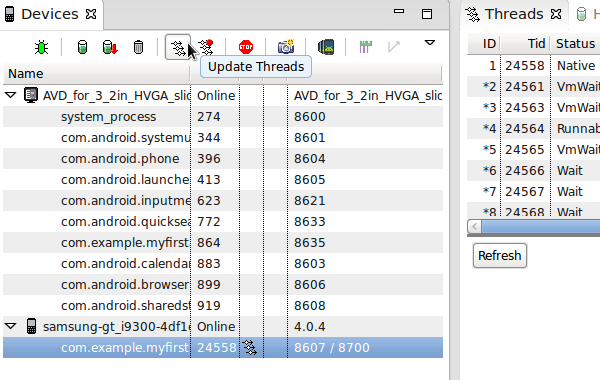
Let's explore some of the DDMS Views. We met the Devices View last time (it displays a list of connected devices together with links to any processes running on them). Selecting a process gives you access to the buttons in the Devices View. Find yours in the list by looking for the package name.
With your process selected, click the "Update Threads" button in the Devices View to populate the Threads View.
The "Update Heap" button has the same effect for the Heap View. You will get to know the other Views as you need to for the apps you develop, some of them are relevant only to apps carrying out particular types of task. For now, just take a moment to notice a couple of aspects of the DDMS worth bearing in mind.
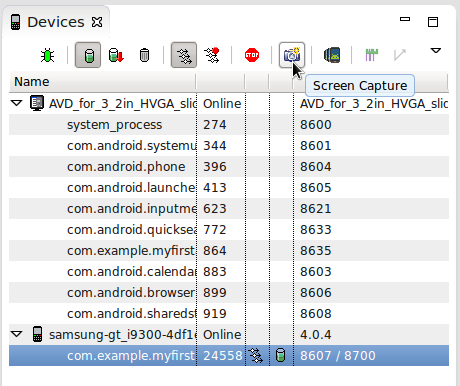
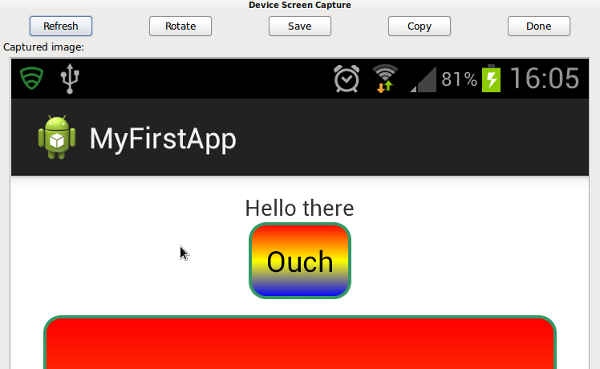
The Emulator View provides control over any running instances of virtual devices as you will see if you select an AVD in the Devices list and open the Emulator Control tab. Also, note that you can stop a running process in the Devices View, debug a running process, and force garbage collection. Before we finish looking at the DDMS, with your app visible on the screen of a hardware or virtual device, select the device in the Devices View and click the "Screen Capture" button.
An image of your device appears in a new window. From here you can save or copy the image to use in your promotional listings for the app, clicking Refresh to update the screen capture.
For additional tips on debugging your Android apps, see the Developer Guide.
Conclusion
When you start creating Android apps, your primary concerns will relate to running your apps and monitoring their behavior through logging messages to the console. However, as your projects become more complex and when you do get to the stage of preparing your apps for release, you will find the debugging and testing tools for Android in Eclipse indispensable. In the next part of this series, we will introduce the Android Activity lifecyle, which is vital to understand before you can start to create fully functional apps.

Comments