Network traffic analysis can be a vital part of the software debugging and testing process. This tutorial will teach you how to monitor all incoming and outgoing traffic on an Android device in order to better debug your applications!
As a developer, one often has to build software that performs HTTP requests, sends messages, or grabs information from incoming or outgoing requests over the network. When these network transactions work from the very beginning, all is good; we are receiving exactly what is expected and what we are sending is proper formatted and with the correct values.
However, this frequently does not happen, and one needs to understand exactly what is being sent and received over the network in order to determine what has gone wrong. Who knows, maybe the request is not even being made and we are not aware of it! This is a circumstance in which knowing how to capture and analyze the network traffic becomes crucial.
Capturing network traffic for later analysis is good, but it's even better if we are able to perform this analysis at the same time the capture is taking place. By doing so, one can know which request or response corresponds to each use case, thus making the analysis much easier. In the following steps, I will show you how to capture real time traffic from an Android device and pipe it to a network analyzer like Wireshark.
Step 1: Installing tcpdump
The first step is to install tcpdump on the device. tcpdump is a command-line utility that captures the traffic on a particular network device and dumps it to the filesystem. tcpdump can be downloaded from here.
Once the tcpdump binary has been downloaded, all we need to do is use adb to push the file onto the device. To be able to do so, your handset needs to be connected to and properly identified by your computer.
First things first, it is important that you update your path adding Android's SDK platform-tools directory to it if you haven't yet. In case you have never done it, there are clear instructions on how to do so on the android developers page. Ready? Open a terminal and type the following:
adb devices
The connected device should show up in a list. If this is not the case, make sure that it is correctly connected and that you have all the drivers needed for that specific handset.
See the device on the list? Great! We are now ready to push the tcpdump file onto it:
adb push /home/tcpdump /data/local
To perform the next few steps we need to gain root privileges on the device and make sure that tcpdump is executable:
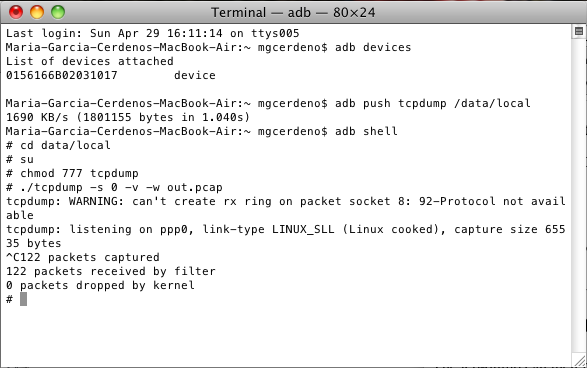
adb shell
cd data/local
su
chmod 777 tcpdump
Step 2: Saving the Traffic Dump to File
Tcpdump can now be started from the same adb shell and the output saved to a file:
./tcpdump -s 0 -v -w out.pcap
The complete list of tcpdump options can be found in the man page of tcpdump.
Once the dump is completed, we can stop capturing the data. In order to do so, you simply need to press Ctrl+C. The resulting file can be pulled out of the device and saved locally, so that it can get analyzed using Wireshark.
adb pull /data/local/out.pcap /home/out.pcap
But this is not exactly what we wanted, is it? What we want is to be able to pipe it to Wireshark in real time! Relax, we are getting there.
Step 3: Piping Network Traffic to a Port
The process of capturing the network packets is basically the same in this case. However, instead of writing the datagrams to a file, we want to write them to the standard output, so that we can then redirect them using netcat to a specific port on the handset.
In order to do so, the tcpdump command has to change slightly:
adb shell "./data/local/tcpdump -n -s 0 -w - | nc -l -p 12345"
The traffic is now being redirected to the port 12345 in the handset.
Step 4: Installing Netcat
Before going any further, lets make sure that you have netcat installed, as we are going to need it. Type nc in a new console, hit enter and look at what happens. Do you get the standard message explaining how to use the command? Awesome, you are good to go. Skip the rest of this section and keep going!
Still reading? Well, I guess that means you do not have netcat installed after all. Do not panic, you can download it from here for Windows.
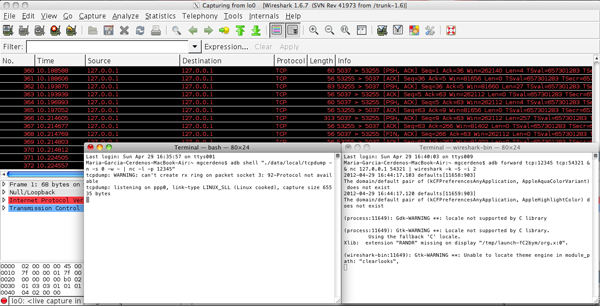
Step 5: Piping Traffic to Wireshark
Remember what we mentioned earlier regarding updating the path so that adb would be available? You want to do that with netcat and Wireshark as well.
Once this is done, we can use adb's forward option, which will forward the packets from the tcp port 12345 in the device to the tcp port 54321 on the PC. We will again use netcat to grab those incoming packets coming in through port 54321, and pipe them to Wireshark.
This is done in the following command, typed in a new console:
adb forward tcp:12345 tcp:54321 && nc 127.0.0.1 54321 | wireshark -k -S -i -
Note that the number of the port chosen is irrelevant. The only reason why different numbers have been chosen is to show how the different commands connect to each other. The same port number could have been used for both commands (or different numbers from the above, as long as the ports are not being used!) and then they would work just the same.
You need to make sure that Wireshark runs with the correct permissions. Otherwise, even when Wireshark gets opened, a popup will show up informing you of an exception.
Step 6: Making Life Easier
Once the different utilities have been set up, the process of capturing the network traffic and piping it into Wireshark is done through two commands, simultaneously running in two different terminals:
adb shell "./data/local/tcpdump -n -s 0 -w - | nc -l -p 12345"
adb forward tcp:12345 tcp:54321 && nc 127.0.0.1 54321 | wireshark -k -S -i -
Now, this process is still pretty manual. One has to manually open two terminals and type all those instructions, making sure nothing is left behind for this to work. This is a nuisance. Well, that problem is easily solved by putting these instructions onto a script, so that it does all the work for us.
Windows users can automate the process using the script in the download file attached to this post.
start adb shell "./data/local/tcpdump -n -s 0 -w - | nc -l -p 12345"
adb forward tcp:12345 tcp:54321 && nc 127.0.0.1 54321 | wireshark -k -S -i -
Notes for Mac Users
If you've been following this tutorial on a Mac, you are probably scratching your head, thinking why the above process does not really seem to be working for you. There are a couple of reasons why this might be the case. Let's try to fix that.
First of all, make sure that you are using the right path of Wireshark! This might seem trivial, but is is not. You do not want to use the path to the app, but the whole path to the actual Wireshark executable (e.g. "/Applications/Wireshark.app/Contents/Resources/bin/wireshark").
Fixed? Good! Just a couple more things to go. When invoking Wireshark through the command line, we are using a minus sign at the end. This represents the standard input and in Windows it will work just fine. However, this will not work on a Mac. Luckily, this can be substituted with the name of a pipe. You want to specify 2 (corresponding to lo0) as the pipe to use. Besides, you might need to grant super user permissions in order to be able to execute Wireshark. This is the resulting command that you want to use:
adb forward tcp:12345 tcp:54321 && nc 127.0.0.1 54321 | sudo wireshark -k -S -i 2
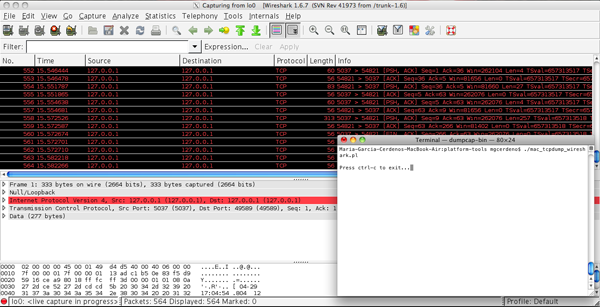
This is the perl script that will work for Mac users (it is also attached as a download to this post):
#!/usr/bin/perl

# Perform adb command on shell
# to check if the device is attached
$netstat = `adb shell 'netstat' 2>&1`;
if($netstat =~ m/error: device not found/)
{
die("Plug in your phone!\n");
}

# Gain root priviledges
open(SUDO, "|sudo echo ''");
close(SUDO);

# Redirect STDERR output to STDOUT
open STDERR, '>&STDOUT';

# Perform tcpdump and nc in background
open(COMMAND1, "(adb shell \"data/local/tcpdump -n -s 0 -w - | nc -l -p 12345\") |");

# Perform piping to wireshark
open(COMMAND2, "((adb forward tcp:12345 tcp:54321 && nc 127.0.0.1 54321 | sudo wireshark -k -S -i 2) &) 2>&1 > /dev/null |");

# Make sure the exit message appears after wireshark has been launched (hacky)
sleep(5);
print("Press ctrl-c to exit...");
<STDIN>;

Comments